Sample Category Title
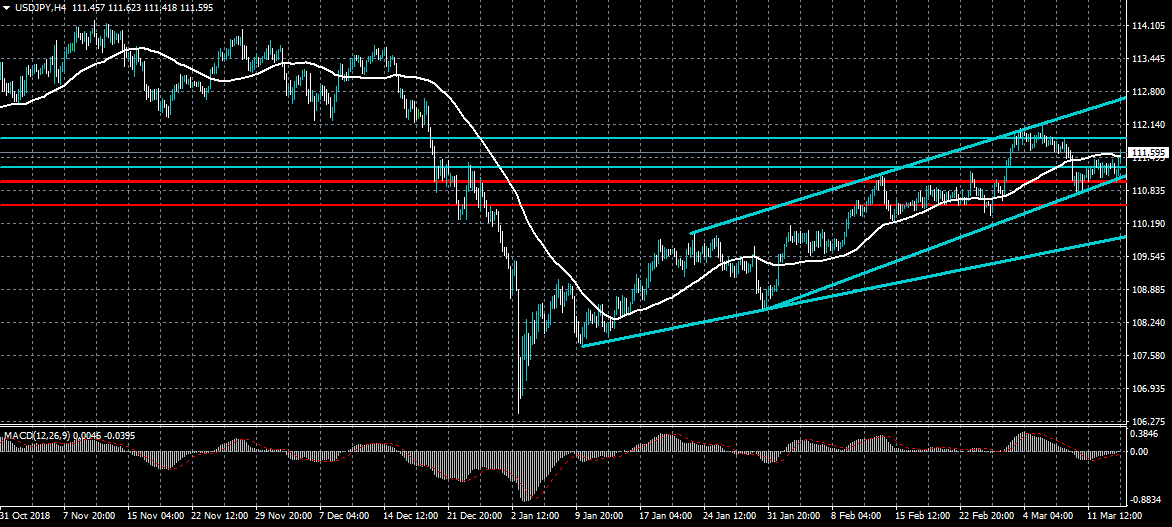
USDJPY Furhter Bullish Above 111.60
The US dollar is advancing higher against the Japanese yen on Thursday, with the pair breaking range and moving towards its weekly pivot point. Further intraday gains in the USDJPY pair are expected if bulls can hold price trades above the pivotal 111.60 level. The overall upside objective of the rising price channel on the four-hour time frame is currently located at the 112.80 level.
The USDJPY pair is intraday bullish while trading above the 111.60 level, key resistance is found at the 112.00 and 112.80 levels.
If the USDJPY pair falls below the 111.45 level, sellers may test towards the 111.30 and 111.10 support levels.
BTCUSD Testing Breakout Resistance
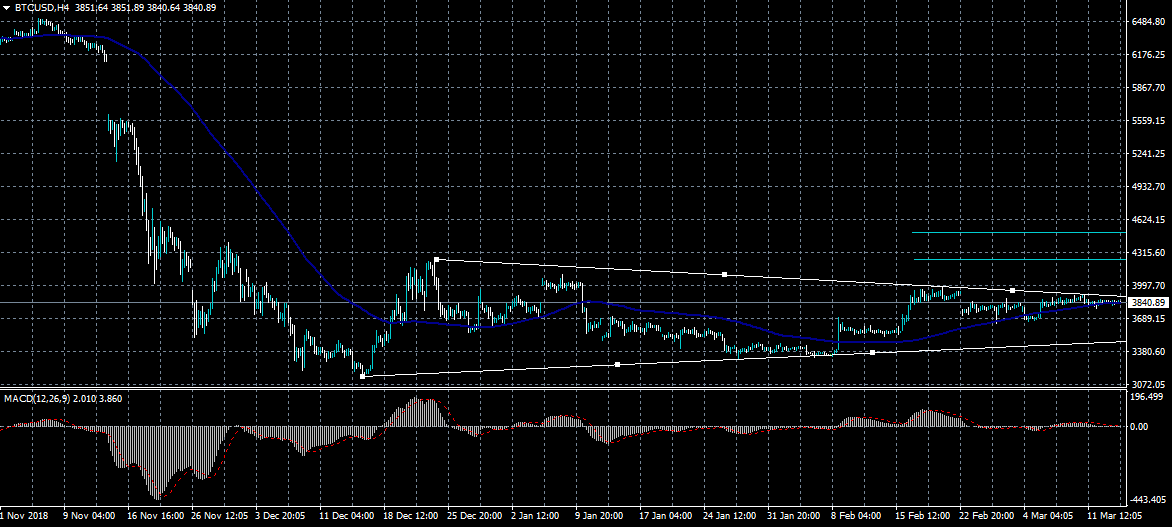
Bitcoin continues to trade around key weekly resistance, with the number one cryptocurrency by market capitalization moving closer to a major technical breakout. The BTCUSD pair has been trapped inside the triangle pattern for all of this year, with a bullish breakout likely to encourage strong technical buying. If sellers move price back under the $3,800 level, the BTCUSD pair may start to lose bullish momentum.
The BTCUSD pair is strongly bullish while trading above the $3,900 level, key technical resistance remains at the $4,200 and $4,400 levels.
If the BTCUSD pair moves under the $3,800 level, sellers may test towards the $3,700 and $3,630 support levels.
GBPUSD Volatility Continues
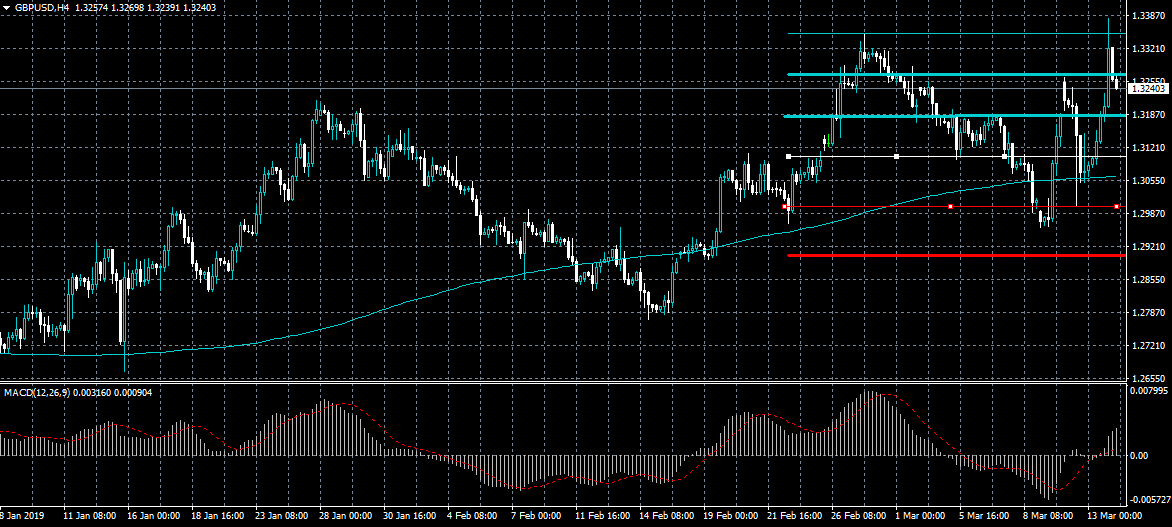
The British pound has moved to a fresh 2019 trading high against the US dollar after UK Parliament voted that a Brexit no-deal scenario should be ruled out. The GBPUSD pair has moved back under the 1.3300 level but still retains an intraday bullish bias while trading above the 1.3100 level. Traders should note that buyers have control of price-action, with the pair making higher highs and lower lows.
The GBPUSD pair is intraday bullish while trading above the 1.3100 level, key technical resistance is found at the 1.3300 and 1.3380 levels
If the GBPUSD pair trades below the 1.3100 level, sellers may test towards the 1.3055 and 1.2975 support levels.
Sterling Pares Gains After A No-Deal Brexit Ruled Out
The sterling rose after parliamentarians in the UK voted against the possibility of leaving the European Union without a deal. This was viewed as a victory for the market, which believes that leaving without a deal with the EU would be chaotic. It was, however, a blow to Eurosceptics who believe that the country can prosper under the World Trade Organization (WTO) rules. This vote leaves the country at a difficult place because the current plan is for the country to leave the EU on March 29. As such, no one knows what will happen if the day comes and passes without the parliament voting for a deal. Today, there will be another vote that will determine whether to extend the deadline. While this is a favorable thing, it will lead to more uncertainty for businesses and for individuals.
The price of crude oil continued the upward trend after data from the US showed reduced inventories. According to the EIA, crude inventories contracted by more than 3.86 million barrels. This drawdown was much lower than the gains of 2.6 million barrels that traders were expecting. Last week, the data showed that inventories had grown by more than 7 million barrels. Earlier in the day, data from the American Petroleum Institute (API) showed a drawdown of more than one million barrels.
In China, the weakness of the economy continued after the release of retail sales, industrial production, and fixed asset investments. In February, retail sales rose by an annualized rate of 8.2%, which was better than the expected 8.1%. It was in line with the growth in January. The industrial production continued weakening, with the growth coming at 5.3%, which was lower than the expected 5.5%. Fixed assets investments grew by 6.1%, which was in line with expectations.
XBR/USD
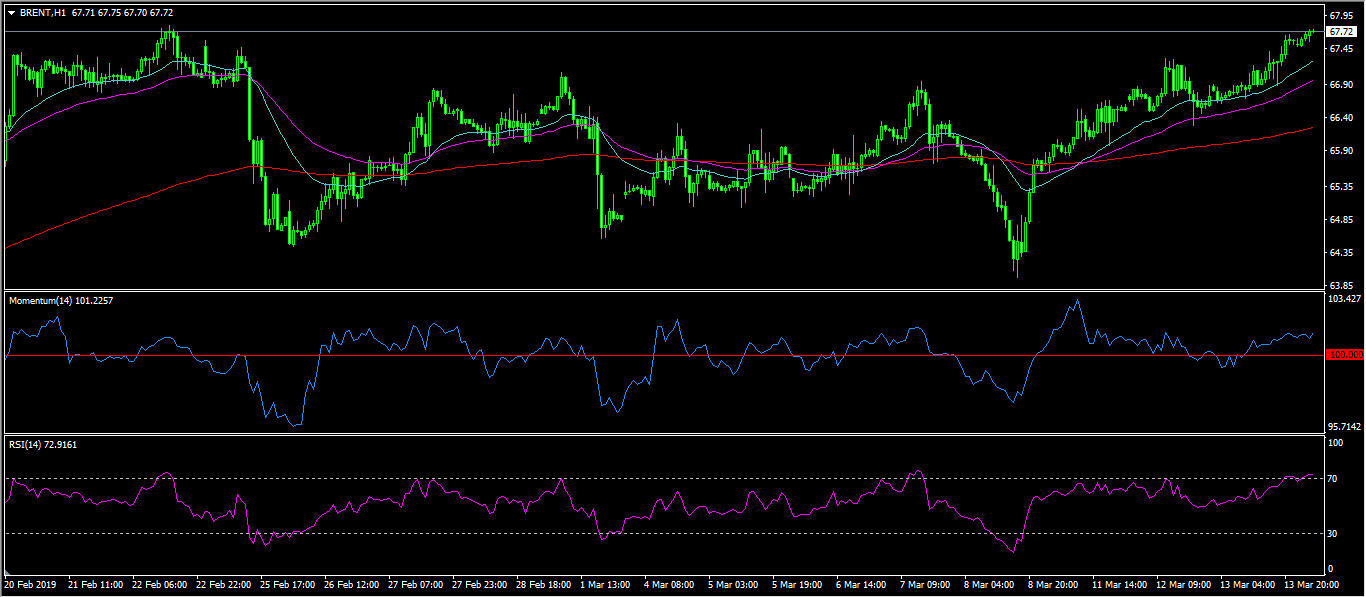
The XBR/USD pair rose to a high of 67.75, which was the highest level since February 22. In the past few weeks, the pair has moved from a low of 63.98. This sharp increase has come as investors bank on the supply cuts announced by OPEC and the perception that demand too will rise. On the hourly chart, the pair is trading above the 25-day, 50-day, and 200-day moving averages, while the momentum indicator has moved above 100 and the RSI has remained above 70. This momentum is likely to continue for the coming days.
EUR/USD
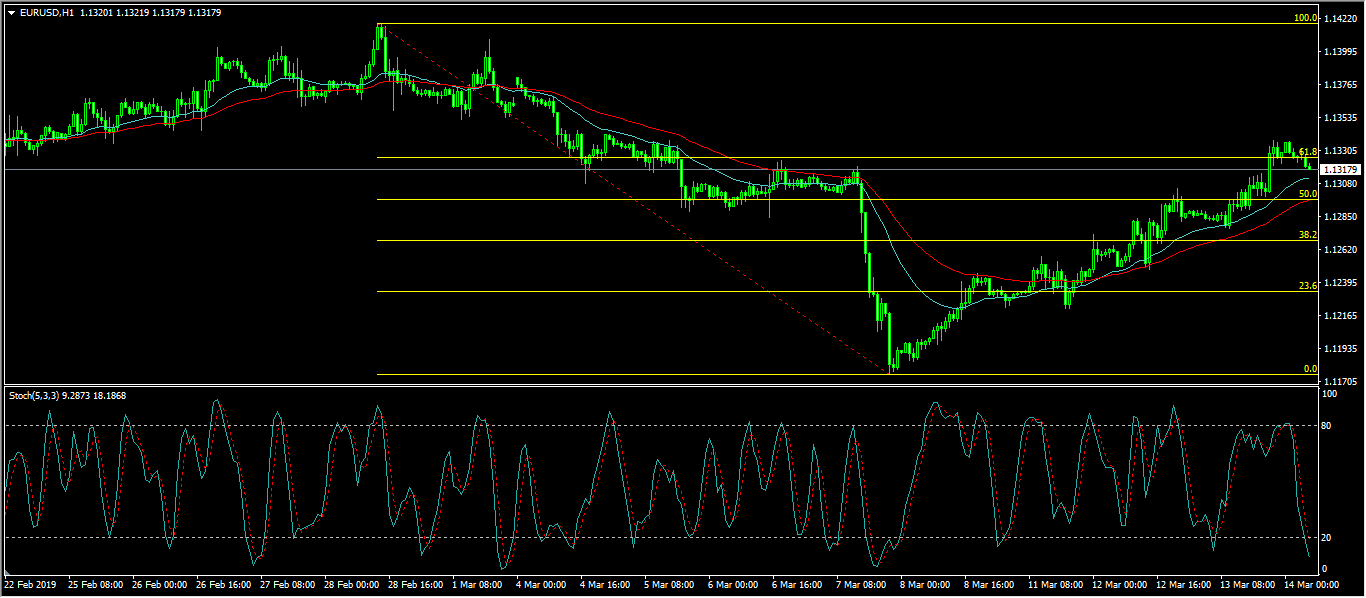
The EUR/USD pair declined slightly in overnight trading. The pair is now trading at 1.1320, which is slightly below the 61.8% Fibonacci Retracement level. The price is below the 25-day and 50-day moving averages. On the hourly chart, the 50-day EMA is along the 50% Fibonacci Retracement level. The signal line of the Stochastics Oscillator has moved below the oversold level of 20. The pair could continue moving lower until it tests the 50% Fibonacci level of 1.1297.
GBP/USD
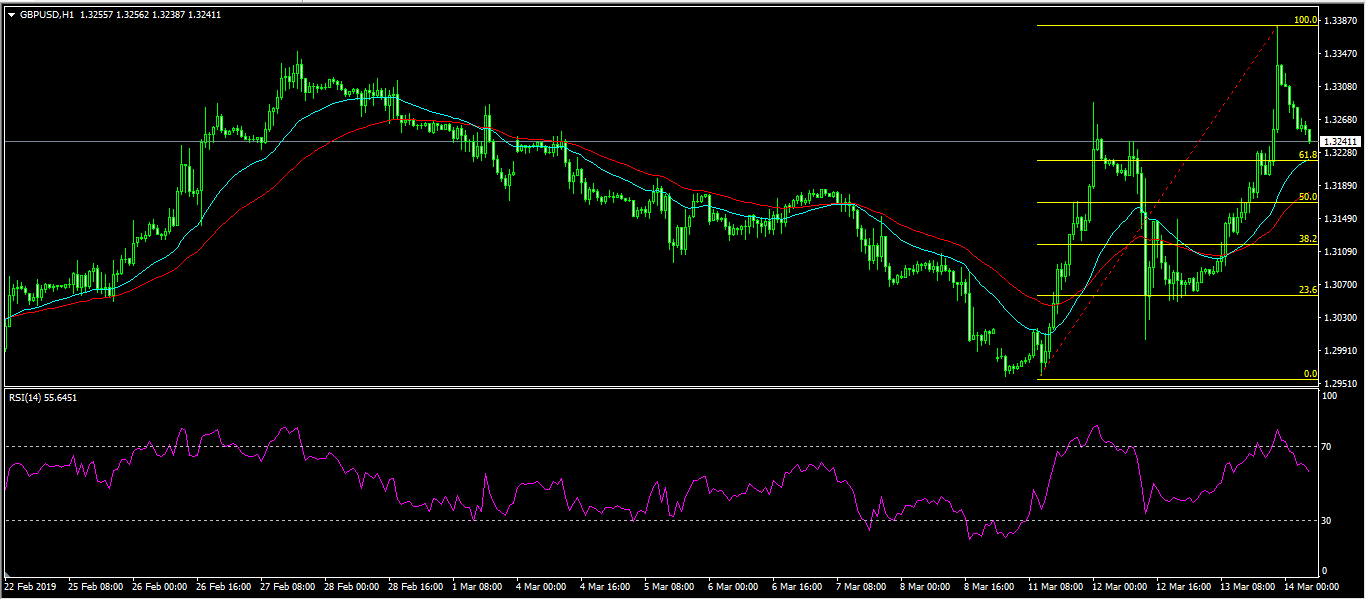
The sterling rose sharply after legislators voted against a no-deal Brexit. It reached a high of 1.3380, which was the highest level since June last year. The GBP/USD pair then pared those gains as traders sold the news. It is now trading at 1.3240. This price is above the 25-day and 50-day EMAs while the RSI has dropped from the overbought level of 78 to the current 58. The pair will likely reach the 50% Fibonacci level of 1.3166.
USDJPY Trapped Within Ascending Channel, Bias Neutral-To-Positive
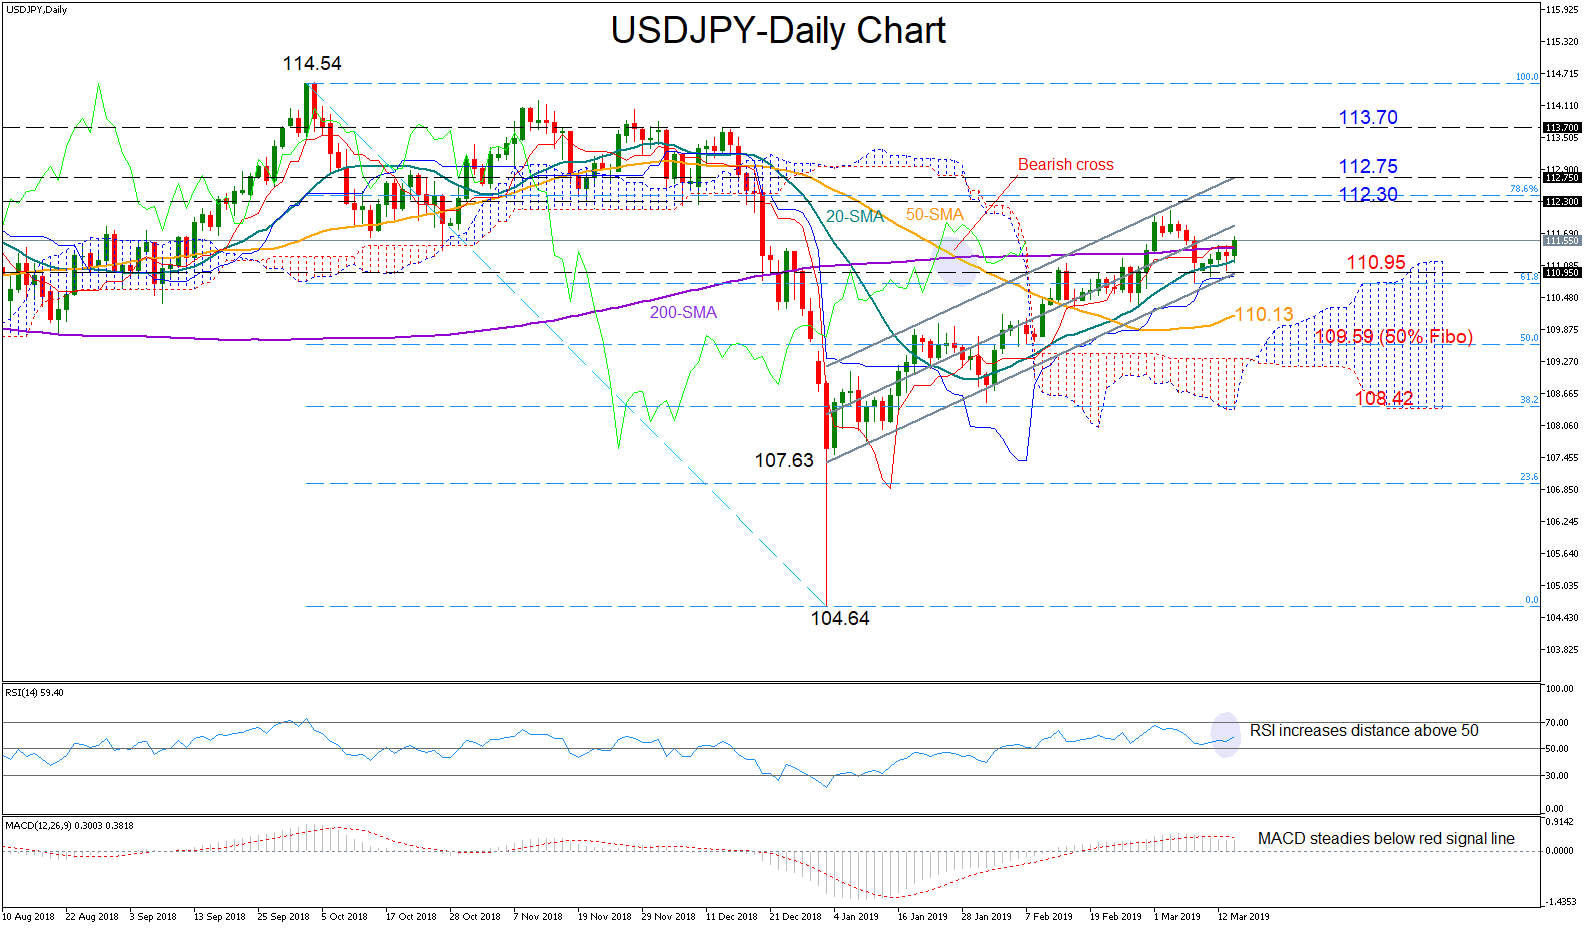
USDJPY has been softly rising this week within the 111 area, stretching the three-month long ascending channel even higher. The price is also above its shorter-term moving averages (20- and 50-day Mas) and is set to cross above the 200-day MA as well, giving additional positive trend signals.
In momentum indicators, the RSI continues to fluctuate in bullish territory and seems to be changing direction to the upside today but the MACD and the Ichimoku indicators (Tenkan-sen and Kijun-sen) have yet to show strength as both keep moving sideways, a sign that any gains could appear limited in the near term.
An extension higher could open the door for the 112.30 mark, the previous peak of the recent uptrend and a key support level between October and November. Moving slightly up, the bulls would push hard to break the upper line of the channel seen at 112.75. If efforts prove successful, the rally could continue until the 113.70 resistance.
Alternatively, if the bears retake control, the focus will shift down to the bottom of the channel at 110.95. Breaking that barrier, negative momentum could accelerate, leading the price probably towards the 50-day MA currently at 110.13 and then to 109.59, the 50% Fibonacci of the downleg from 114.54 to 104.64. Lower, the 38.2% Fibonacci of 108.42 could also act as support in case of steeper declines.
In the medium-term picture, USDJPY needs to clear the 114.54 top for the outlook to switch to a bullish one.
Summarizing, the short-term bias looks neutral-to-positive, while in the medium-term the neutral outlook is still intact.
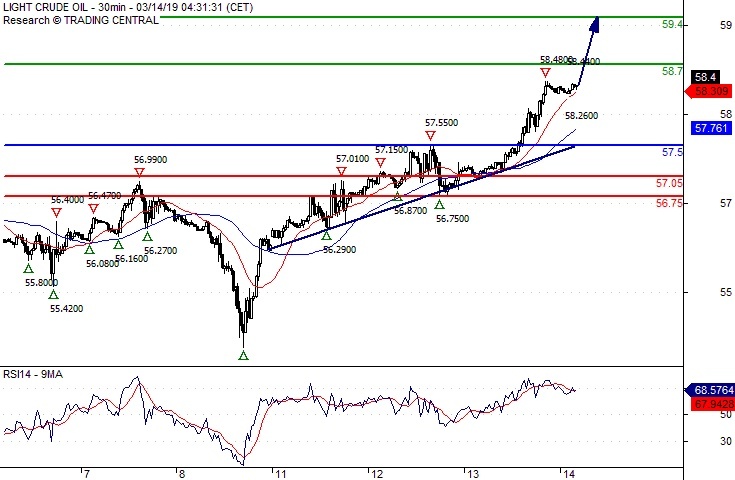
Crude Oil Further Advance
Pivot (invalidation): 57.50
Our preference Long positions above 57.50 with targets at 58.70 & 59.40 in extension.
Alternative scenario Below 57.50 look for further downside with 57.05 & 56.75 as targets.
Comment The RSI is bullish and calls for further advance
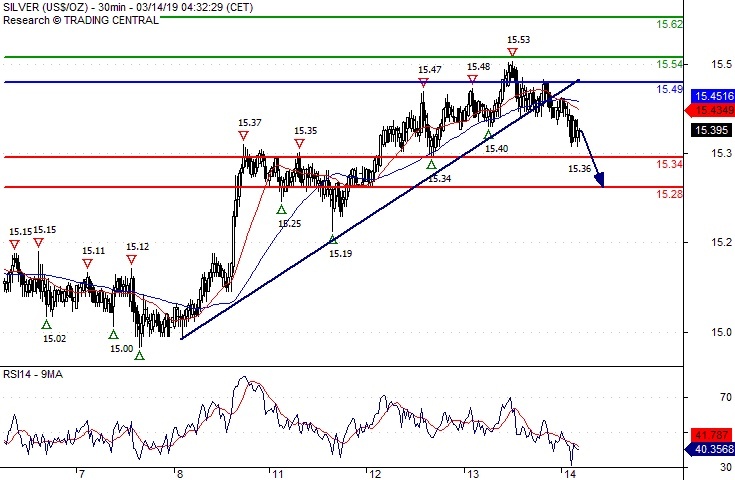
Silver Spot Watch 15.2800
Pivot (invalidation): 15.4900
Our preference Short positions below 15.4900 with targets at 15.3400 & 15.2800 in extension.
Alternative scenario Above 15.4900 look for further upside with 15.5400 & 15.6200 as targets.
Comment The RSI lacks downward momentum.
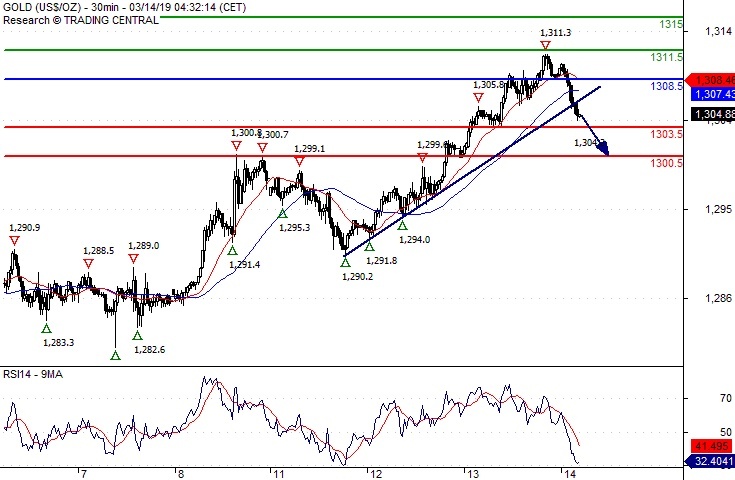
Gold Spot Break Of A ST Rising Trendline Support
Pivot (invalidation): 1308.50
Our preference Short positions below 1308.50 with targets at 1303.50 & 1300.50 in extension.
Alternative scenario Above 1308.50 look for further upside with 1311.50 & 1315.00 as targets.
Comment The RSI is bearish and calls for further downside.
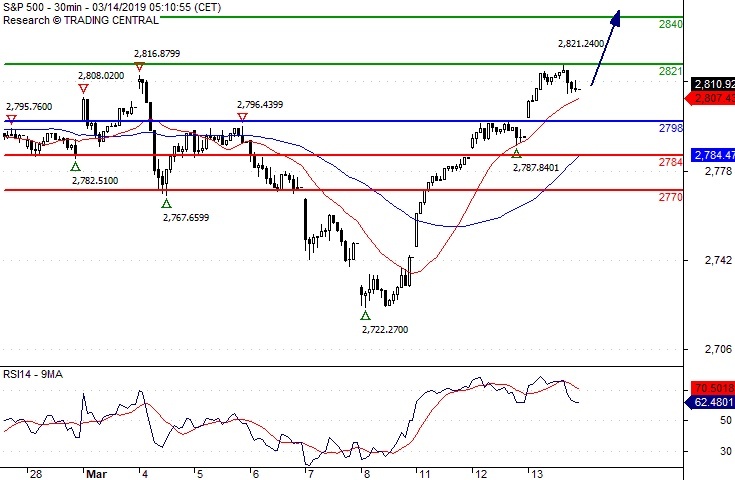
S&P 500 Target 2840.00
Pivot (invalidation): 2798.00
Our preference Long positions above 2798.00 with targets at 2821.00 & 2840.00 in extension.
Alternative scenario Below 2798.00 look for further downside with 2784.00 & 2770.00 as targets.
Comment Technically the RSI is above its neutrality area at 50
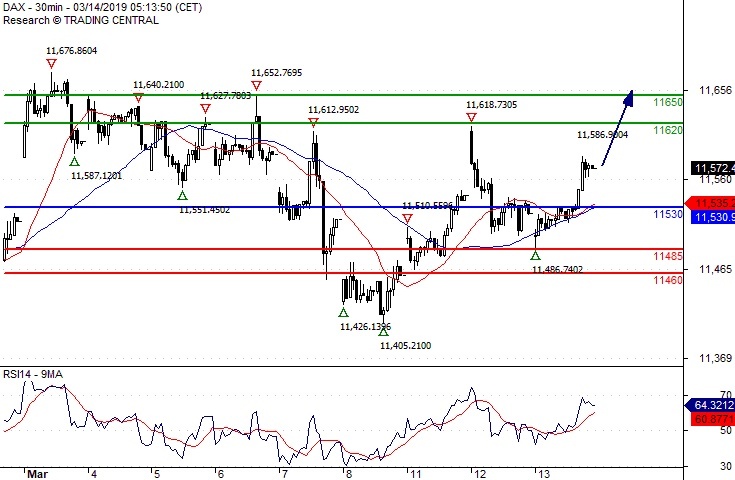
DAX Further Advance
Pivot (invalidation): 11530.00
Our preference Long positions above 11530.00 with targets at 11620.00 & 11650.00 in extension.
Alternative scenario Below 11530.00 look for further downside with 11485.00 & 11460.00 as targets.
Comment The break above 11530.00 is a positive signal that has opened a path to 11620.00.