Sample Category Title
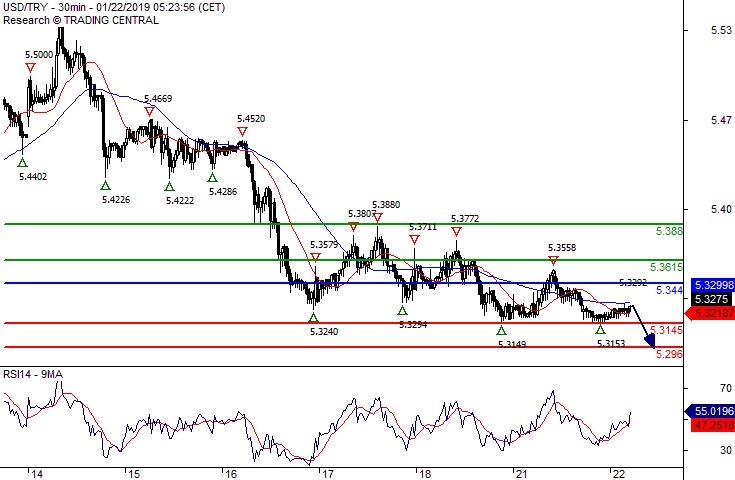
USD/TRY Under Pressure
Pivot (invalidation): 5.3440
Our preference Short positions below 5.3440 with targets at 5.3145 & 5.2960 in extension.
Alternative scenario Above 5.3440 look for further upside with 5.3615 & 5.3880 as targets.
Comment A break below 5.3145 would trigger a drop towards 5.2960.
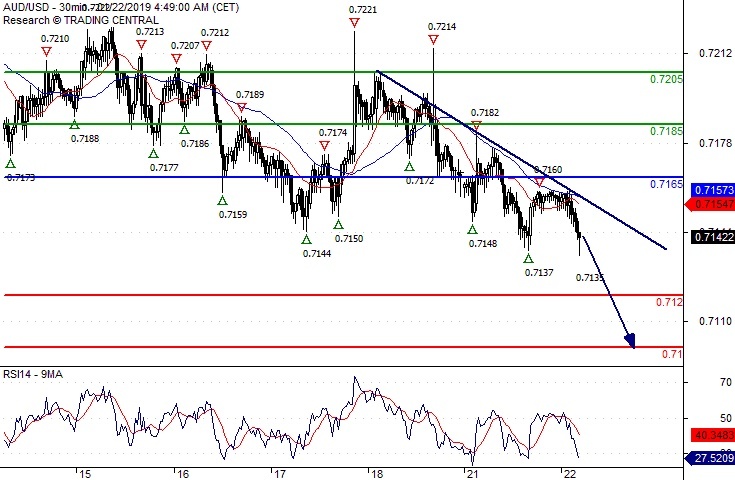
AUD/USD Under Pressure
Pivot (invalidation): 0.7165
Our preference Short positions below 0.7165 with targets at 0.7120 & 0.7100 in extension.
Alternative scenario Above 0.7165 look for further upside with 0.7185 & 0.7205 as targets.
Comment The RSI has broken up its 30 level.
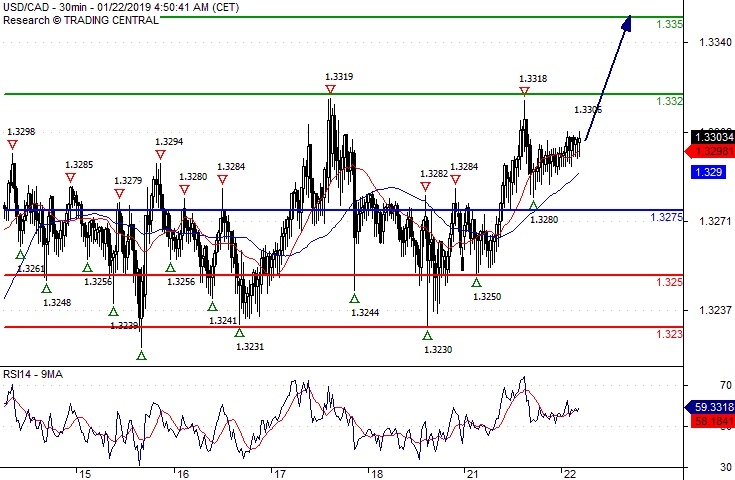
USD/CAD Further Advance
Pivot (invalidation): 1.3275
Our preference Long positions above 1.3275 with targets at 1.3320 & 1.3350 in extension.
Alternative scenario Below 1.3275 look for further downside with 1.3250 & 1.3230 as targets.
Comment The RSI calls for a bounce.
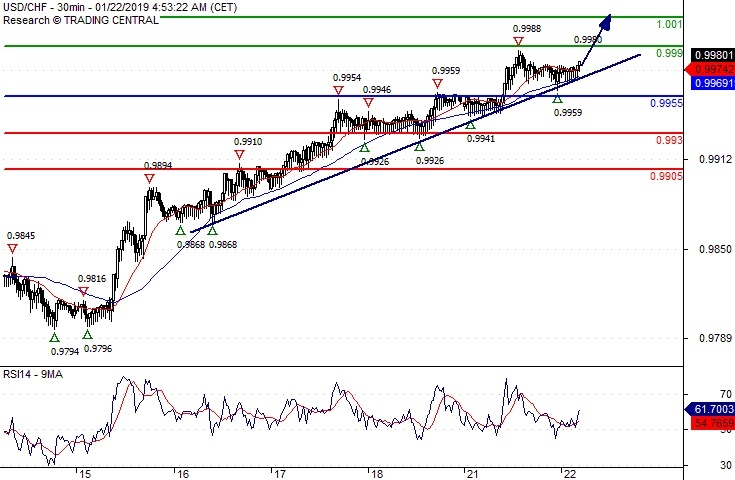
USD/CHF The Upside Prevails
Pivot (invalidation): 0.9955
Our preference Long positions above 0.9955 with targets at 0.9990 & 1.0010 in extension.
Alternative scenario Below 0.9955 look for further downside with 0.9930 & 0.9905 as targets.
Comment The RSI is bullish and calls for further upside.
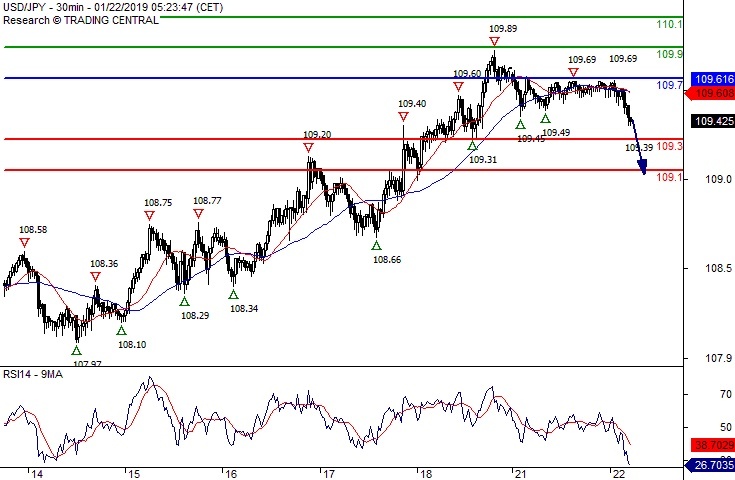
USD/JPY Turning Down
Pivot (invalidation): 109.70
Our preference Short positions below 109.70 with targets at 109.30 & 109.10 in extension.
Alternative scenario Above 109.70 look for further upside with 109.90 & 110.10 as targets.
Comment The RSI has broken down its 30 level.
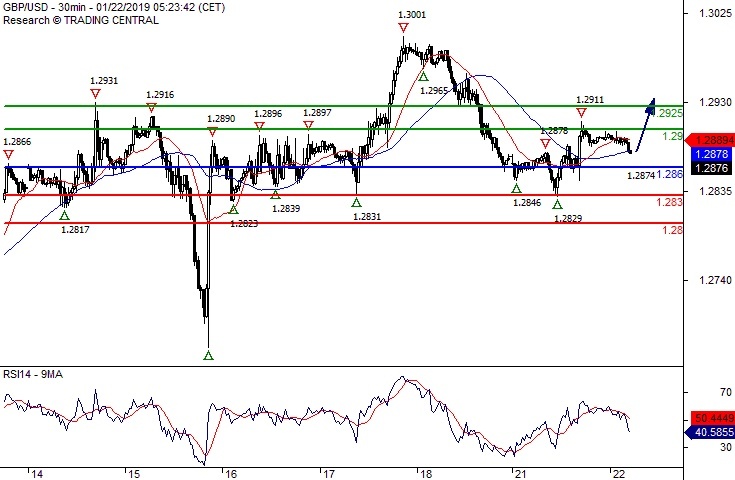
GBP/USD Bullish Bias Above 1.2860
Pivot (invalidation): 1.2860
Our preference Long positions above 1.2860 with targets at 1.2900 & 1.2925 in extension.
Alternative scenario Below 1.2860 look for further downside with 1.2830 & 1.2800 as targets.
Comment Even though a continuation of the consolidation cannot be ruled out, its extent should be limited.
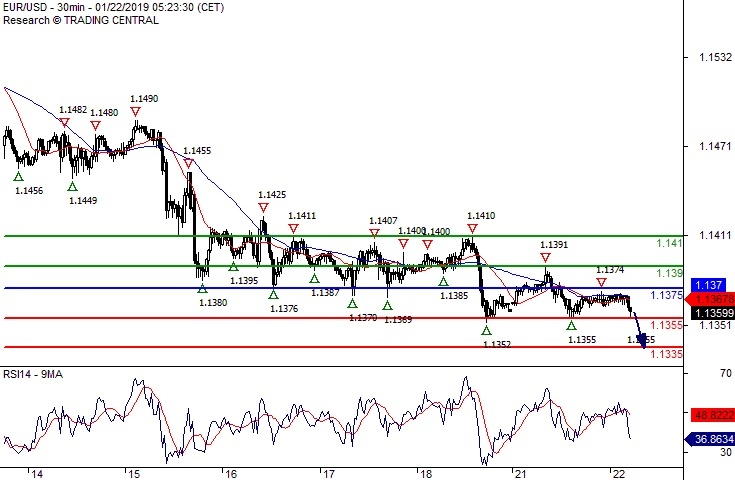
EUR/USD Aim @ 1.1335
Pivot (invalidation): 1.1375
Our preference Short positions below 1.1375 with targets at 1.1355 & 1.1335 in extension.
Alternative scenario Above 1.1375 look for further upside with 1.1390 & 1.1410 as targets.
Comment A break below 1.1355 would trigger a drop towards 1.1335.
EURUSD Loses Momentum, Re-Tests Short Term Rising Trend Line
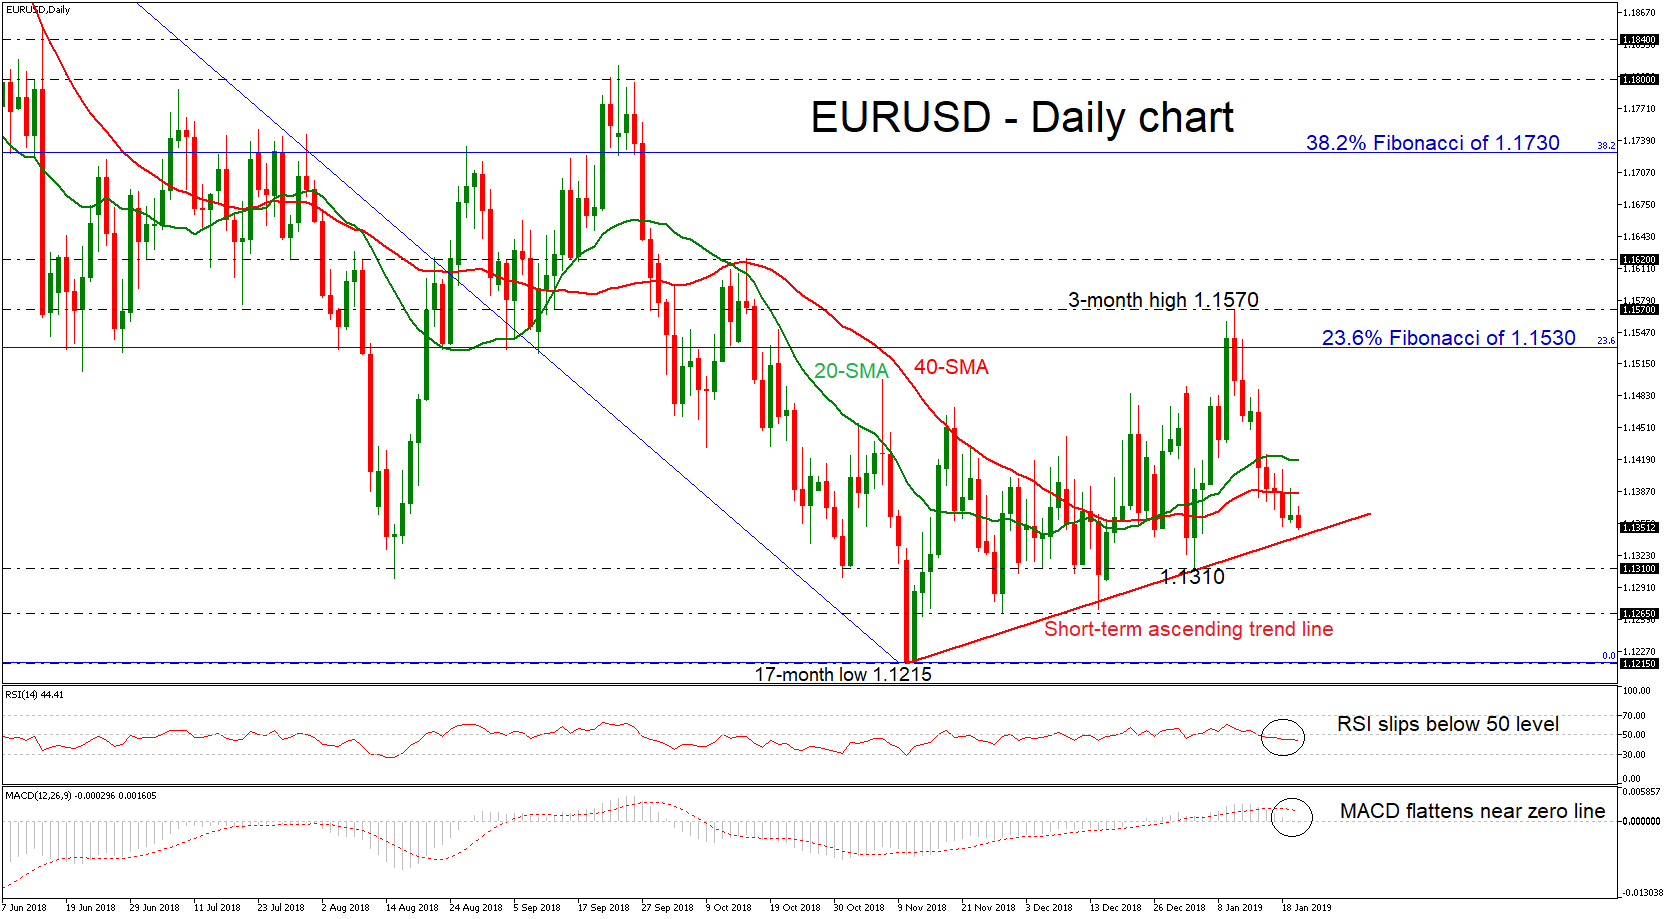
EURUSD has declined considerably after finding strong resistance level on the three-month high of 1.1570 on January 10. The world’s most traded currency pair is now ready to re-test the short-term ascending trend line, which has been holding since November 12, while it dropped below the 20- and 40-simple moving averages (SMAs) in the daily timeframe.
Looking at the technical indicators, the RSI is losing momentum beneath its neutral threshold of 50, while the MACD oscillator is flattening near the zero line following the bearish crossover with its trigger line in the positive zone. Yet the latter could also be an indication that the downward rally is overdone, and hence a rebound on the diagonal line should not be a surprise in coming sessions.
Penetrating the aforementioned diagonal line and moving lower, support is expected to come around 1.1310 where the price stopped on January 3. Should this prove a weak obstacle, the selling could pick up speed until the 1.1265 low, where any violation could bring more pressure to the market, with the price probably stretching further down to test the 17-month low of 1.1215.
Alternatively, in case of a rebound, immediate resistance could come from the 40- and then from the 20-day SMAs currently at 1.1385 and 1.1420 respectively. Higher, the 23.6% Fibonacci retracement level of the downleg from 1.2550 to 1.1215, near 1.1530, could also restrict upside movements, while a run above this barrier could lead prices towards 1.1570 again.
In the short-term picture, EURUSD is still increasing bullish tendency as long as it moves above the rising trend line, but in the long-term view, the price has been remaining in negative structure since February 2018.
ETHUSD Trading At Critical Juncture
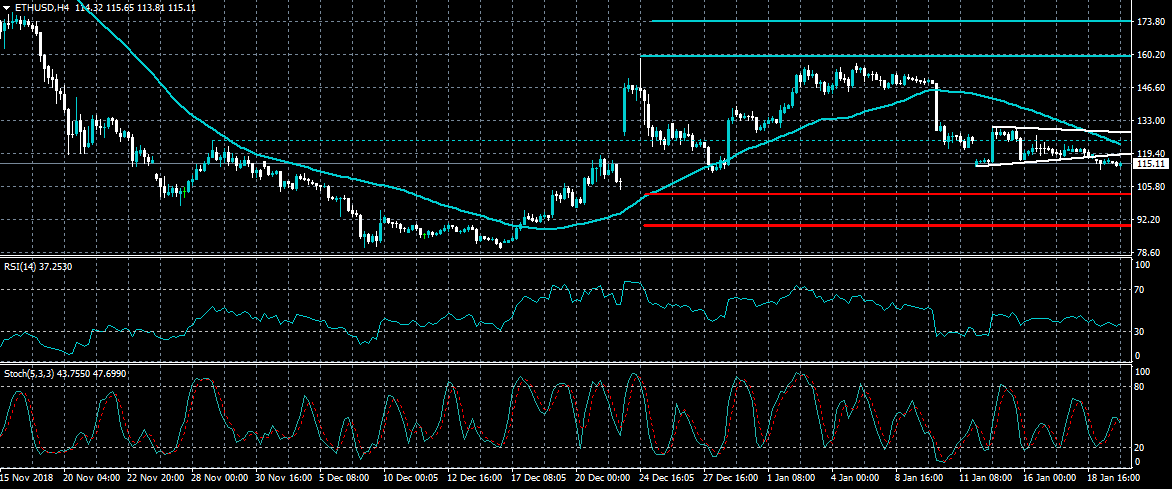
Ethereum sellers are struggling to break the $110.00 support level on Tuesday, despite the third largest cryptocurrencies bearish start to the new trading week. The RSI indicator on the four-hour time frame remains close to oversold, while the Stochastic indicator on the mentioned time frame remains inconclusive at present. A clear break from the $110.00 to $125.00 price range should decide the next directional move in the ETHUSD pair.
The ETHUSD pair is only bullish while trading above the $125.00 level, key resistance is found at the 140.00 and $158.00 levels.
If ETHUSD pair falls under the $110.00 level, key support is found at the $104.00 and 92.00 levels.
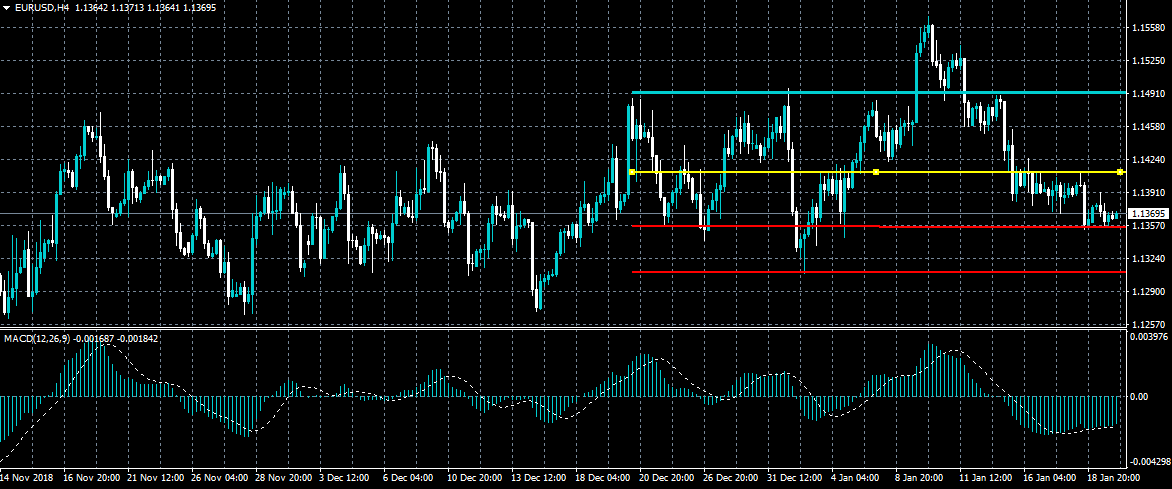
EURUSD Selling Momentum Easing
The euro currency is trading in an increasingly narrow trading range against the US dollar on Tuesday, as the recent bearish selling momentum starts to ease. Further losses in the EURUSD remain possible, although sellers are struggling to hold price below the 1.1360 level. Traders are also starting to become cautious ahead of Thursday’s key European Central Bank meeting.
The EURUSD pair is intraday bearish while trading below the 1.1410 level, key technical support is found at the 1.1360 and 1.1300 levels.
If the EURUSD pair moves above the 1.1410 level, buyers may test towards the 1.1460 and 1.1490 resistance levels.