

Sample Category Title
USDJPY Awaits G20 Summit Outcome
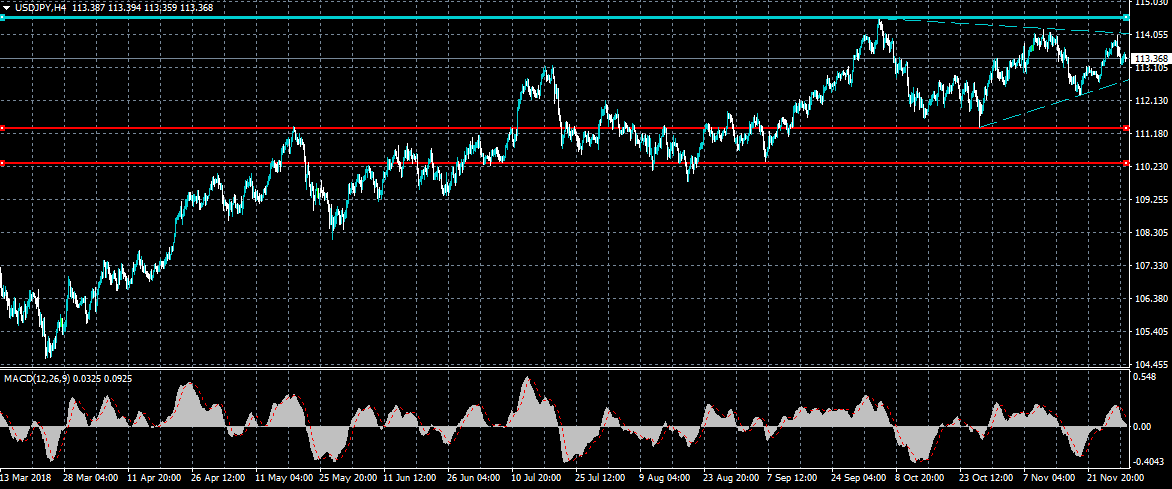
The US dollar is trading with a cautious tone against the Japanese yen, as financial market participants await the outcome of US President Trump’s meeting with Chinese President Xi Jinping at the G20 Summit. A bullish outcome from the leaders meeting will likely support heavy USDJPY buying, while a bearish outcome should put further downside pressure on the USDJPY pair.
The USDJPY pair is only bullish while trading above the 114.02 level, key resistance is found at the 114.54 and 115.00 levels.
If the USDJPY pair trades below the 113.15 level, key technical support is found at the 112.60 and 111.30 levels.
EURUSD Technical Breakout Looms
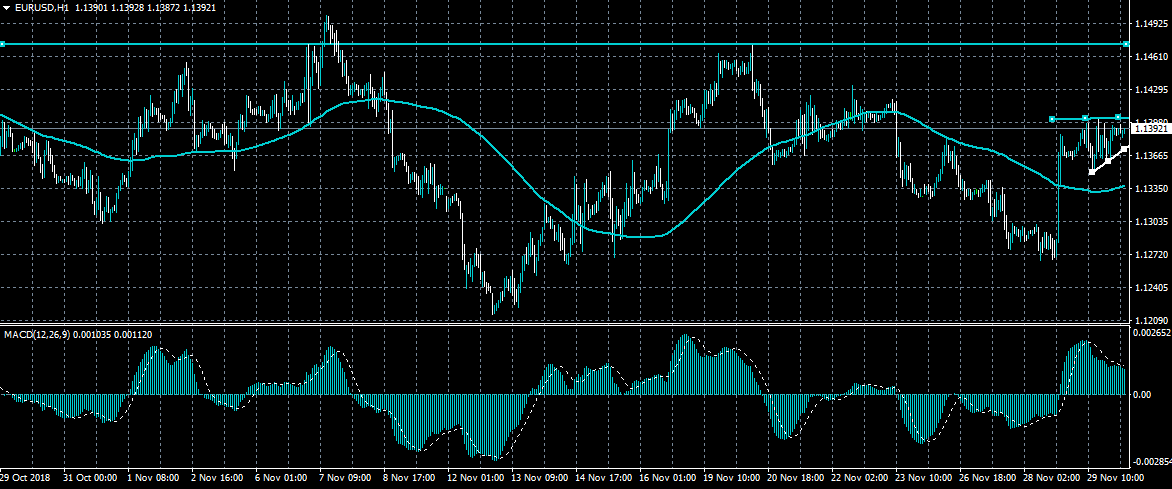
The euro is trading within a narrow range against the US dollar, as price continues to consolidate inside an ascending triangle pattern. A break above the 1.1400 resistance level exposes further upside towards the 1.1470 level, while a clear breach of the 1.1370 level may provoke a technical test of the 1.1335 support level. The G20 summit and the release of EU inflation data during the European session also remains a key focus of traders and investors.
The EURUSD pair is only bullish while trading above the 1.1400 level, key technical resistance is found at the 1.1470 and 1.1500 levels.
If the EURUSD pair continues to trade below the 1.1370 level, sellers may test the 1.1335 and 1.1300 levels.
Getting Technical: Managing the Fed Funds Rate
Executive Summary
The fed funds rate is the most well-known policy tool in the Federal Reserve's toolkit. When the Federal Open Market Committee (FOMC) makes its policy decisions, it sets a target range of 25bps in which the effective fed funds rate is permitted to float. The effective fed funds rate, or the actual rate at which financial institutions lend reserves overnight to one another, has recently drifted toward the upper bound of the target range, repeating a phenomenon that occurred earlier this year and eventually led to a "technical adjustment" in the way the Fed operationally influences shortterm interest rates. Minutes from the FOMC's November meeting released today showed that committee members are again contemplating another technical tweak due to a similar conundrum.1 In this special report, we offer a concise primer on the way the Federal Reserve controls the fed funds rate in the post-crisis era. In addition, we explore some possible causes of this recent upward move in the effective fed funds rate and discuss the implications for the Fed's balance sheet normalization, the future of monetary policy operations and the interest rate outlook more broadly.
Why Does the Fed Pay Interest on Excess Reserves in the First Place?
At each of its regularly scheduled meetings, the FOMC sets a target range for its main policy rate, the fed funds rate. Prior to the financial crisis, the Fed targeted a single number, while in recent years it has targeted a range, with the upper and lower bounds separated by 25bps. Importantly, the fed funds rate is a market-determined rate, as the supply and demand for reserves determines the market-clearing fed funds rate. In practice, this means that in order for the target to be met, the Federal Reserve must undertake some type of proactive policy to bring the actual fed funds rate inline with the FOMC's target.
Prior to the financial crisis, the Fed primarily accomplished this by buying or selling Treasury securities through open market operations, thereby influencing the supply of reserves in the fed funds market. To keep the effective fed funds rate from going above the target, the Fed would buy a small amount of Treasury securities, thus increasing the supply of reserves in the system and putting downward pressure on the fed funds rate. Conversely, the Fed would sell a small amount of Treasury securities to push up the fed funds rate.
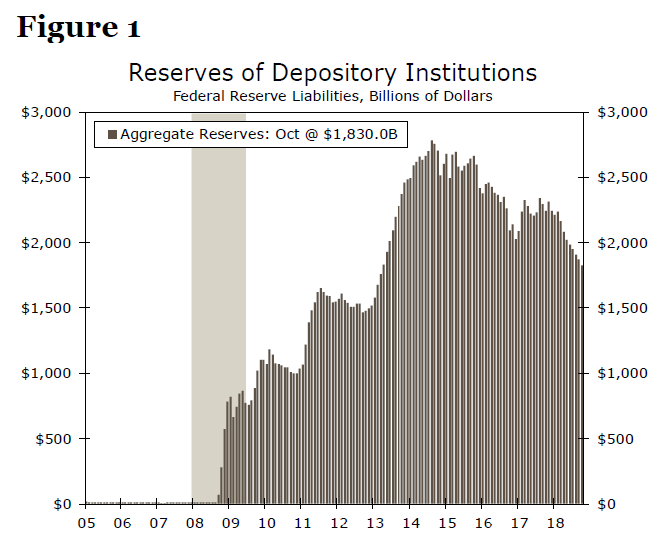
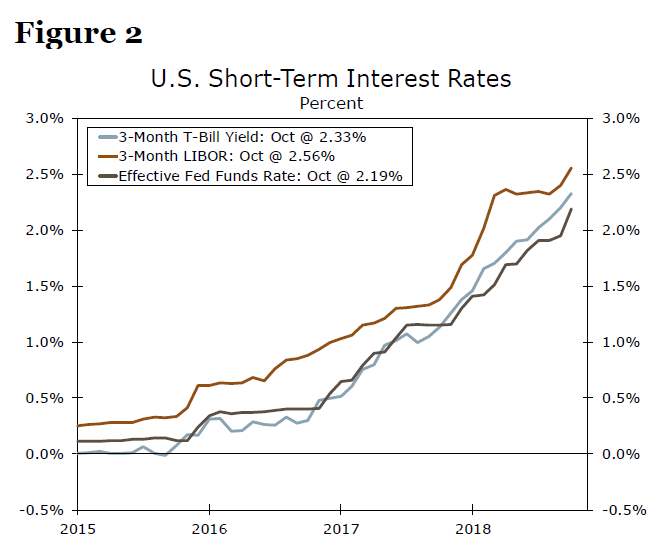
However, the Fed's asset purchase programs during and after the Great Recession resulted in an explosion of reserves held at the Federal Reserve, currently totaling more than $1.8 trillion (Figure 1). With a significantly higher level of reserves, the Fed was no longer able to easily manipulate the effective fed funds rate by engaging in small open market operations. As a result, the Fed began utilizing two additional policy levers to control the effective fed funds rate: interest on excess reserves (IOER) and overnight reverse repurchase agreements (ON RRP). In short, these two rates help to anchor the effective fed funds rate within the target range despite the abundance of reserves in the system.2 As seen in Figure 2, the Federal Reserve has been generally quite successful in utilizing these new tools to pull up short-term interest rates in the economy across a range of different financial instruments.
IOER: Coming into Focus Again
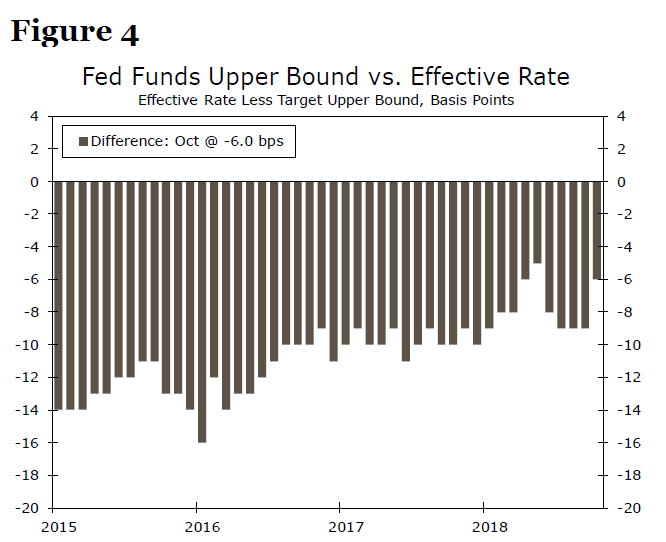
Until recently, IOER and ON RRP have been largely successful at keeping the effective fed funds rate within its target range. For most of this cycle, IOER has been set at the upper bound of the FOMC's target range for the fed funds rate, while the ON RRP has been set at the lower bound, with the effective fed funds rate somewhere in the middle (Figure 3). However, earlier this year the effective fed funds rate began drifting towards the upper bound of the Fed's target range, narrowing to just 5bps at one point. This led the FOMC to make a "technical adjustment" to the transmission of monetary policy by only increasing the IOER rate by 20bps at its June meeting, whereas the target range for the fed funds rate went up by 25bps. By lifting IOER by a bit less, the effective fed funds rate once again moved back towards the midpoint of the range.
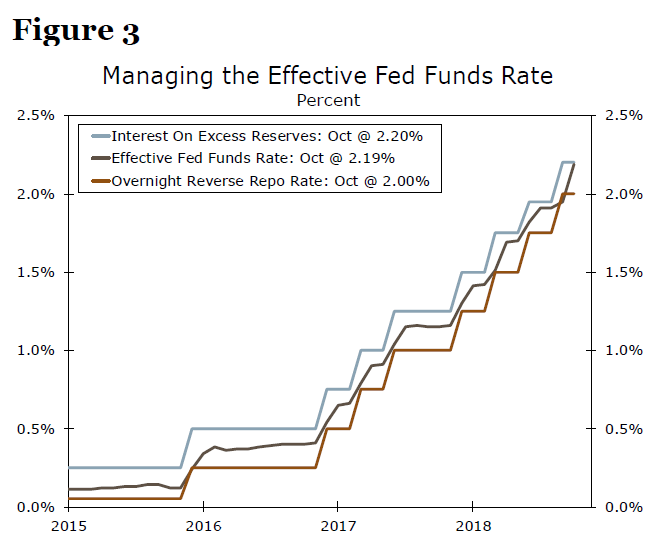
This "technical adjustment" worked for a time, but the issue has begun to creep back into focus. At present, the effective fed funds rate has once again drifted toward the upper bound, and the effective fed funds rate is now essentially equal to IOER (Figures 3 & 4). Why is this happening, and what does it mean for financial market participants and the economy?
Short-Term Factors or a Fundamental Issue?
One explanation put forth has been that a surge in Treasury bill issuance by the federal government has been the source of disruption. As seen in Figure 5, net T-bill supply exploded in the first quarter, with the surge coming for a host of reasons, including the suspension of the debt ceiling, the implementation of the tax cuts and the large seasonal deficit that occurs in Q1.
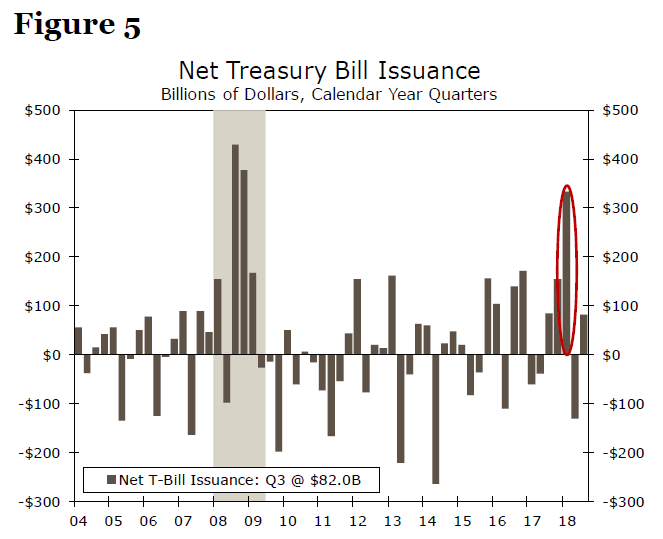
So what do T-bills have to do with fed funds? When the Treasury issues a slew of T-bills, the primary dealers (banks) buy up the new supply at auction. With an onslaught of supply, the primary dealers are sitting on more T-bills than they probably want or need, so they lend these securities through overnight repurchase agreements. As the primary dealers all compete to lend these securities, supply outstrips demand and the rate they need to offer to clear the market rises. Meanwhile, over in the fed funds market, a parallel market of overnight lending and borrowing, lenders (primarily the government-sponsored enterprises (GSEs), more on them later) see these higher repo rates as an attractive alternative investment. As capital flows towards the more attractive investment in the repo market, the reduced availability of fed funds then puts upward pressure on the fed funds rate, all else equal. Put more simply, a surge in T-bill supply has pushed up rates on repurchase agreements, which in turn have put upward pressure on other overnight interest rates, such as the fed funds rate.
Alternatively, the rising effective fed funds rate could signal a more fundamental scarcity of reserves as the Fed's balance sheet unwind continues. Just as total reserves rose markedly during the Fed's asset purchase program, the current shrinking of the Federal Reserve's balance sheet means the supply of reserves has also been declining. Since the peak in August 2014, total reserves at the Federal Reserve have fallen by almost $1 trillion (Figure 1, front page). Given that the fed funds rate is determined by supply and demand for reserves, a decline in the stock of reserves could lead to more competition for the steadily shrinking supply, putting upward pressure on the fed funds rate.
OK, So Why Should We Care?
These topics are critical for those who spend their time deep in the weeds of short-term interest rates, but a deep dive into the implications for money markets is beyond the scope of this report. We leave it to a future paper to cover this particular sub-topic in greater depth. More fundamentally, there are two key reasons to care about the prospects for the fed funds rate, IOER and monetary policy transmission mechanisms more broadly. First, there is a credibility challenge facing the Federal Reserve. For obvious reasons, the Fed does not want to appear unable to soundly manage its main policy rate. Second, if reserves are becoming truly scarce, balance sheet shrinkage may have to end sooner than anticipated to maintain a sufficient supply of reserves to keep monetary policy functioning effectively.
Thus far, the Federal Reserve has appeared unsympathetic to the argument that reserves are becoming scarce. Minutes from FOMC meetings and Fed speakers suggest policymakers on net put much more stock in the T-bill supply argument. Recent comments from Simon Potter, the Head of the Markets Group at the Federal Reserve Bank of New York, highlight this sentiment: "Let me be clear: Observing the EFFR [effective federal funds rate] and other rates above the IOR [interest on reserves] rate is not a sufficient condition for reserve scarcity. In the last few days, even amid upward pressure in overnight funding rates, we still have not seen the range of signs I described earlier that would indicate reserve scarcity."3 The minutes from today reinforced this belief, citing that "the upward pressure on the effective fed funds rate and other money market rates reportedly stemmed partly from a sizable increase in Treasury bill supply."
While this makes sense to us, one has to ask at what point a more permanent solution needs to be reached. If the recent disruptions have stemmed from too much T-bill issuance, perhaps the solution lies in the Treasury Department increasing its reliance on longer-dated Treasury securities to meet the government's financing need. This solution, however, is largely beyond the Fed's control. Alternatively, the Federal Reserve could begin buying Treasury bills at some point, either to replace maturing mortgage-backed securities or simply as part of organic balance sheet growth. We covered this possibility in greater detail in part II of our series on the outlook for the Fed's balance sheet.4
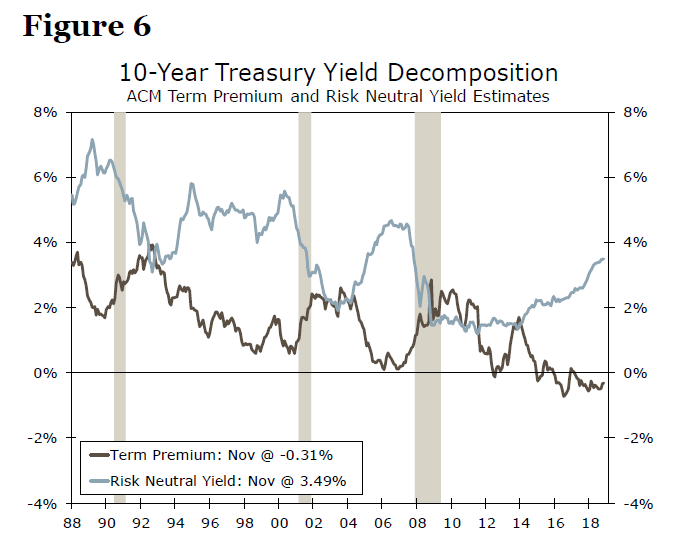
Perhaps more fundamentally, the instrument over which the Fed has the most direct control is the level of reserves, which is tied directly to its balance sheet unwind program. As we have written previously, we expect reserves to stop shrinking sometime in late 2019/early 2020 once they have reached a level of about $1.0-$1.5 trillion.5 But, the appropriate level of reserves is very difficult to pin down, even for the Fed, and this is the first time the Federal Reserve has attempted a maneuver of this type or magnitude. Were the Fed to end the balance sheet unwind even sooner than we anticipate, this would imply an even larger terminal size for the balance sheet, and, in turn, much larger holdings of Treasury securities and/or mortgage-backed securities. These large, perpetual holdings would mean some additional and permanent suppression of long-term interest rates relative to the pre-crisis era, all else equal. The already-negative term premium could remain suppressed for even longer into the current expansion (Figure 6).
A final point we would like to make is that it is not completely unfeasible that, with time, the Federal Reserve could consider alternatives to the fed funds rate as its main policy rate. The minutes hinted at this development, noting that "the staff briefings also examined the tradeoffs between alternative policy rates that the Committee could choose in each of the [limited versus abundant reserve] regimes" and "participants cited several potential benefits of targeting the overnight bank funding rate (OBFR) rather than the effective fed funds rate." In the pre-crisis era of scarce reserves, the fed funds market was robust, with an estimated average daily volume of more than $250 billion and the majority of activity occurring between banks.6 Today, in a world of abundant reserves, daily volume has dropped substantially to $80 billion or less per day, with the bulk of the trading done by GSEs who hold reserves but are ineligible to earn IOER.
If the balance sheet were to remain much larger than policymakers had originally anticipated, the fed funds market may never return to its former role as a deep, broad interbank market. This in turn means the Federal Reserve may need to undertake a broader rethink of its long-run monetary policy implementation framework, and the minutes from today suggest this process has officially begun. While a new policy rate is currently not our base case, and any hypothetical change would likely take place well into the future, it is worth mentioning as a possible outcome given how different the fed funds market and monetary policy transmission operate today compared to past cycles.
Conclusion: A Technical Issue…for Now
For now, it appears that the Federal Reserve is continuing to treat the effective fed funds rate conundrum as a technical issue. The Fed tweaked IOER at its June meeting, and the minutes from the FOMC's November meeting released today point to another technical tweak at the December meeting, if not before then. For most market participants, this will mean nothing more than an effective fed funds rate that, for now, is pushed back closer to the middle of the Fed's target range.
However, with two technical tweaks possible in the span of six months, the stars appear to be aligning for a broader and deeper look at the Fed's monetary policy tools and outlook. Our baseline scenario remains that the Fed will end its balance sheet unwind by late 2019/early 2020, but there is a risk that continued challenges in the fed funds market could precipitate an even earlier end.
1 https://www.federalreserve.gov/monetarypolicy/files/fomcminutes20181108.pdf
2 For a deeper dive into the nuanced way these rates operate in practice, see: Williamson, Stephen D. (2015). "Monetary Policy Normalization in the United States." Federal Reserve Bank of St. Louis Review.
3 Potter, Simon. "U.S. Monetary Policy Normalization is Proceeding Smoothly." Remarks at the China Finance 40 Forum - Euro 50 Group - CIGI Roundtable, Banque de France, Paris, France.
4 Bryson, Jay H., Pugliese, M. and Vaisey, A., "Will the Fed's Balance Sheet Ever Return to 'Normal'? Part I." (August 29, 2018), and Bryson, Jay H., Pugliese, M. and Vaisey, A., "Will the Fed's Balance Sheet Ever Return to 'Normal'? Part II." (September 5, 2018).
5 Ibid
6 Afonso, Gara, Armenter, R., and Lester, B. "A Model of the Federal Funds Market: Yesterday, Today, and Tomorrow." (February 2018).
Optimism In Markets As China And US Eye Trade Truce In Agrentina
The price of crude oil rose slightly in the Asian session after a report yesterday said that Russia was willing to join Saudi Arabia in cuts. During an interview in Argentina, Deputy Foreign Minister of the Russian Federation, Sergei Ryabkov said that the country wanted predictability and smooth price dynamics. He added that no one was interested in oversupply. Soon afterwards, Trump announced that he was cancelling a meeting with Russia's Putin at the G20 summit. This was pinned on Russia's refusal to release Ukraine navy ships and sailors seized in a maritime confrontation last Sunday. With the price of oil so low, it's likely that Russia and Saudi Arabia will work on how to boost its price.
The yen was little moved in overnight trading even after disappointing data. The jobs/applications ratio moved to 1.62, which was lower than September's 1.64. The consensus estimate was 1.65. Consumer prices in Tokyo rose by 0.8%, which was worse than the 1.1% that traders were expecting. The unemployment rate rose to 2.4% from September's 2.3%. On a positive note, the country's industrial production number rose by 2.9%. This was higher than the consensus estimate of 1.2%.
Asian stocks were positive after reports showed that the United States and China were eying a trade deal. Officials of both countries have discussed holding additional talks in December if the two leaders agree on a truce in Argentina. Officials said that China's lead trade negotiator, Liu He would lead a delegation of 30 officials to Washington to hammer a deal on December 12. However, it is important to note that similar talks have stalled in the past.
USD/CAD
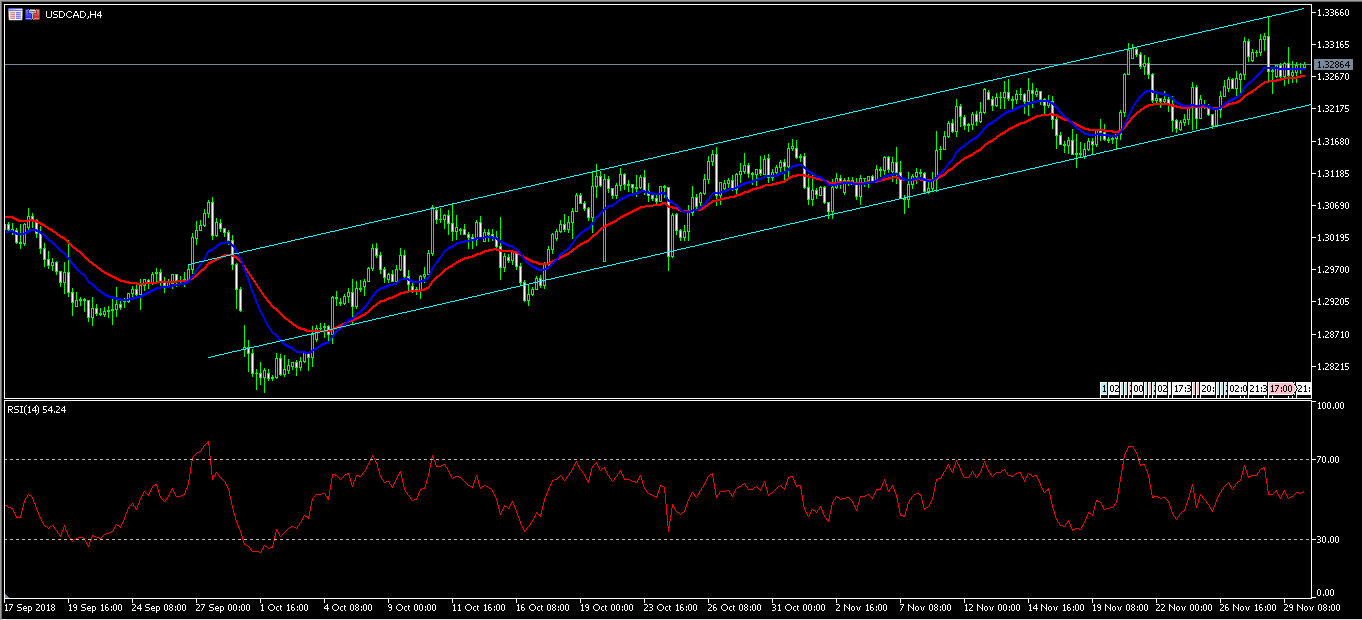
The USD/CAD pair was slightly unchanged overnight as traders wait for the GDP numbers, which will be released later today. Over the past two months, the pair has been moving in an upward channel as shown below. It is now at the middle level of the channel, with the price being along the 30 and 15-day EMA. At 54, the RSI remains supportive of this price action. This trend could change depending on today's GDP numbers.
EUR/USD
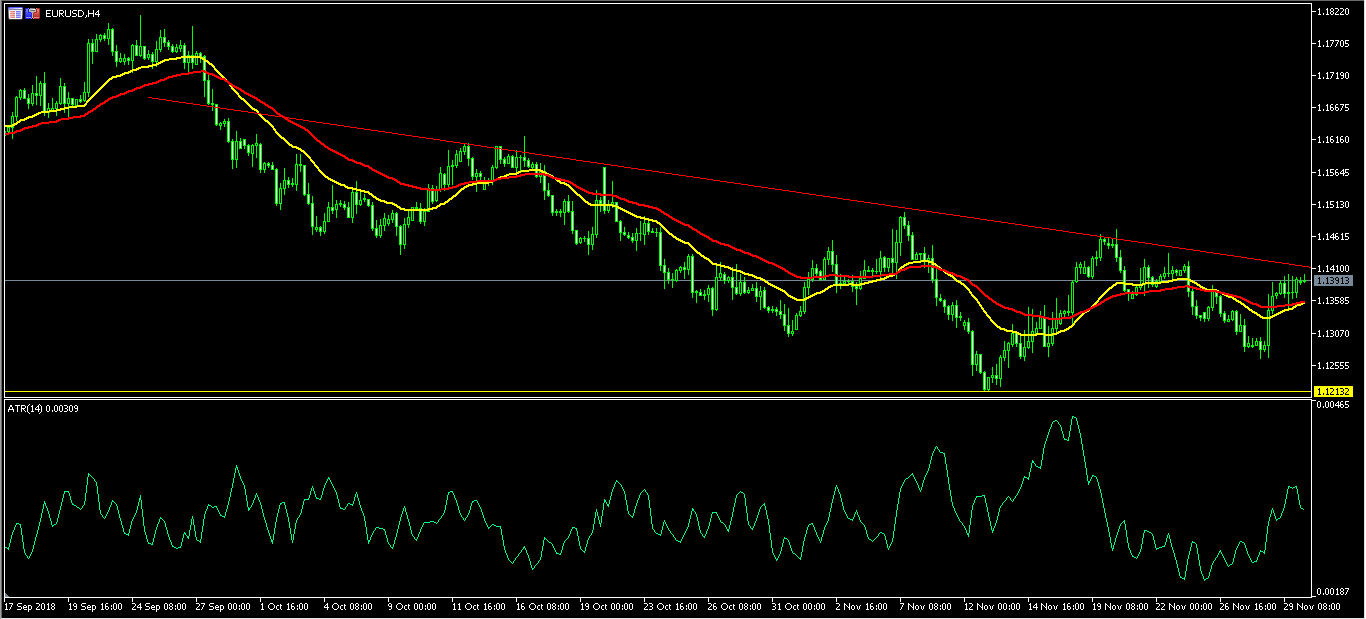
The EUR/USD pair remained near yesterday's high of 1.1395. This is after the mixed jobless claims numbers released yesterday from the United States. Over the past two months, the pair has moved lower from 1.1815 to a low of 1.1215. The past few days has seen plenty of indecision which has led to an increase in volatility. The Average True Range has been moving up, a sign of the ongoing volatility. This pattern will likely continue as traders get more information from the Fed about next year's rate hikes.
XTI/USD
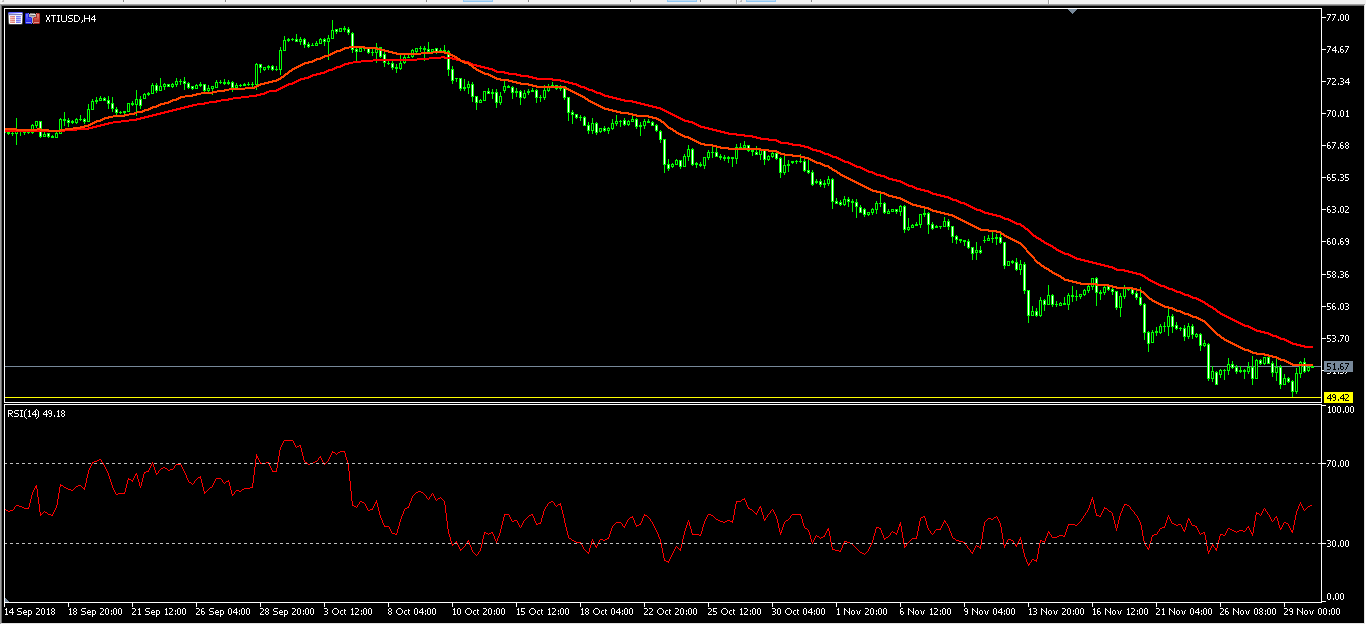
After falling below $50 yesterday, the price of crude oil jumped slightly overnight. The XTI/USD pair is now trading at 51.64. The RSI has moved from below 29 and is currently at 50. There are also signs that the short-term and long-term EMAs are crossing one another. News over the coming days could lift the prices.
Elliott Wave Analysis: Suggest Supported NZDUSD
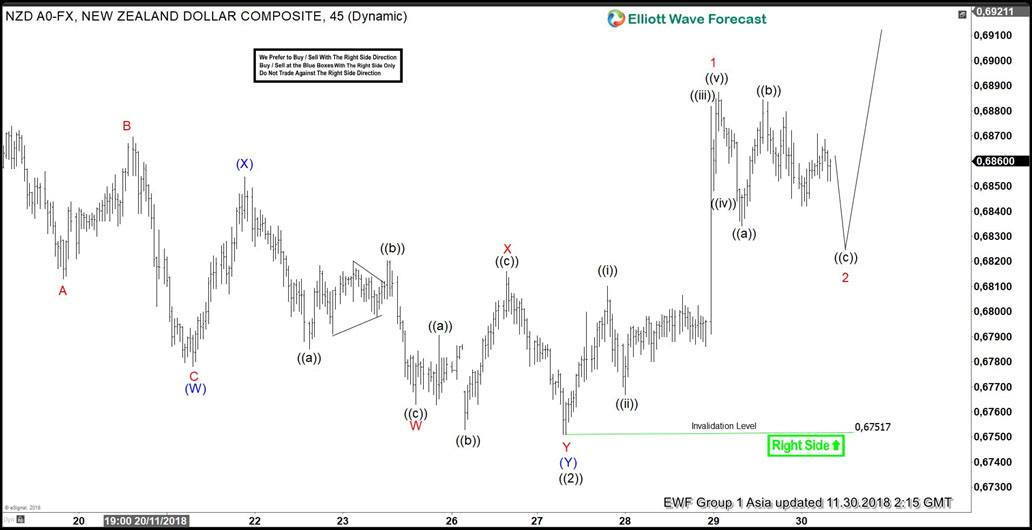
NZDUSD short-term Elliott wave analysis suggests that a decline to 0.6751 low ended primary wave ((2)) pullback. The internals of that pullback unfolded as double three structure where intermediate wave (W) ended at 0.6780 low in lesser degree zigzag structure. Up from there, a 3 wave bounce to 0.6852 high ended intermediate wave (X). Then finally a decline to 0.6751 low ended intermediate wave (Y) in lesser degree double three structure & finally completed primary wave ((2)).
Up from 0.6751 low, the pair has made a new high above 11/16/2018 peak favoring a next leg higher within primary wave ((3)). Thus suggests supported to higher NZDUSD looking for more upside. Above from 0.6751 low, the initial rally to 0.6809 high ended Minute wave ((i)). Minute wave ((ii)) ended at 0.6770 low, Minute wave ((iii)) ended at 0.6879 & Minute wave ((iv)) ended at 0.6851 low. Minute wave ((v)) ended at 0.6885 high which also completed Minor wave 1.
Down from there, Minor wave 2 pullback remain in progress to correct the rally from 0.6751 low in 3, 7 or 11 swings before further upside renew. Short-term focus remains towards 0.6833-0.6803 100%-161.8% Fibonacci extension area of a Minute wave ((a))-((b)) to end first 3 swings from the peak & find buyers there for 3 wave bounce at least. We don’t like selling it and expect buyers to appear in 3, 7 or 11 swings against 0.6751 low.
NZDUSD 1 Hour Elliott Wave Chart
Multiple Catalysts On The Agenda In Last Trading Session Of Nov, G20 Summit Eyed, China PMIs Miss Ests
General Trend:
- Asian equity markets trade generally lower, track Thursday’s US session
- Financials and tech names decline in Japan
- South Korean chip makers decline, Bank of Korea Gov makes cautious comments on chip industry
- Australian equities lag, financials decline
- Hyundai Motor rises over 4%, to repurchase shares
- Australia’s Coca-Cola Amatil declines over 13%, issued outlook
- Bank of Korea raised rates (as expected), Korean Won (KRW) weakened
- Aussie pared gain after weaker Chinese PMIs
- Japan Industrial Production rebounds in Oct
- G20 due to be held from Nov 30 to Dec 1st
- China President Xi and US President Trump are expected to meet on the sidelines of the G20 meeting
- China confirmed adjustment to cross-border e-commerce import tax from 2019
- China PBoC skips daily OMOs for entire month of Nov
- Bank of Japan (BoJ) may disclose Dec bond buying schedule later today
- Aussie Q3 GDP data due next week (Dec 5th)
Headlines/Economic Data
Australia/New Zealand
- ASX 200 opened -0.5%
- (AU) AUSTRALIA OCT PRIVATE SECTOR M/M: 0.4% V 0.4%E; Y/Y: 4.6% V 4.6%E
- (NZ) Reserve Bank of New Zealand (RBNZ) Gov Orr: Needs to ensure there is sufficient capital in the banking system to match the public's 'risk tolerance'
- (NZ) New Zealand Oct ANZ Consumer Confidence: 118.6 v 115.4 prior
- (NZ) New Zealand Oct Building Permits M/M: +1.5% v -1.3% prior
China/Hong Kong
- Shanghai Composite opened -0.1%, Hang Seng +0.2%
- (CN) CHINA NOV MANUFACTURING PMI: 50.0 V 50.2E (lowest since July 2016); NON-MANUFACTURING: 53.4 V 53.8E
- (CN) US and China reportedly considering deal to de-escalate trade disputes; likely would focus on delaying US tariffs in return for China policy modifications on farm and energy product restrictions – press
- (CN) White House Adviser Navarro reportedly back on guest list for Trump-Xi dinner meeting - Chinese press
- (CN) China Finance Ministry (MOF): Confirms to adjust cross-border e-commerce import tax from 2019; to raise the annual cross border quota for individuals to CNY26K from CNY20K, effective Jan 1st 2019
- (CN) China State Planner: Coal producers and utility firms need to sign medium to long term contracts for 75% of coal supplies
- (CN) CHINA PBOC OPEN MARKET OPERATION (OMO): SKIPS V SKIPPED PRIOR (SKIPS DAILY OMOS FOR THE 26TH STRAIGHT SESSION AND ENTIRE MONTH OF NOV AS SPECULATED IN THE PRESS)
- (CN) China PBoC sets yuan reference rate: 6.9357 v 6.9353 prior
Japan
- Nikkei 225 +0.1%
- (JP) JAPAN OCT PRELIM INDUSTRIAL PRODUCTION M/M: 2.9% V 1.2%E (fastest growth since Jan 2015); Y/Y: 4.2% V 2.5%E
- (JP) JAPAN OCT JOBLESS RATE: 2.4% V 2.3%E
- (JP) Japan Nov Tokyo CPI Y/Y: 0.8% v 1.1%e; CPI Ex-Fresh Food (Core) Y/Y: 1.0% v 1.0%e
- (JP) Japan Government Spokesman Nishimura: No meeting decided between PM Abe and France President Macron at this stage; important for Nissan and Renault to keep stable alliance
South Korea
- Kospi opened +0.1%
- (KR) BANK OF KOREA (BOK) RAISES RATES BY 25BPS TO 1.75% (AS EXPECTED), first rate hike since Nov 2017; rate decision was not unanimous, two board members voted to keep rates unchanged
- Bank of Korea Gov Lee: Today's rate hike, along with government measures, to help ease financial imbalances.
- (KR) SOUTH KOREA OCT INDUSTRIAL PRODUCTION M/M: 1.0% V 1.1%E; Y/Y: 10.7% V 6.9%E
North America
- (US) FOMC MINUTES FROM NOV 8TH MEETING: ALMOST ALL SEE ANOTHER RATE INCREASE WARRANTED 'FAIRLY SOON'; FUTURE POLICY STATEMENTS TO EMPHASIZE IMPORTANCE OF INCOMING DATA
- (CN) Pres Trump: I'm close to 'doing something' with China'
Europe
- (UK) UK PM May: Focused on Dec 11 Vote [asked if she has a plan B if UK Parliament rejects Brexit deal]; If lawmakers reject Brexit deal, will prepare for no deal
Levels as of 01:30ET
- Nikkei 225, -0.1%, ASX 200 -1.6%, Hang Seng +0.4%; Shanghai Composite +0.2%; Kospi -0.8%
- Equity Futures: S&P500 -0.2%; Nasdaq100 -0.1%, Dax -0.1%; FTSE100 -0.4%
- EUR 1.1401-1.1383 ; JPY 113.49-113.34 ; AUD 0.7327-0.7311 ;NZD 0.6880-0.6855
- Feb Gold flat at $1,230/oz; Jan Crude Oil +0.4% at $51.66/brl; Feb Copper +0.3% at $2.798/lb
How Do Traders Manage Risk on Their Trades?
Forex risk management is an essential point on which the profitability of transactions largely depends. In fact, it can be said that any transaction in the foreign exchange market is fraught with great risks and does not guarantee a favourable outcome. But by applying risk control techniques, you can significantly increase the overall profitability of Forex transactions and minimise losses.
So how to manage risks?
We have prepared for you a few tips on how to manage your risks in order not to lose the deposit.
Analyze the market
Before opening a transaction, it is necessary to analyze the situation on the market. Analysis helps to see the full picture of the market. We advise you to carry out both fundamental and technical analysis which will give you all the necessary signals for a successful transaction.
Stick to your trading plan
Many traders, many trading plans. You can create a strategy from scratch; you can use the ready one and change it “for yourself” - the main thing is to follow the rules of this strategy. Using a specific trading algorithm and sticking to it, you can analyze your mistakes in order not to make them in the future. Your trading strategy should be profitable in the long run.
Set loss percentage
Define for yourself the percentage of losses that you can afford. For example, if during the day you have lost more than 3-5% of the deposit, stop trading and analyze what has gone wrong.
Diversify deals
That is, open several different deals. To effectively manage your capital, we do not recommend using more than 1-5% of your deposit in one transaction. Do not forget that many pairs correlate with each other. Therefore it is necessary to open deals with currency pairs that are not related to each other.
Do not invest in trading all the money
Trading on the exchange is always a risk. Use for trading 7-10% of your capital. You will suffer such a loss almost painlessly. But if you trade on your las money or take it on credit, the consequences will be more tangible and unpleasant.
Use stop orders
The use of stop loss and take profit is the main way to minimise risks. If the levels are set correctly, you can achieve the fastest possible closing of the transaction at the initial stage of negative market movement.
Use leverage wisely
The size of the leverage affects the level of risk through the margin value, i.e. through the amount that will remain on your deposit after the Margin call and the forced Stop out. The more leverage, the lower the margin level and the more you can lose in case of an unfavourable outcome of the transaction. Besides, there is a psychological risk of overtrading with maximum volumes.
Admit a mistake
Everyone makes mistakes. If you make a mistake, admit it and fix the loss. Draw conclusions. Do not try to play over the market. If your loss grows and the price goes against you, close the deal.
Control your emotions
One of the most important risk management methods is to control your emotions. Greed and excitement are unacceptable. You need a clear-eyed calculation and awareness. Only in this way can you respond properly to changes in the market situation.
Do not trade if you have doubts
If you doubt whether to open a position, stay out of the market. If you are not sure that you have understood the signal correctly, do not trade. In trading, clarity and specifics are important. Then there will be a profit.
Conclusion
These simple but effective methods of risk management are relevant for Forex traders with different trading experience. Understanding risks, limiting them or reducing them in time, and quickly reacting to price changes are all that is needed for profitable trading. Also, apply this knowledge into practice on JustForex.com.
Will It Be Deal Or No Deal In Buenos Aires?
Market movers today
The G20 meeting kicks off in Buenos Aires today. Focus will be on signals from the US and Chinese officials ahead of the ever important Trump-Jinping meeting tomorrow, which will aim at resolving the trade dispute between the two countries. We look for a ceasefire - see US-China trade - Five reasons why we still see a 60% chance of ceasefire , 29 November. Also in focus are statements by world leaders on the role of Saudi Arabia's crown prince in the killing of journalist Jamal Khashoggi and renewed tensions between Russia and Ukraine.
In relation to economic releases, the November flash inflation numbers are due today in the euro area. In October, core inflation finally took off and rose to 1.1% y/y and headline inflation remained above the ECB's target, coming in at 2.2 % y/y in October - the highest rate since 2013. However, headline inflation was driven mainly by rising energy prices and as oil prices in EUR terms have fallen from EUR63 to EUR55 per barrel since the beginning of November, we expect this print to come in at 2.0% y/y and for the core to remain at the current level.
Selected market news
After the apparent new rhetoric from Fed Chair Jerome Powell on Wednesday night (see Danske Daily , 28 November), the market was eager to scrutinise the FOMC minutes . The minutes left little doubt that we should expect a December rate hike, indicating that another interest rate hike would be warranted fairly soon. This was hardly a surprise for the market as a December hike is almost fully priced in. More importantly, the FOMC minutes also said that meeting participants emphasised 'that the stance of policy should be importantly guided by incoming data and their implications for the economic outlook [and that] monetary policy was not on a pre-set course'. The overall impression is similar to that after Powell yesterday, i.e. that the FOMC has become slightly more data dependent and that a change in language is the next step. However, given our view on the US economy, we see no reason to change our call for two more rates hikes in H1 and possibly a third hike in H2 on top of the widely expected hike this December.
Finally, Powell noted the upward trend in the effective Fed funds rate relative to the IOER rate and suggested that 'fairly soon' might be appropriate to implement another technical adjustment in the rate relative to the top of the target range for the federal funds rate. The FOMC also discussed a more fundamental change of the policy framework including moving away from targeting the federal funds rate to, e.g. the OBFR (Overnight Bank Funding Rate), which would be more appropriate in a situation with abundant excess reserves. For more, see this (subscription only) FT article . After the steepening of the yield curve for 2s10s yesterday, we saw a flattening tendency last night as 10Y US treasury yields briefly touched 3%, whereas the 2Y point barely moved. Just as it was difficult to break above 3% in October, it also seems difficult to break below 3% in the 10Y Treasury yield.
FOMC minutes initially lifted risk appetite, but as trade concerns ahead of the G20 meeting took over before close, the major US indices all ended the day marginally lower. Note that Asian markets are in the green this morning.
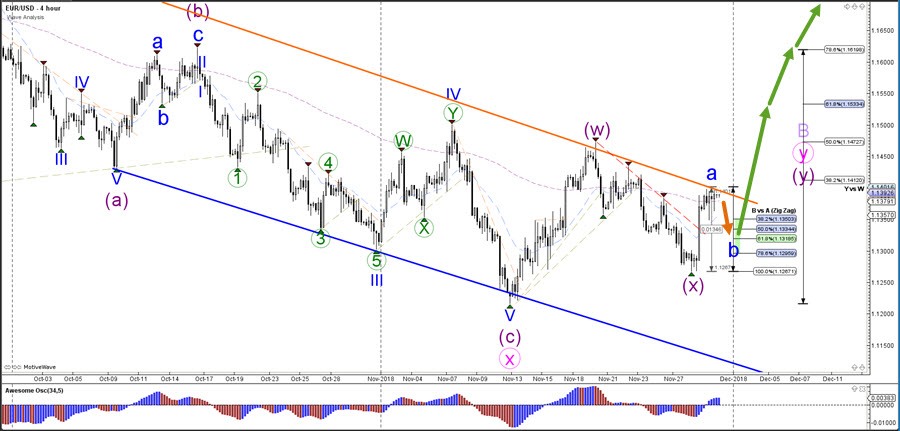
EUR/USD Rising Wedge Pattern In ABC Zigzag Pattern
The EUR/USD could bounce at the channel resistance and make a pullback within a wave B (blue). Price would then test the Fibonacciretracement levels of wave B vs A, which in turn could as potential support levels if indeed the bullish ABC zigzag wave pattern takes place.
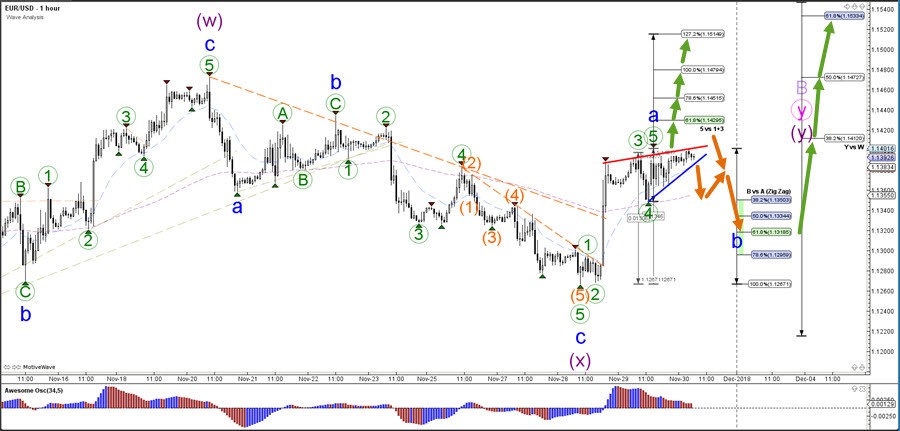
The EUR/USD is building a rising wedge reversal chart pattern within waveA (blue). A bullish break above the resistance trend line (red) could indicate a continuation of the wave A towards the Fib targets of wave 5. A bearish break below the wedge could see price move lower towards the Fib retracement levels of wave B (blue).
Xi/Trump Meeting Eyed As Trade War Heats Up
Xi/Trump meeting eyed as trade war heats up
There have been a number of underlying risks that have contributed to the recent wobbles in financial markets and this weekend, we could see some real progress in one key area.
Jerome Powell's comments a couple of months ago may have been the catalyst for the sell-off in stock markets – not to mention the rebound on Wednesday when he sought to clarify them – but it's quite clear that Trump's trade policies, particularly towards China, had already left markets on a rocky foundation.
Investors will be hoping that the two President's, Trump and Xi, will be able and willing to make real progress in their trade dispute at the G20 meeting in Buenos Aires and avoid the need for further tariffs. Trump didn't give us much cause for optimism on Thursday, claiming he wasn't sure if he wanted one, although I think it's safe to say this is likely nothing more than posturing ahead of their dinner on Saturday.
Survey weaknesses highlight need for a deal
The Chinese PMIs figures on Friday morning further highlighted the need for agreement between the two, with the manufacturing survey falling to 50, the level that separates growth and contraction, the lowest reading in more than two years.
The new orders component was of particular interest, weakening both domestically and externally, a reflection of the slowing economy and the impact of tariffs. At this stage, it's a question of how much pain the Chinese administration is willing to accept, having so far been sheltered by the weaker currency and front running of orders ahead of tariffs being implemented. I feel this has some time to run yet, regardless of how positive the statements we get from the meeting on Saturday sound. The key giveaway will be whether the US follows through on hiking the tariff on the $200 billion of goods at the turn of the year.
Italy heading for EDP unless compromises found
In Europe, we continue to focus on the two big political issues that Brussels finds itself at the centre of. The battle between Rome and Brussels over the Italian budget for next year is progressing as expected, although reports of potential compromise from the former have encouraged investors in recent days as the country continues down the path towards an excessive deficit procedure.
May's Brexit deal unlikely to get through parliament on 11 December
Brexit will dominate the headlines over the coming weeks though as Theresa May attempts to sell her deal to a government that appears united against it, for various reasons. The backstop is the most contentious issue of these which may stop her getting the necessary support on 11th December, opening the door to a variety of scenarios including heading to Brussels to have one last shot at getting the necessary concessions to get it over the line. The pound meanwhile continues to look weak and vulnerable and the prospect of a no deal Brexit becomes ever more real.