Sample Category Title
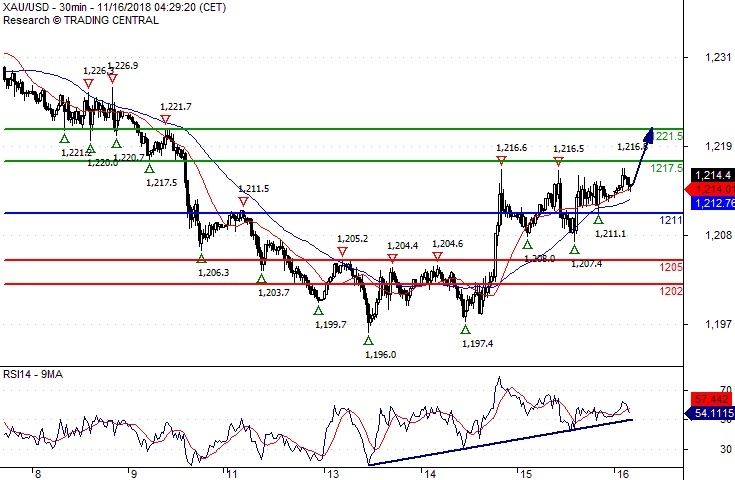
Gold Spot Further Upside
Pivot (invalidation): 1211.00
Our preference Long positions above 1211.00 with targets at 1217.50 & 1221.50 in extension.
Alternative scenario Below 1211.00 look for further downside with 1205.00 & 1202.00 as targets.
Comment The RSI is supported by a bullish trend line.
EUR/USD Trades At 1.1340 14
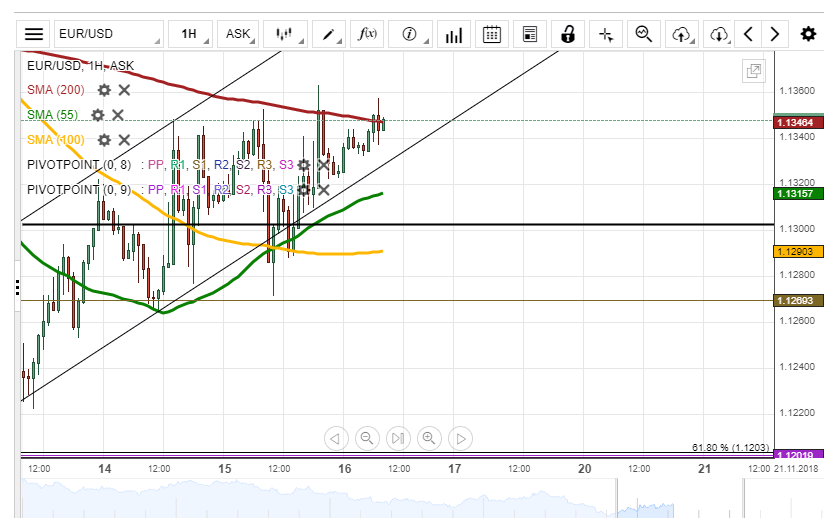
During Thursday's trading session, the European Single Currency surged to the 1.1340 level piercing the resistance of the 200-hour simple moving average. During Friday morning hours, the currency exchange rate was resisted by the 200-hour simple moving average to trade at the 1.1347 mark.
In regards to the near-term future, most likely, the currency exchange rate will move upwards to break the resistance of the 200-hour simple moving average to trade near the weekly pivot point at the 1.1384 mark.
On the other side, the 200-hour simple moving average could resist the currency exchange pair to push the rate to trade at the 1.1320 level during the day.
GBP/USD Is Near Weekly S2
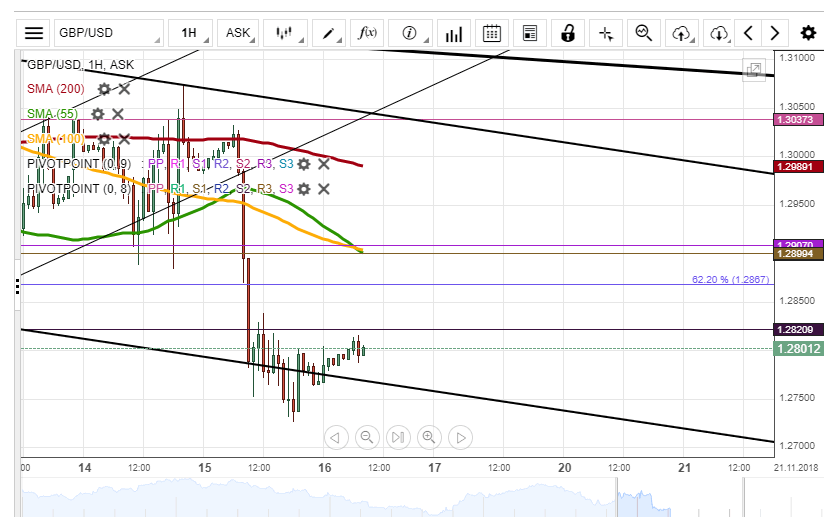
During Thursday's trading session, the currency exchange rate passed through most of the technical indicators to end the trading session at the 1.2765 mark. On Friday morning, the British pound was trading sideways at the 1.2800 level.
In regards to the near-term future, most likely, the British Pound might get resisted by the weekly S2 at 1.2820 mark to trade downwards near the bottom boundary of the medium descending pattern line at the 1.2700 level. Besides, the 55-hour and the 100-hour simple moving averages will try to catch up the rate during the day.
On the other side, the British Pound could break the resistance of the weekly S2 at 1.2820 mark to trade near the 62.20% Fibonacci retracement level at the 1.2864 mark.
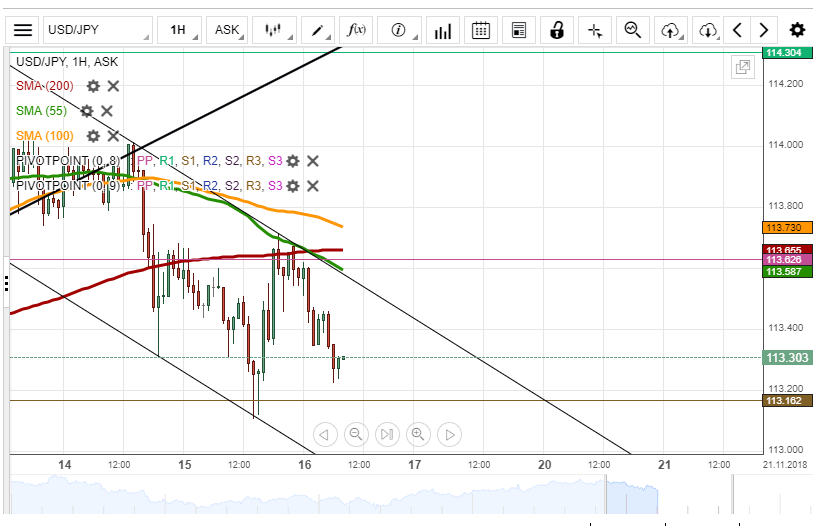
USD/JPY Pierced Weekly S1 At 113.16
During Thursday's trading session, the currency exchange rate pierced the weekly S1 at the 113.16 mark to end the trading session at the 113.50 mark. On Friday morning, the US Dollar was depreciating to trade at the 113.26 mark.
In regards to the near-term future, most likely, the US Dollar will keep depreciating towards the weekly S1 at 113.16 to pass through its support to trade at the 113.00 level during the trading session on Friday.
On the other side, the US Dollar could be supported by the weekly S1 at 113.16 to push the currency exchange rate to recover itself at the 113.20 level
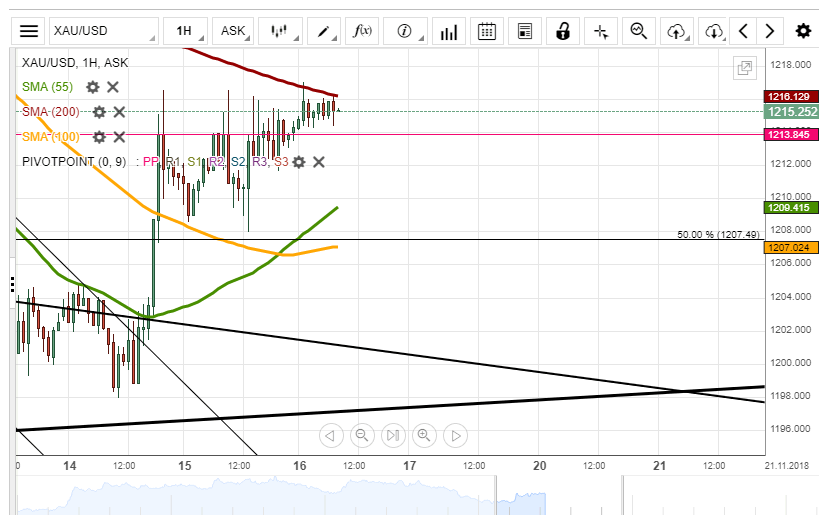
XAU/USD Breaks Monthly PP At 1,213.84
During Thursday's trading session, the yellow metal broke the resistance of the monthly pivot point at the 1,213.84 to end the trading session at the 1,214.07 mark. On Friday morning, the gold was resisted by the 200-hour simple moving average to trade at the 1,215.63 mark.
In regards to the near-term future, most likely, the gold will break the resistance of the 200-hour simple moving average at the 1,213.29 mark to trade at the 1,220.00 level.
Besides, the 55-hour simple moving average will try to catch up the yellow metal to give additional support for the gold during the trading session on Friday.
Wall Street Ends Five-Day Losing Streak, Sterling Plummets
U.S. stocks finally managed to end a five-day losing streak yesterday supported by the Tech, Financial and Energy sectors, thanks to unofficial reports stating that further U.S. tariffs on Chinese imports would be put on hold. Although U.S. Trade Representative Robert Lighthizer denied the report shortly before the U.S. closing bell, the S&P 500 still ended 1.06% higher. Investors appear to be in need ofany sort of positive news to buy the dips, and this kind of news seemsto be doing the trick.
When stock markets rallied strongly on positive news that China and U.S. might be closer to a deal, itshows how much damage the trade dispute between the world’s two largest economies have done to equities recently. Movingforward, tax cuts will no longer have a positive impact on earnings and the Federal Reserve doesn’t seem moved by market volatility. For many investors, it’s becoming all about trade policies on whether they take risk or stay away.
On the other side of the Atlantic, the FTSE 100 ended the day with 0.06% gains. However, do not beimpressed by the green color. The Basic Materials and Energy sectors lifted the index, but when looking at stocks with domestic exposure, they were severely hit. Royal Bank of Scotland fell 9.6% while house builders Persimmon, Taylor Wimpey, and Barratt Developments all fell more than 7% on Thursday.
The reaction yesterday to a series of ministerial resignations led by Brexit Secretary Dominic Raab indicates that markets have not priced in enough risk to a no-deal Brexit. Things could even get messier in the days ahead. A leadership challenge to Prime Minister Theresa May will send us back to square one, and thus markets will begin pricing the worst outcome.
Sterling plunged nearly 2% to fall below 1.28. If the political drama was not enough, retail sales came in much worse than expected, falling 0.5% in October.
Market participants seem to believe that the draft Brexit agreement in its current formis not likely to be approved by Parliament. However, expect Theresa May to fight until her last breath. Options now are open for ano-confidence vote, a new election, new referendum, and hard Brexit deal.But when the critical moment comes no one knows what could happen. All what we know is volatility in U.K. assets will hit the roof in the days and weeks to come.
USDCAD Loses Some Ground In Very Short-Term, Upside Structure Holds In Long-Term
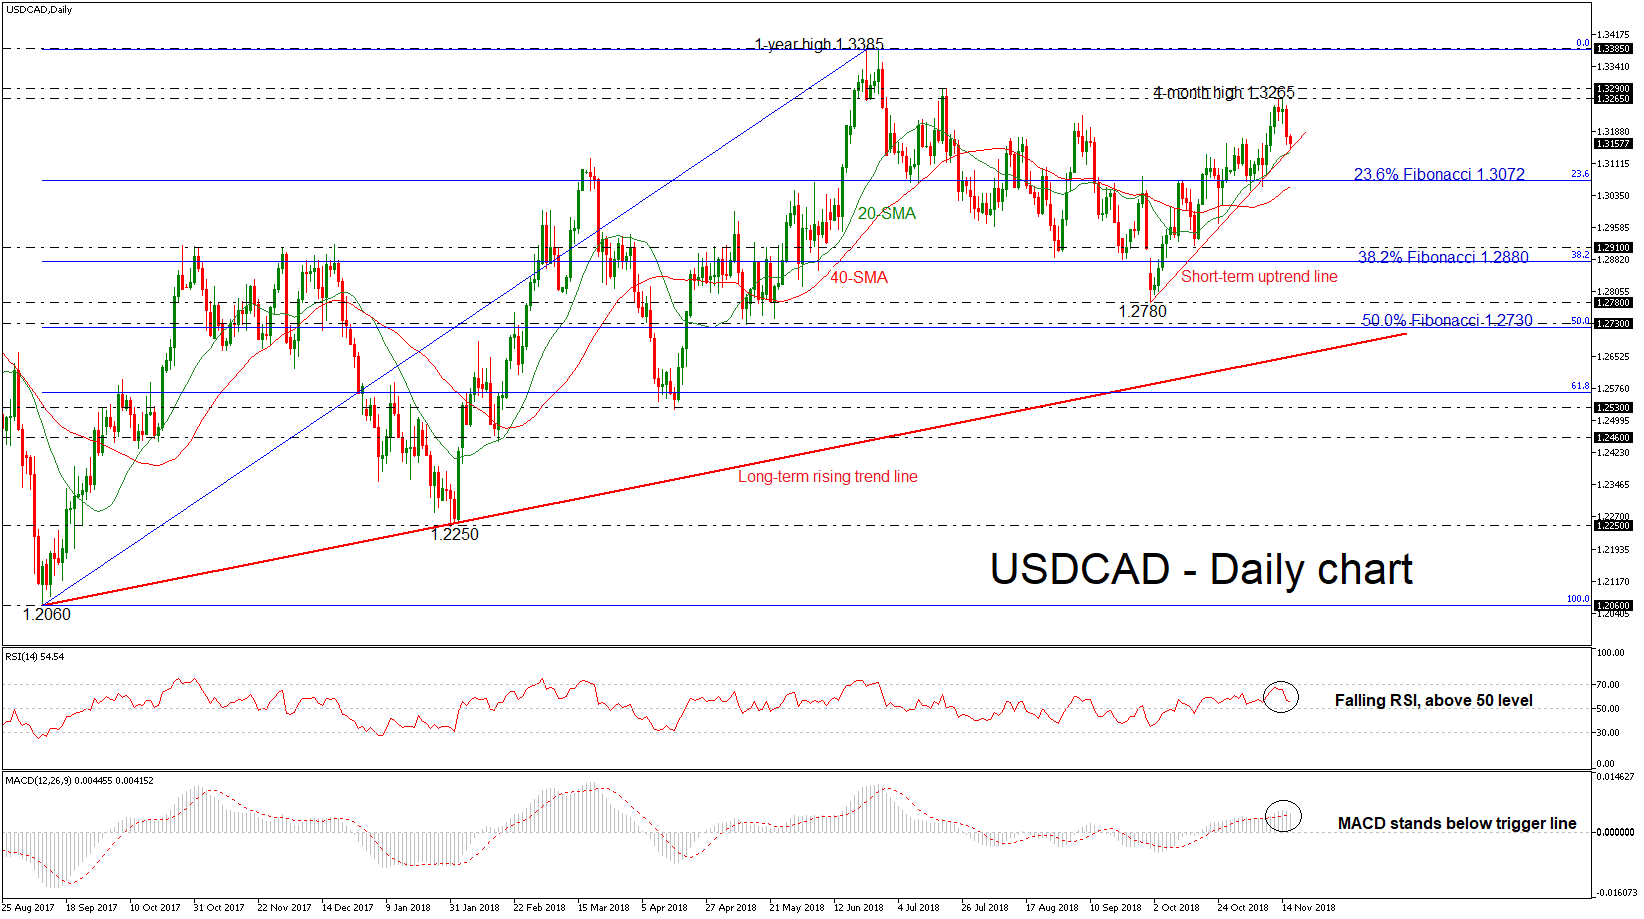
USDCAD has been underperforming since yesterday, remaining below the four-month high of 1.3265. Currently, the price holds above the very short-term rising trend line, but in case of a penetration it would move even lower in the near term. Also, when looking at the bigger picture the pair has a clear upside trend after its rebound on the 1.2060 support level.
Momentum indicators in the daily timeframe, are too weak to provide a sustained move higher as the RSI is sloping to the downside and MACD dropped below the trigger line.
In the event of more negative pressures and a slip below the 20-day simple moving average (SMA) the pair could re-challenge the 23.6% Fibonacci retracement level of the upleg from 1.2060 to 1.3385, around 1.3072. A significant leg below this region and the 40-day SMA could see a test of the 1.2910 support, before being able to hit the 38.2% Fibonacci mark of 1.2880.
However, a jump above the 1.3265 – 1.3290 resistance area, the market could meet the one-year high level of 1.3385. Further increases could move the price towards the 1.3550 barrier, identified by the peak on May 2017, creating a new higher high in the long-term ascending movement.
Turning to the long-term view, the market seems to be in a bullish mode given that USDCAD still trades above the 20- and 40-day SMAs and well above the ascending trend line, which has been holding since September 2014.
GBPUSD 1.2835 Level Now Key Resistance
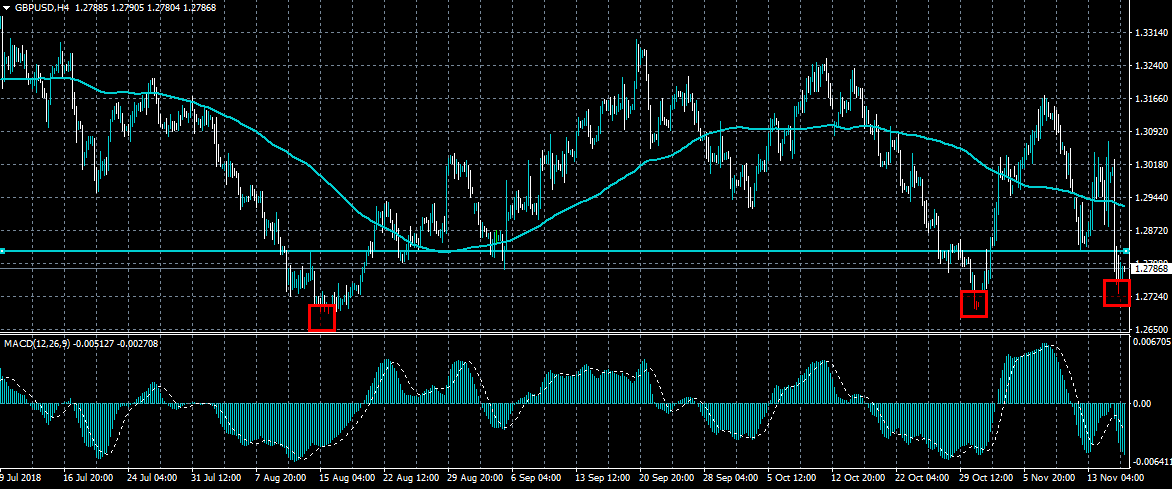
The British pound is testing towards the 1.2800 resistance level against the US dollar after finding strong technical support from the 1.2722 level. The intraday sentiment surrounding the GBPUSD pair remains strongly bearish while price trades below the former weekly low, at 1.2835. It is also worth noting that the recent failed attempt at the 1.2694 support level has created a bullish triple-bottom pattern.
The GBPUSD pair is strongly bearish while trading below the 1.2835 level, key technical support is now found at the 1.2835 and 1.2694 levels.
If the GBPUSD pair trades above the 1.2835 level, key resistance is found at the 1.2900 and 1.2940 levels.
EURUSD Bulls Now Have The Upper Hand
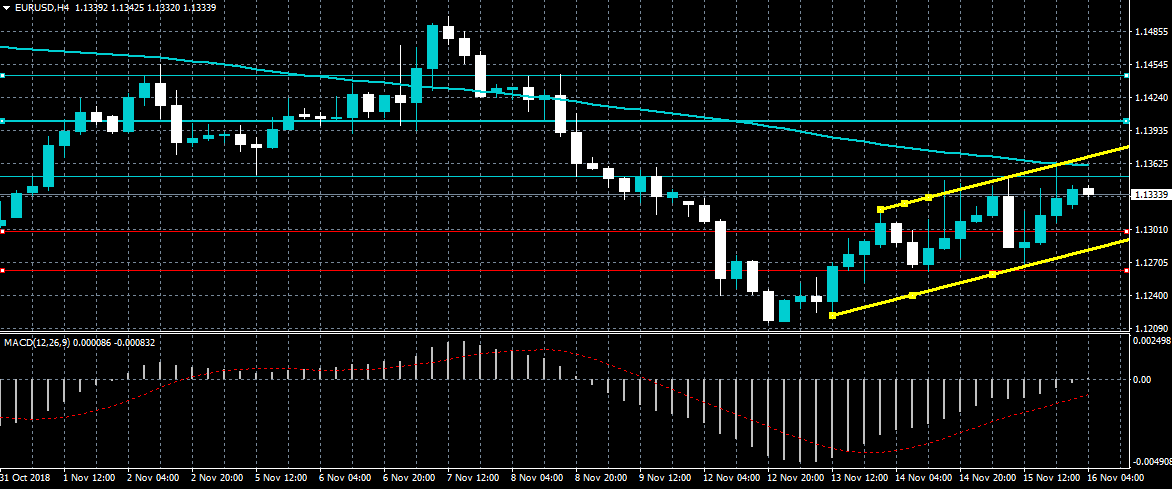
The euro is starting to probe the 1.1351 resistance level against the US dollar, after a failed attempt to contain price below the 1.1300 level. A sustained move above the 1.1351 level supports further bullish advancement for the EURUSD pair towards the 1.1400 resistance level. It is also worth noting that price is trading within a bear flag pattern across the four-hour time frame.
The EURUSD pair is only bullish while trading above the 1.1300 level, key resistance is now found at the 1.1380 and 1.1400 levels.
If the EURUSD pair trades below the 1.1300 level, key intraday support is now found at the 1.1265 and 1.1216 levels.
Calm Before The Storm As Sterling Halfs Decline
Yesterday, sterling dropped sharply after Brexit Minister Dominic Raab resigned. This was the biggest drop since the day the UK voted to leave the EU. In the Asian session, sterling was little moved as traders waited for an indication of what will happen today. The chance of a no-Brexit deal is still a possibility as traders expect parliament to vote down the proposal by Theresa May’s government.
The euro was little moved in the Asian session ahead of important data from the EU. The region will release its consumer prices data. This data is expected to show that consumer prices remained unchanged in October. The CPI is expected to remain at 2.2% while the core CPI is expected to remain at 1.1%. This data will likely not change the guidance of the ECB. In the last meeting, the bank reiterated its intention of ending quantitative easing in December. The bank also said that a change of interest rates will likely happen through the summer of 2019.
The price of crude oil remained at extremely low levels after the EIA released the crude inventories. The numbers showed that inventories for the week rose by 10.27 million barrels. This was much larger than the 3.18 million barrels that traders were expecting and came a day after the API number showed inventories at 5.7 million barrels. The increased supply has triggered Saudi Arabia to consider supply cuts starting from December.
EUR/USD
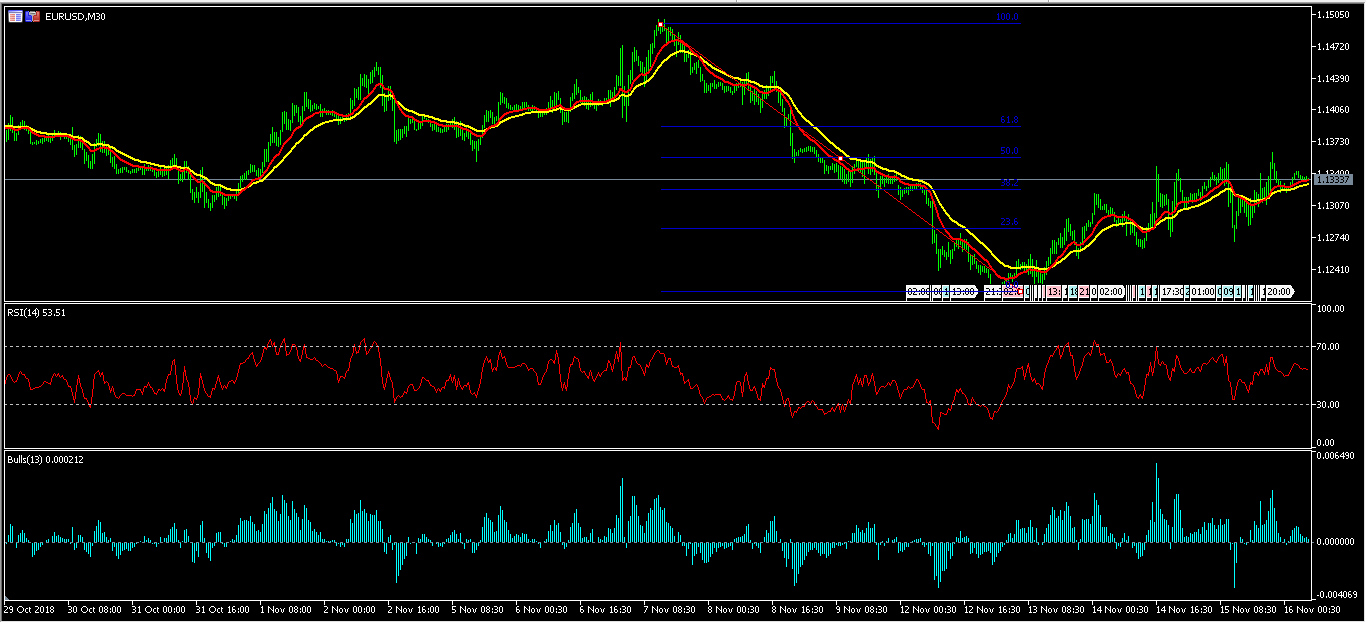
The EUR/USD pair was relatively unchanged in the Asian session today. It is trading at 1.1335, which is along the 38.2% Fibonacci Retracement level. This week, the pair has seen some relative gains of 1.3%. The RSI is at 53.6 while the Bulls Power indicator has lost momentum. This consolidation could lead to more volatility today or in the days ahead. If the pair continues moving up, it will likely test the 1.1350 resistance level and if it moves down, it will test the 1.1320 level.
GBP/USD
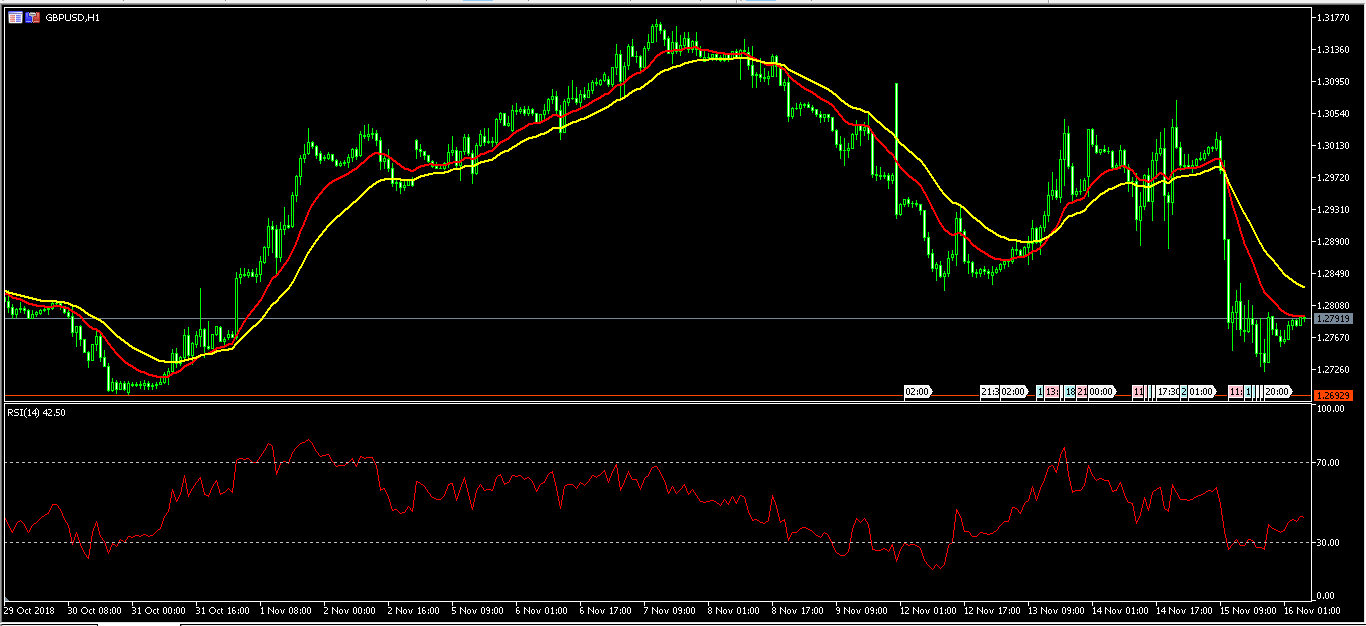
After yesterday’s plunge, the GBP/USD took a break in the Asian session as traders waited for more news on Brexit. The pair is trading at 1.2790, which is slightly above yesterday’s low of 1.2722. It is also above the low of 1.2630, which is an important support level. The RSI has moved from yesterday’s low of 28 to the current 42. If the pair resumes the decline, traders should watch out for this support. This is because further declines will likely take the pair to 1.2500. There is also a possibility that the pair will reverse when it reaches this level.
XTI/USD
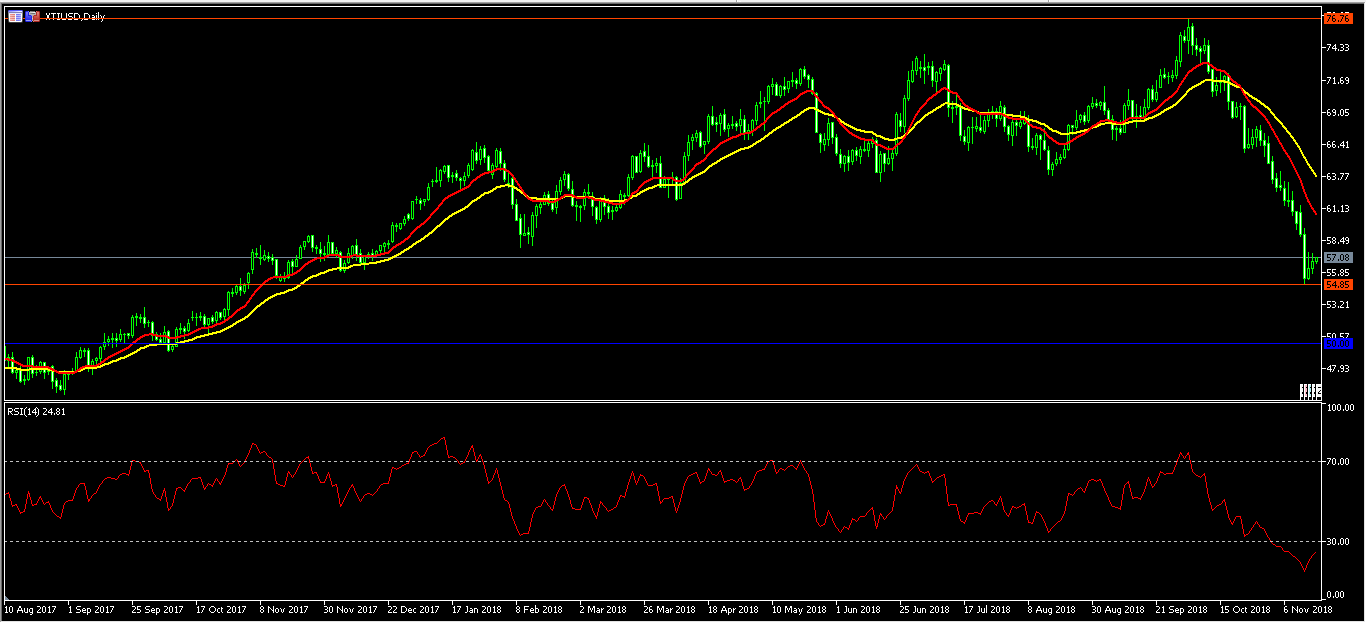
The price of WTI crude oil moved slightly higher in the Asian session but remained near the lowest low since November this year. This was a minor support level as shown on the daily chart below. The double exponential moving average indicators point to a sustained downward trend. The RSI is currently at 24, which is above yesterday’s low of 14. The XTI/USD pair is likely to continue moving lower. If it does, it will move to the 50 support level.