Sample Category Title
EUR/AUD Daily Outlook
Daily Pivots: (S1) 1.5506; (P) 1.5584; (R1) 1.5649; More....
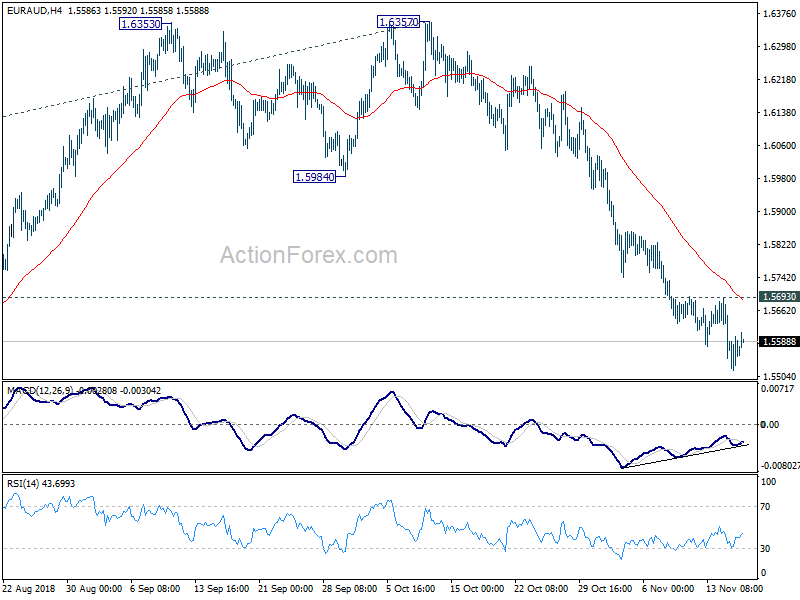
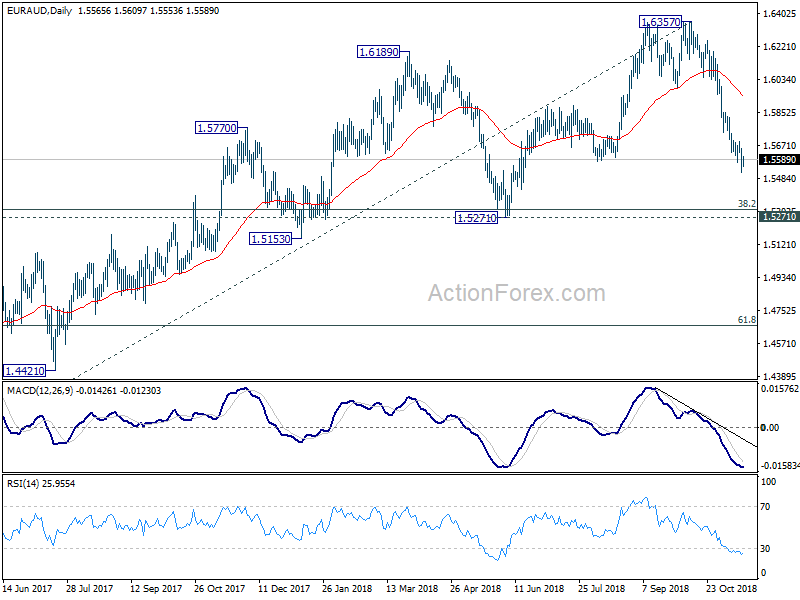
With 1.5693 minor resistance intact, further decline is expected in EUR/AUD. Current fall from 1.6357 should 1.5271/5313 cluster support zone next. On the upside, though, break of 1.5693 resistance will now indicate short term bottoming. In that case, lengthier consolidation would be seen first before staging another decline.
In the bigger picture, current development argues that up trend from 1.3624 (2017 low) is possibly completed at 1.6357, ahead of 1.6587 (2015 high). This is supported by bearish divergence condition in weekly MACD. Deeper decline is now in favor to 1.5271 cluster support (38.2% retracement of 1.3624 to 1.6357 at 1.5313). Break will target 61.8% retracement at 1.4668. On the upside, break of 1.5984 support turned resistance is now needed to revive the prior medium term up trend. Otherwise, further decline will be in favor even in case of strong interim rebound.
Gold: Yellow Metal Trading Higher In The Morning Session
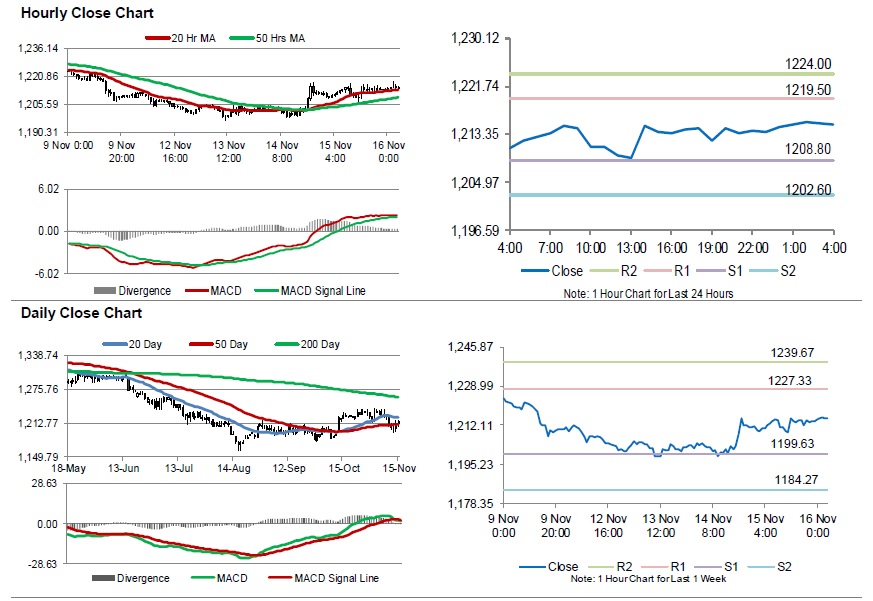
For the 24 hours to 23:00 GMT, Gold rose 0.22% against the USD and closed at USD1213.90 per ounce, amid Brexit turmoil.
In the Asian session, at GMT0400, the pair is trading at 1215.00, with gold trading 0.09% higher against the USD from yesterday’s close.
The pair is expected to find support at 1208.80, and a fall through could take it to the next support level of 1202.60. The pair is expected to find its first resistance at 1219.50, and a rise through could take it to the next resistance level of 1224.00.
The yellow metal is trading above its 20 Hr and 50 Hr moving averages.
EUR/CHF Daily Outlook
Daily Pivots: (S1) 1.1361; (P) 1.1392; (R1) 1.1438; More...
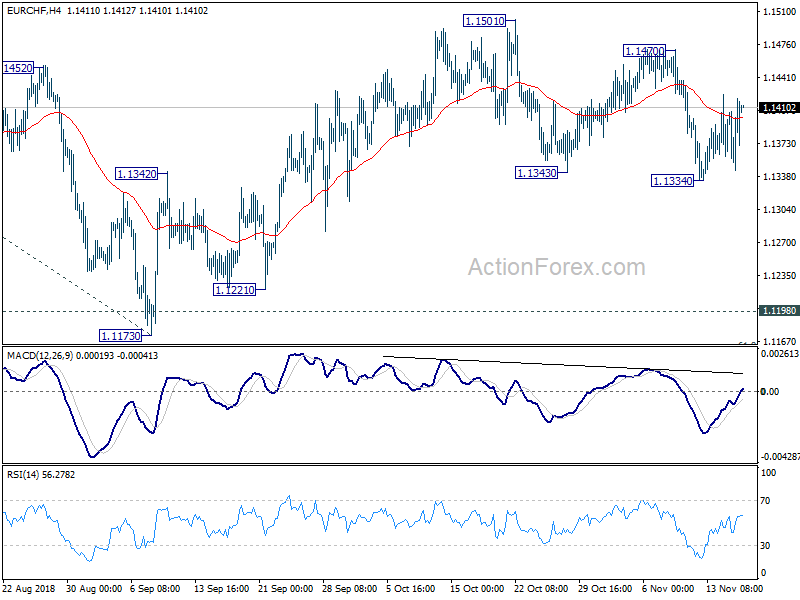
Intraday bias in EUR/CHF remains neutral for the moment. As long as 1.1470 minor resistance holds, another decline is mildly in favor. On the downside, break of 1.1334 will extend the fall from 1.1501 towards 1.1154/98 key support zone. On the upside, break of 1.1470 will turn focus back to 1.1501. Decisive break of 1.1501 will revive the case of bullish reversal.
In the bigger picture, price actions from 1.2004 medium term top is seen as a correction only. Downside should be contained by support zone of 1.1198 (2016 high) and 61.8% retracement of 1.0629 to 1.2004 at 1.1154 to complete it and bring rebound. This cluster level is in proximity to long term channel support (now at 1.1243) too. A break of 1.2 key resistance is still expected in the medium term long term. However, sustained break of the mentioned support zone will mark reversal of the long term trend. In that case, 1.0629 key support will be back into focus.
Silver: White Metal Trading On A Positive Footing This Morning
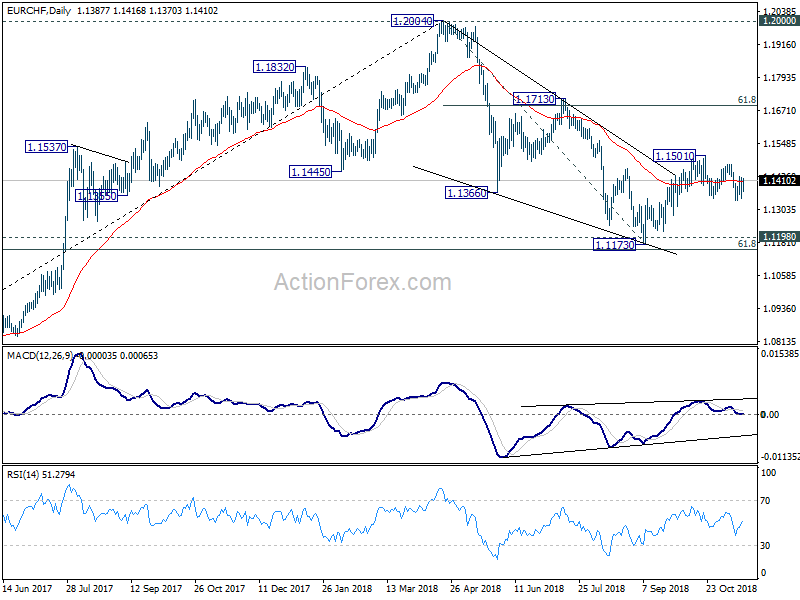
For the 24 hours to 23:00 GMT, Silver rose 1.13% against the USD and closed at USD14.26 per ounce, tracking gains in gold prices.
In the Asian session, at GMT0400, the pair is trading at 14.29, with silver trading 0.18% higher against the USD from yesterday’s close.
The pair is expected to find support at 14.14, and a fall through could take it to the next support level of 13.90. The pair is expected to find its first resistance at 14.38, and a rise through could take it to the next resistance level of 14.48.
The white metal is trading above its 20 Hr and 50 Hr moving averages.
USD/CAD Daily Outlook
Daily Pivots: (S1) 1.3137; (P) 1.3196; (R1) 1.3237; More...
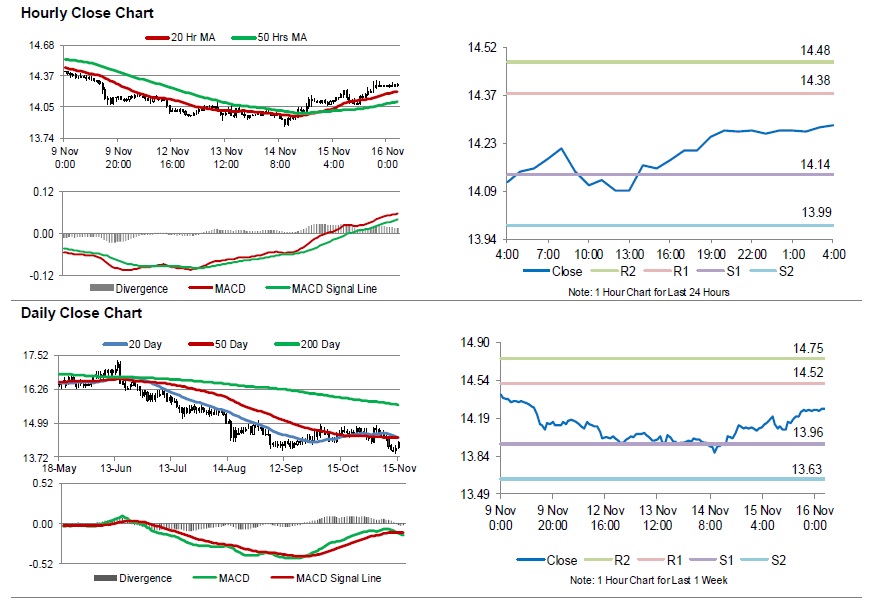
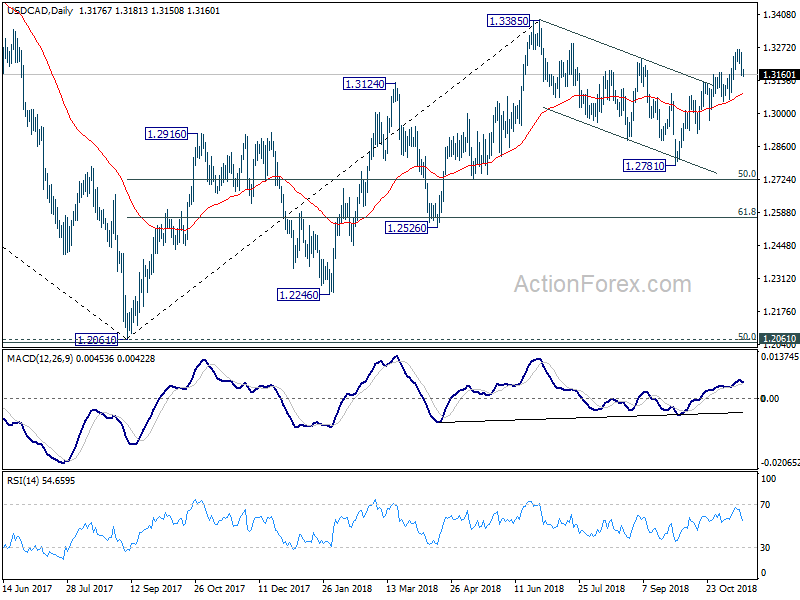
USD/CAD's pull back from 1.3264 extends lower today. But it's, after all, staying above 1.3056 support as well as inside near term channel. Intraday bias remains neutral and another rise remains in favor. On the upside, above 1.3264 will extend the rally from 1.2781 to retest 1.3385 high. However, break of 1.3056 will indicate near term reversal and turn outlook bearish.
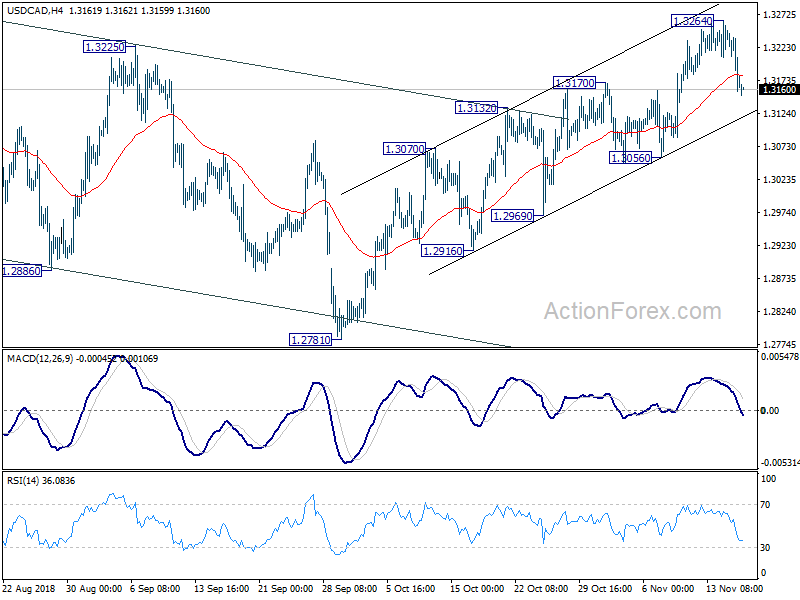
In the bigger picture, current development revives the case that corrective fall from 1.3385 has completed at 1.2781 already. And whole up trend from 1.2061 (2016 low) is ready to resume. Break of 1.3385 will target 61.8% retracement of 1.4689 (2016 high) to 1.2061 at 1.3685. This will now be the favored case as long as 1.2781 support holds.
AUD/USD Daily Outlook
Daily Pivots: (S1) 0.7236; (P) 0.7268; (R1) 0.7307; More...
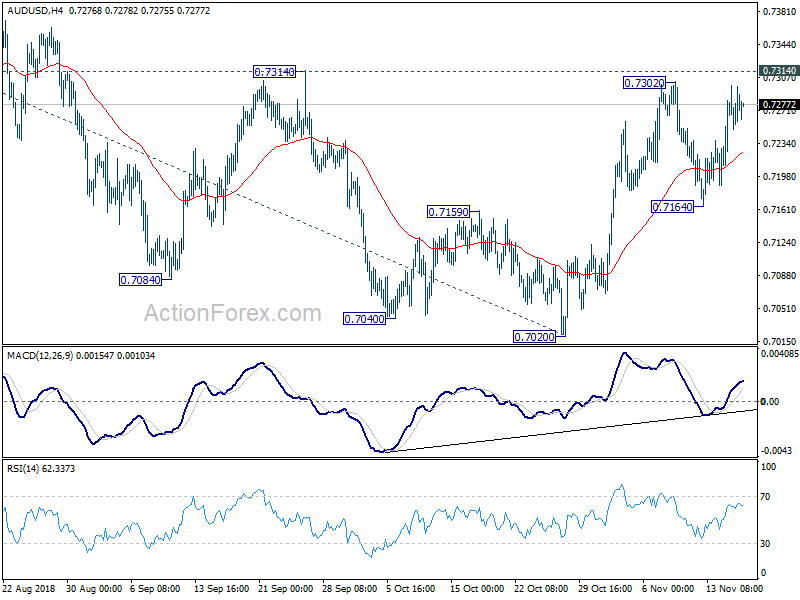
Intraday bias in AUD/USD remains neutral as it's staying in range below 0.7314 key resistance. On the upside, decisive break of 0.7314 will indicate medium term reversal. Further rally should be seen to 38.2% retracement of 0.8135 to 0.7020 at 0.7446 next. However, break of 0.7164 will suggest that rebound from 0.7020 has completed. In this case, medium term bearishness will be maintained. Intraday bias would be turned back to the downside for retesting 0.7020 low.
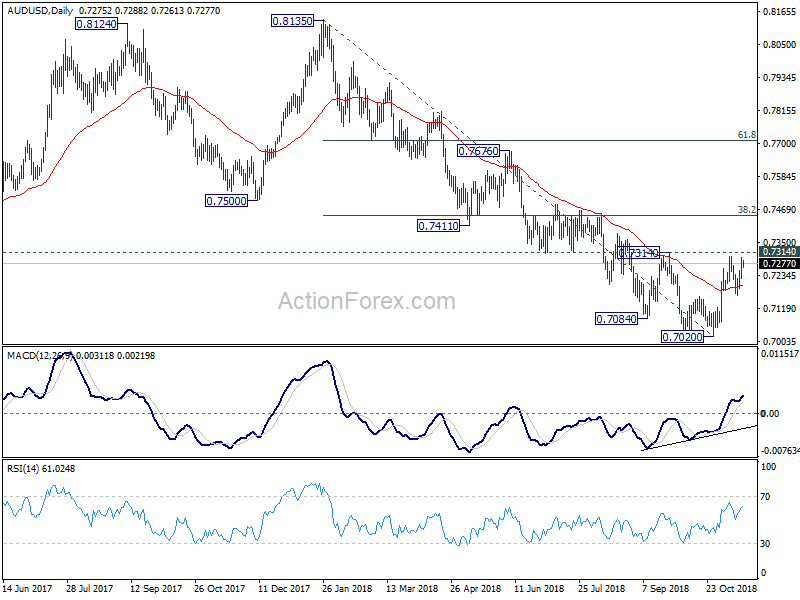
In the bigger picture, as long as 0.7314 resistance holds, fall from 0.8135 is tentatively treated as resuming long term down trend from 1.1079 (2011 high). Decisive break of 0.6826 will target 0.6008 key support next (2008 low). However, firm break of 0.7314 will suggest that whole decline from 0.8135 has completed. And, the corrective pattern from 0.6826 (2016 low) is extending with another rising leg towards 0.8135 before completion.
Crude Oil: Oil Trading Higher, Ahead Baker Hughes Weekly Rig Count
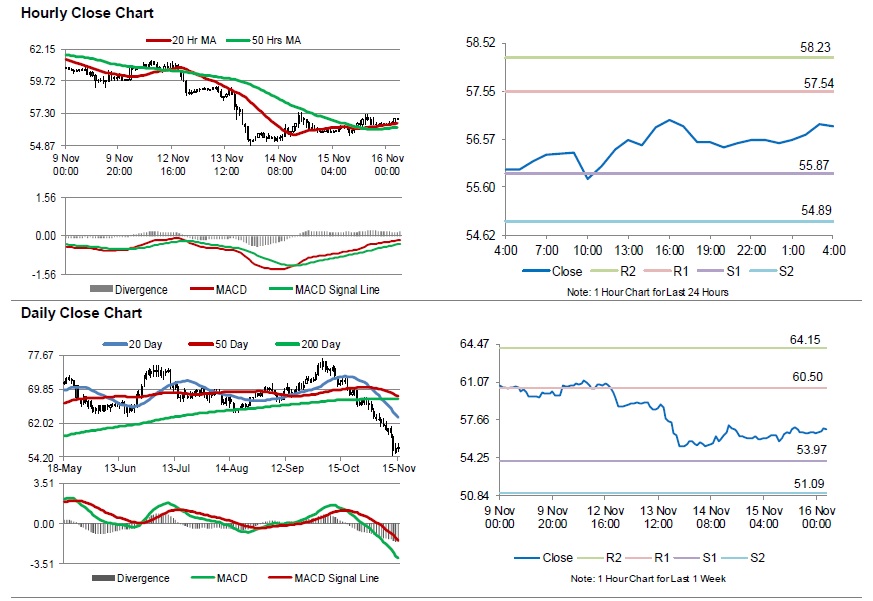
For the 24 hours to 23:00 GMT, Crude Oil rose 1.07% against the USD and closed at USD56.56 per barrel, after a weekly government report showed a huge decline in the US inventories of processed fuels. Meanwhile, the Energy Information Administration (EIA) report indicated that US crude oil stockpiles climbed for the eighth consecutive week by 10.3 million barrels to 451.1 million in the week ended 09 November.
In the Asian session, at GMT0400, the pair is trading at 56.84, with oil trading 0.50% higher against the USD from yesterday’s close, amid expected supply cuts from OPEC.
The pair is expected to find support at 55.87, and a fall through could take it to the next support level of 54.89. The pair is expected to find its first resistance at 57.54, and a rise through could take it to the next resistance level of 58.23.
Crude oil is trading above its 20 Hr and 50 Hr moving averages.
USD/JPY Daily Outlook
Daily Pivots: (S1) 113.24; (P) 113.48; (R1) 113.88; More..
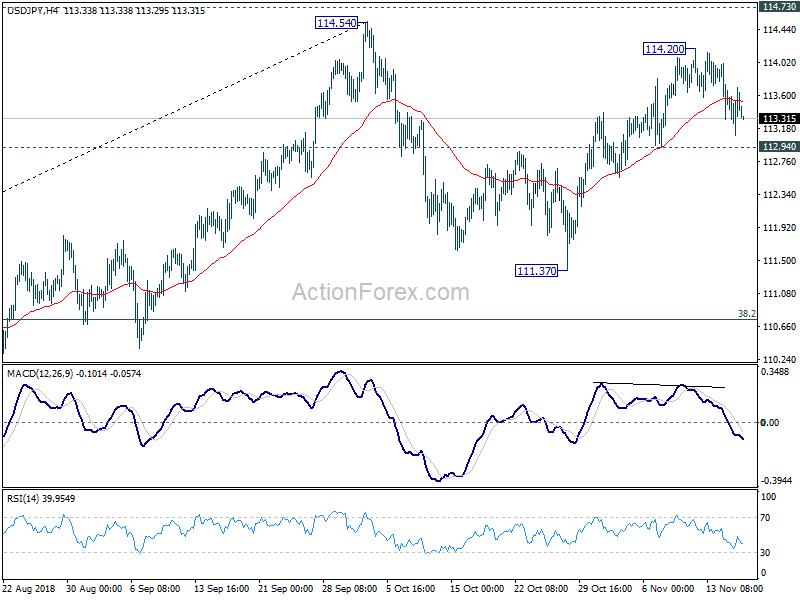
USD/JPY is staying in range of 112.94/114.20 and intraday bias is turned neutral first. As noted before due to loss of upside momentum, in case of another rise, upside should be limited by 114.54/73 zone to bring reversal. On the downside, break of 112.94 minor support will extend the consolidation pattern from 114.54 with another falling leg back to 111.37. Overall, rise from 104.62 is still in progress and decisive break of 114.73 will confirm resumption.
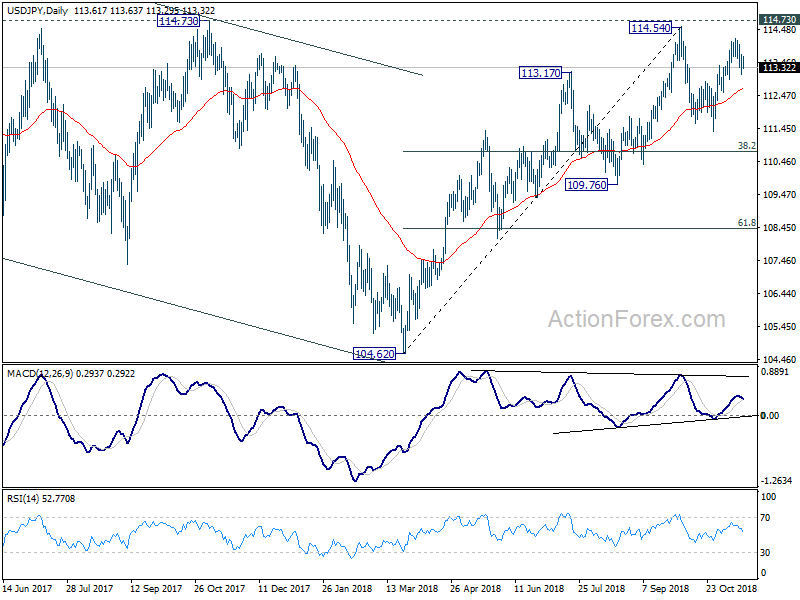
In the bigger picture, corrective fall from 118.65 (2016 high) should have completed with three waves down to 104.62. Decisive break of 114.73 resistance will likely resume whole rally from 98.97 (2016 low) to 100% projection of 98.97 to 118.65 from 104.62 at 124.30, which is reasonably close to 125.85 (2015 high). This will stay as the preferred case as long as 109.76 support holds. However, decisive break of 109.76 will dampen this bullish view and turns outlook mixed again.
EUR/JPY And GBP/JPY Recovery Remains Capped
The Euro and British Pound traded lower this week against the Japanese Yen. Both EUR/JPY and GBP/JPY are currently correcting higher, but they are approaching important resistances.
Important Takeaways for EUR/JPY and GBP/JPY
- The Euro is currently struggling near the 128.80 and 129.00 resistances against the Japanese Yen.
- There is a major bearish trend line formed with resistance at 128.80 on the hourly chart of EUR/JPY.
- GBP/JPY declined recently and traded near the 144.25 support level.
- There is a crucial resistance formed on the upside near the 146.00 level.
EUR/JPY Technical Analysis
The Euro started a major downside move from 130.00 resistance area against the Japanese Yen. The EUR/JPY pair declined heavily and broke the 129.00 and 128.50 support levels.
The pair even traded below the 128.00 support level and settled below the 50 hourly simple moving average. It traded as low as 127.49 and later started an upside correction. Buyers pushed the pair above the 128.00 and 128.20 levels.
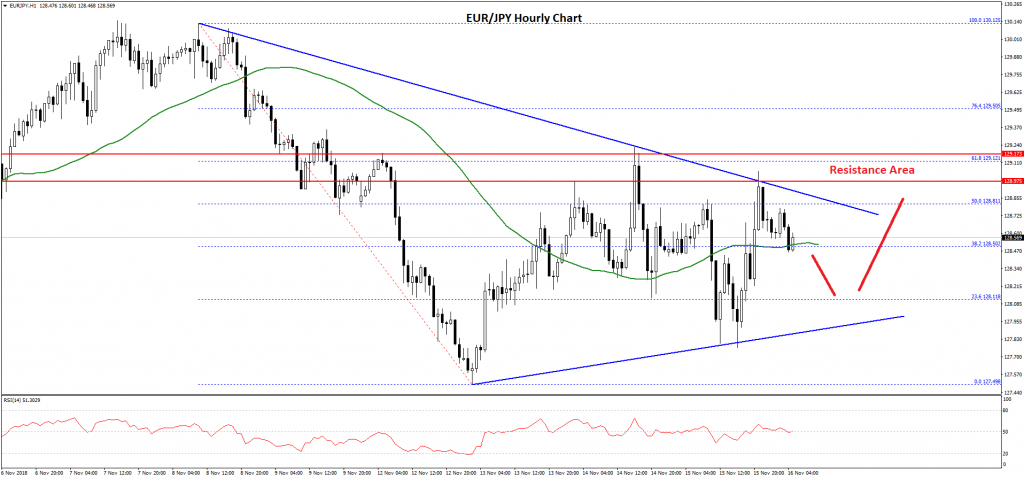
There was also a break above the 50% Fib retracement level of the last decline from the 130.12 high to 127.49 low. However, the pair faced a solid resistance near the 129.10 level.
Besides, the pair was rejected near the 61.8% Fib retracement level of the last decline from the 130.12 high to 127.49 low. More importantly, there is a major bearish trend line formed with resistance at 128.80 on the hourly chart of EUR/JPY.
At the moment, the pair is consolidating near the 128.50 level and the 50 hourly SMA. To climb higher, buyers need to break the 128.80 resistance, the same bearish trend line, and finally 129.00.
On the downside, an initial support is near the 128.35 level. There is also a connecting bullish trend line with support at 128.00 on the same chart. If there is a downside break below the trend line, the pair could revisit the 127.50 level.
Overall, the pair seems be facing a tough resistance near 128.80-129.00. It could either move above 129.00 or decline once again towards 127.50 in the near term.
GBP/JPY Technical Analysis
The British Pound was under a lot of pressure this week as it failed to move above the 149.00 resistance against the Japanese Yen. The GBP/JPY pair declined heavily and broke the 148.50, 147.50 and 147.00 support levels.
The decline was such that the pair also traded below the 145.00 support and settled below the 50 hourly simple moving average. It traded as low as 144.27 and later started a short term recovery. It tested the 23.6% Fib retracement level of the recent decline from the 148.72 high to 144.27 low.
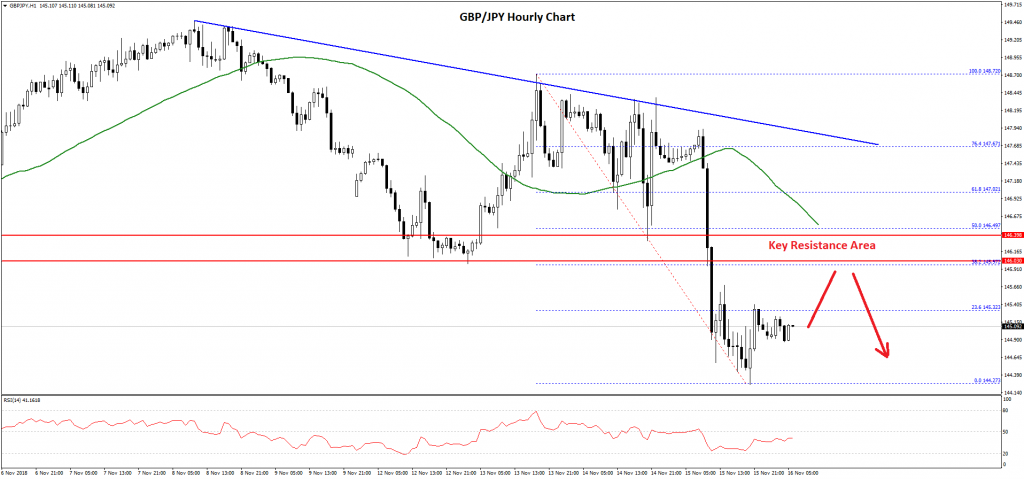
On the upside, there are many hurdles for buyers near the 146.00 level. The 146.00-146.50 zone was a support earlier, and now it is likely to act as a strong barrier for buyers.
Besides, the 50% Fib retracement level of the recent decline from the 148.72 high to 144.27 low is also near 146.50 to act as a resistance along with the 50 hourly SMA. If there is an upside break above the 146.50, the pair could trade above the 147.00 level.
Further above, there is a crucial bearish trend line with resistance at 147.60. Therefore, GBP/JPY is clearly facing a lot of hurdles near the 146.00, 146.50 and 147.00 levels. On the downside, an initial support is at 144.40, below which the pair could trade towards 144.00.
USD/CHF Daily Outlook
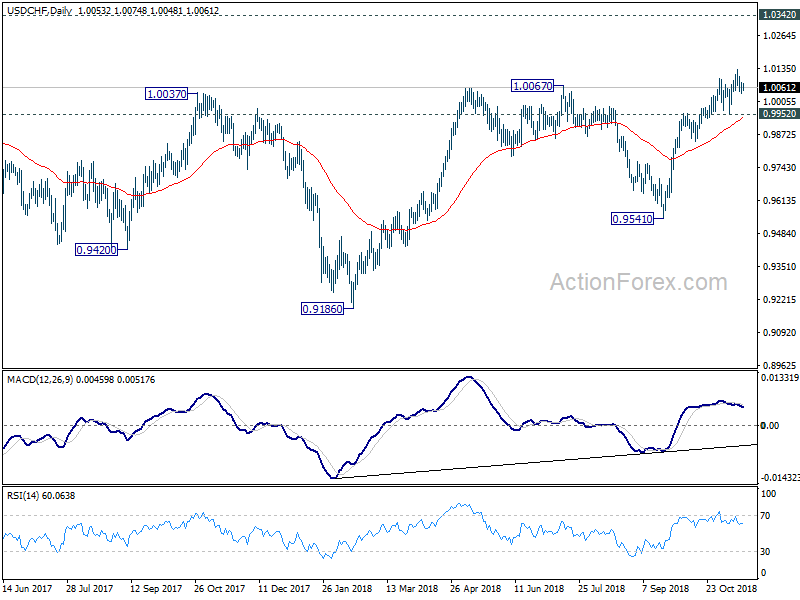
Daily Pivots: (S1) 1.0042; (P) 1.0061; (R1) 1.0085; More...
USD/CHF is staying in consolidation from 1.0128 temporary top and intraday bias remains neutral. As long as 0.9952 support holds, near term outlook remains bullish for another rise. On the upside, break of 1.0128 would resume larger rise from 0.9186 and target 1.0342 key resistance. However, firm break of 0.9952 will indicate short term topping and bring deeper fall back to 0.9848 support first.
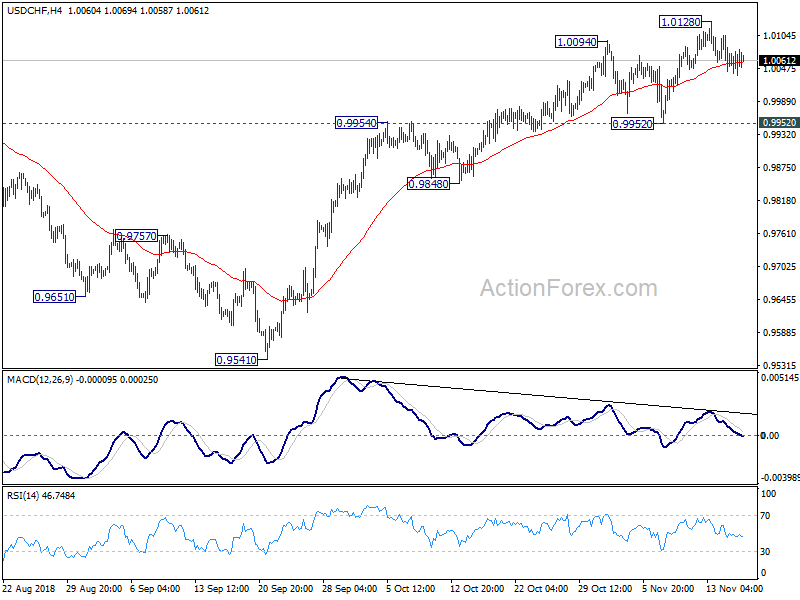
In the bigger picture, the pullback from 1.0067 has completed at 0.9541 already. And rise from 0.9186 is likely resuming. Firm break of 1.0067 will pave the way to retest 1.0342 key resistance. We'd be cautious on strong resistance from there to limit upside to bring another medium term fall to extend long term range trading. However, firm break of 0.9848 near term support will dampen this view and bring deeper decline back to 0.9541 support and possibly below.