Sample Category Title
USD/JPY Approaching Crucial Support Near 113.00
Key Highlights
- The US Dollar formed a short term top at 114.20 and declined recently against the Japanese Yen.
- There was a break below a major ascending channel with support at 113.65 on the 4-hours chart of USD/JPY.
- The US Retail Sales in Oct 2018 increased 0.8%, more than the +0.5% forecast.
- Today, the US Industrial Production for Oct 2018 will be released, which is forecasted to increase 0.2% (MoM).
USDJPY Technical Analysis
The US Dollar struggled to hold gains above the 114.00 level and declined recently against the Japanese Yen. However, there are many supports on the downside near 113.00, which could hold losses in USD/JPY
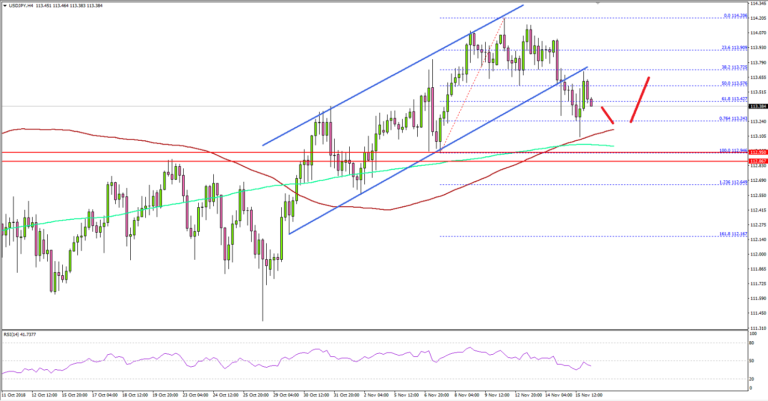
Looking at the 4-hours chart, the pair formed a short term top at 114.20 and declined below the 114.00 and 113.80 support levels. During the decline, the pair traded below the 50% Fib retracement level of the last wave from the 112.94 low to 114.20 high.
Moreover, there was a break below a major ascending channel with support at 113.65 on the same chart. The pair is now trading well below 113.80 and it seems like it could continue to move down towards the 113.10 support and the 100 simple moving average (red, 4-hours).
There is also a solid support near the 113.00 level and the 200 simple moving average (green, 4-hours). Therefore, dips from the current levels are likely to find support near 113.10 or 113.00. The next key support is near 112.64, which is the 1.236 Fib extension level of the last wave from the 112.94 low to 114.20 high.
On the upside, the previous support at 113.80 is an initial resistance followed by 114.00. Finally, a break above 114.20 could push the pair towards 115.00.
Fundamentally, the US Retail Sales for Oct 2018 was released recently by the US Census Bureau. The market was looking for an increase of 0.5% in sales compared with the previous month.
However, the result was better as there was a rise of 0.8% in sales in Oct 2018, but the last reading was revised from +0.1% to -0.1%. Overall, the report was positive for the US Dollar, which means downsides in USD/JPY might be limited.
EUR/USD corrected higher recently, but it failed near the 1.1350 level and declined. Similarly, GBP/USD faced sellers near 1.3060 and declined sharply.
Economic Releases to Watch Today
- Euro Zone CPI for Oct 2018 (YoY) – Forecast +2.2%, versus +2.2% previous.
- Euro Zone CPI for Oct 2018 (MoM) – Forecast +0.2%, versus +0.5% previous.
- Euro Zone Core CPI for Oct 2018 (YoY) – Forecast +1.1%, versus +1.1% previous.
- US Industrial Production Oct 2018 (MoM) – Forecast 0.2%, versus +0.3% previous.
- US Capacity Utilization Oct 2018 – Forecast 78.2%, versus 78.1% previous.
Daily Markets Broadcast
Wall Street rebounds after early sell-off
Early trading was bearish on Wall Street as Brexit and UK politics clouded global sentiment. Sentiment shifted on the day after strong retail sales data and positive press reports on US-China trade talks. The US30 index posted its first up-day in five days. UK shares were surprisingly resilient given the political headlines.
US30USD Daily Chart
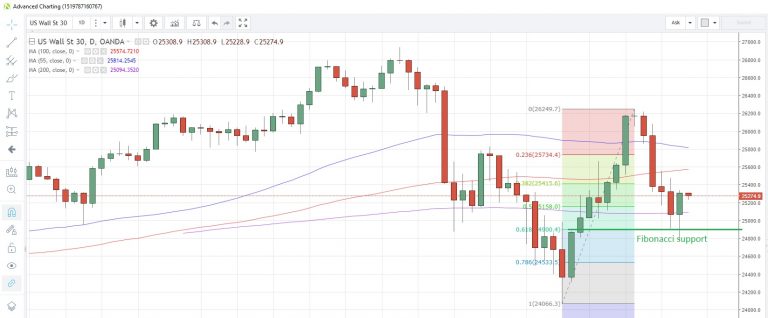
The US30 index snapped a four-day losing streak after earlier touching the lowest level this month
The index failed to close below the 61.8% Fibonacci retracement support level of the Oct29 to Nov8 rally at 24,900, despite spiking lower. The index has since regained a foothold above the 200-day moving average at 25,094
October retail sales topped estimates, rising 0.8% m/m versus 0.5% expected. US industrial production is expected to rise 0.2% m/m in October, slower than September’s 0.3% gain.
DE30EUR Daily Chart
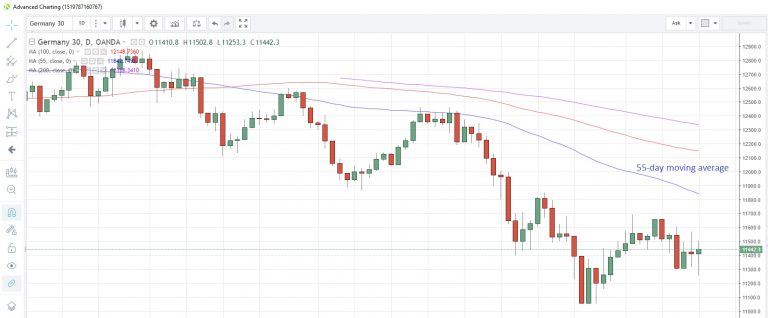
The Germany30 index echoed the turnaround in sentiment on Wall Street, overcoming early Brexit-related pressure. Italy and EU still trading comments regarding the 2019 budget plan
The index hit a 2-1/2 week low before rebounding. The 55-day moving average at 11,843 would act as the first upward resistance point
Euro-zone October consumer prices are due today, and are expected to hold steady at +2.2% y/y.
UK100GBP Daily Chart
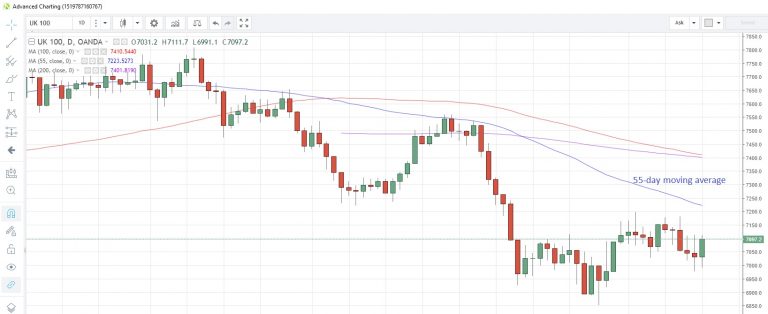
The UK100 index rallied yesterday for the first time in six days, despite all the Brexit and UK political issues
The index is rising toward the 55-day moving average at 7,224. This average has capped prices on a closing basis since August 10
Growing risk that UK PM May could face a vote of no confidence. It would need 48 members to sign a protest letter in order to trigger the vote.
All Is A Moot Point Next To Brexit Headline Watch
BREXIT BREXIT BREXIT
The fate of Brexit and UK leadership continued hanging in the lurch Thursday which predictably dominates=d the market attention triggering a wretched day for the Pound which cratered some 300 pips to a low print around 1.273 and “the street” will be on headline watch across all time zones. By all accounts, UK PM May is at the end of her rope as the Brexit deal is running out of time. GBP is waiting on significant unknowns, but the EU is reportedly optimistic. Bloomberg reports say it is already circulating an agenda for the November 25 Brexit Summit.
Trade War
Of course, the US-China trade war wandered back into the picture as the cumulative news feeds suggest despite some favourable concessions offered up by China. It appears that both parties are looking to kick the can down the road until February to resolve some significant differences. While not too surprising, the fear here is that this long and winding road to compromise could be dotted with numerous pratfalls.
The USD
While the USD dollar has not reacted at all to the data overnight so arguably, traders have put positive US economic signs on the back burner while arguably focusing on Jay Powell comments yesterday that suggested the Fed is watching downside global risk. If the market starts to ignore positive data while only focusing on the negative, the USD will not benefit from tethering itself to all the positive US numbers which have been at the forefront of USD appreciation this year, an overly dovish ECB and BOJ notwithstanding.
Oil Markets
Again, a significant crude build is weighing on market sentiment amid slowing global demand after The Energy Information Administration reported a substantial crude oil inventory build for the week to November 9 of 10.3 million barrels. While US inventory warehouses remain at eye-watering peaks and the most significant build since 2017, but by-products drew down significantly which held trader’s downside ambition in check.
Also adding a modicum of support, Saudi Arabia admitted they were duped by Presidents Trump who may have orchestrated probably one of the best sleights of hand tricks in some time. He effectively drove prices lower by offering up far more Iran sanction waivers than expected; The US administration caught OPEC wrong-footed by what was supposed to be the harshest sanction ever applied to Iran only for the US to take relatively mild action exacerbating the supply glut.
Indeed, the Saudi’s cannot be too happy with Trump’s waivers, suggesting OPEC will cut production of 1.4 million barrels while risking the wrath of President Trump. Indeed the ” Made in America oil policy ” has significantly dented oil market sentiment. US shale producers are equally responsible for global oversupply. The latest data show producers running at an accelerating pace, placing the US as the largest oil producer in the world. As well, President Trumps stinging OPEC tweets have legs. And then US tariffs are compounding China’s economic woes and are fanning concerns about demand growth in 2019 and 2020.
The markets do appear to be finding some semblance of a base as the relatively flat and supportive price curve suggest traders are respecting the fact OPEC and its allies considering production cuts of more than the initially mentioned 1mm barrels per day. However, Russian President, Vladimir Putin claimed that Russia, the largest non-OPEC ally, refuses to commit to production cuts just yet as he sees approximate current price levels as suiting them just fine. Putin went on to state that “where it [crude prices] is now, where it was recently, anything around $70 suits us [Russia] completely.”
So, for the time being, anyway looming production cuts will act as a foil to the downside risk from shockingly high US inventory builds
Gold Markets
A softer US dollar, GBP notwithstanding and the Fed triggering some early warning signals about global growth risk in 2019 is being viewed in a positive light for Gold market. Compound this with the usual toxic combination of tasks brewing in virtually every corner of the political world; Gold should continue to find demand on dips provided the USD remains in check
Currency markets
All is a moot point next to Brexit headline watch.
Eco Data 11/16/18
[php_everywhere instance="1"]
CHFJPY Bearish Risks Alive in Short and Medium Term
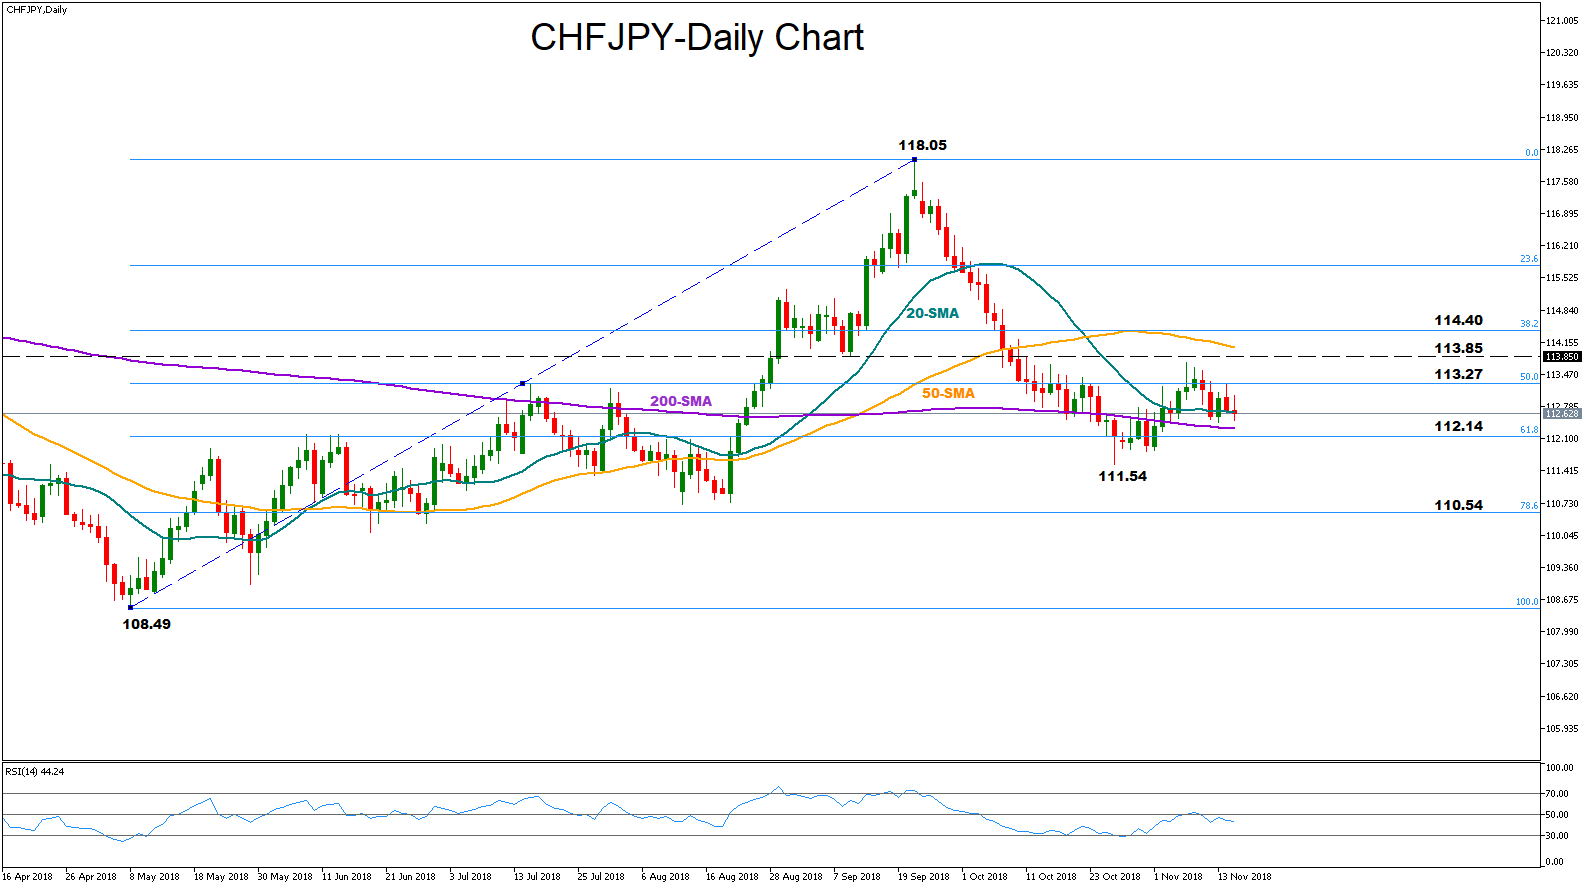
CHFJPY lost significant ground after the spectacular rally towards the pair’s highest since February of 118.05, falling as low as 111.54. Even though it attempted to recoup losses early this month, the pair somewhat reentered bearish mode this week, with the RSI flagging further weakness ahead; the indicator is currently heading south in bearish territory below 50 -notice though that it does not maintain a steep negative slope.
A leg lower could meet support from the area around 112.14, where the 200-day simple moving average (SMA) and the 61.8% Fibonacci retracement of the upleg from 108.49 to 118.05 roughly coincide. Under that obstacle, support could take place around the 78.6% fibo of 110.54, though prior to that it would be interesting to see whether the bears can violate the 111.54 low registered on October 26.
On the flipside, a reversal to the upside may find immediate resistance between the 50% Fibonacci of 113.27 and September 11’s trough of 113.85, a conjunction area in the past. If the price manages to decisively pierce through this zone, the door could open for the 38.2% Fibonacci of 114.40, while slightly higher the 115.00 psychological mark could be the next target.
In terms of the medium-term picture, the market returned to neutrality following the pullback from 118.05. It seems however that the trend is more likely to stay on the downside as the 50-day simple moving average (SMA) has already begun to slope downwards.
To sum up, the risk in the short term and the medium term is tilted to the downside.
British Pound Plunges as May Under Attack Over Brexit Deal
GBP/USD is down sharply in the Thursday session, as the turmoil over Brexit has weighed heavily on the British pound. In North American trade, the pair is trading at 1.2758, down 1.77% on the day. On the release front, British retail sales declined -0.5%, well below the estimate of 0.2%. In the U.S., it’s a busy day. Retail sales rebounded with a strong gain of 0.7% in October, after a decline of -0.1% a month earlier. Core retail sales jumped 0.8%, after a gain of 0.1% in September. Elsewhere, the Philly Fed Manufacturing Index fell sharply to 12.9, shy of the estimate of 20.1 points. Unemployment claims edged higher to 216 thousand, above the estimate of 213 thousand. This was the highest reading since August. On Friday, the U.K releases CB Leading Index.
It has been a day of drama in London, as an embattled Prime Minister May attempts to sell the Brexit agreement between Britain and the European Union. It promises to be an uphill battle for May, as many Conservative MPs are against the agreement, particularly over the proposed customs agreement with the EU. Brexit Secretary Dominic Raab resigned on Tuesday, and there were calls in parliament for a no-confidence vote against May. With Labor vowing to shoot down the agreement, May will have a tough time getting a majority in parliament for the agreement. The EU announced that a special summit on Brexit on November 25, but the markets remained concerned that a ‘no-deal’ scenario is a real possibility. This negative sentiment has sent the pound reeling, with GBP/USD posting its sharpest one-day loss of 2018.
Overshadowed by the political drama in Westminster was a dismal reading from British retail sales. The indicator came in at -0.5%, its second straight decline. Consumers are nervous about Brexit and are holding tighter to their purse strings. As well, the mild autumn weather has put a damper on sales of winter clothes. The dismal retail sales release could dampen consumer and investor confidence, which could push the wobbly pound even lower.
On Wednesday, U.S consumer inflation numbers beat their estimates for October. The consumer price index posted a gain of 0.3%, its strongest gain since January. Core CPI, which excludes food and energy prices edged higher to 0.2%, marking a 3-month high. Both releases were in line with forecasts. Core CPI was 2.1% higher than a year ago, and this solid release means that the Fed remains on track to continue raising interest rates. The Federal Reserve holds its next policy meeting in December, with the odds of a December rate hike at 72%, according to the CME Group.
Elliott Wave Analysis: S&P500 and Nasdaq100 Update
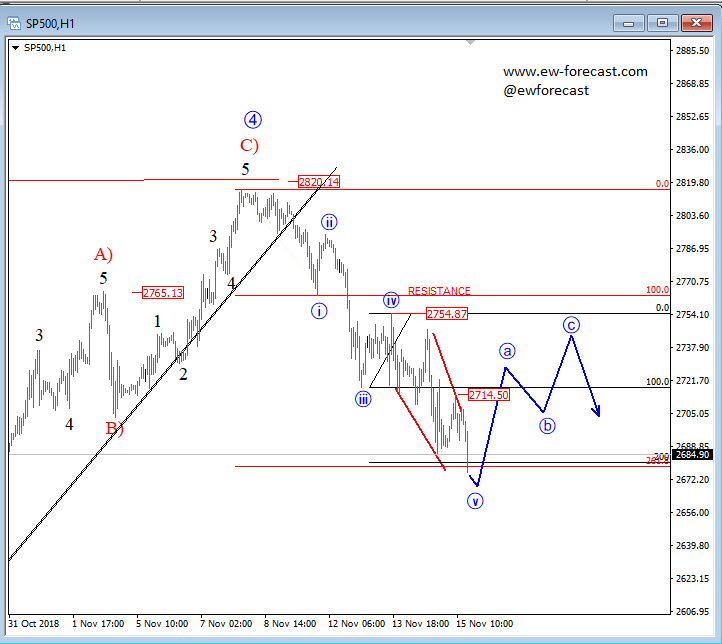
S&P500 like Nasdaq found a new low, with an ending diagonal within wave v. We can now see price trading at possible Fibonacci support around 200.0 and 261.8, from where a new bounce and a temporary reversal in three-waves may follow. That said, a rally in impulsive fashion and above the 2714 level will confirm a correction to be in play.
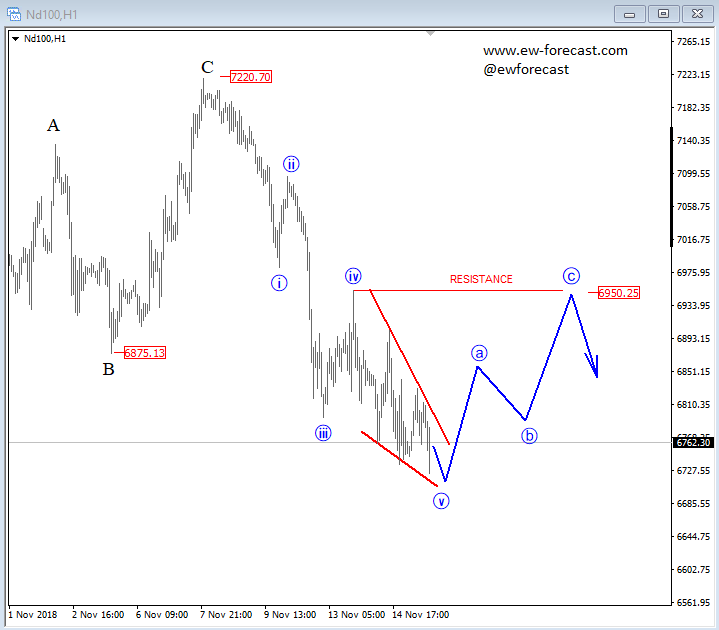
NASDAQ also found a new low. After that five-wave decline in the US stock market, wave »v« looks like an ending diagonal, so watch out for a bounce into a three-wave a-b-c correction back to 6950 resistance area, from where we may see another sell-off!
Position trading: CAD/JPY short entered
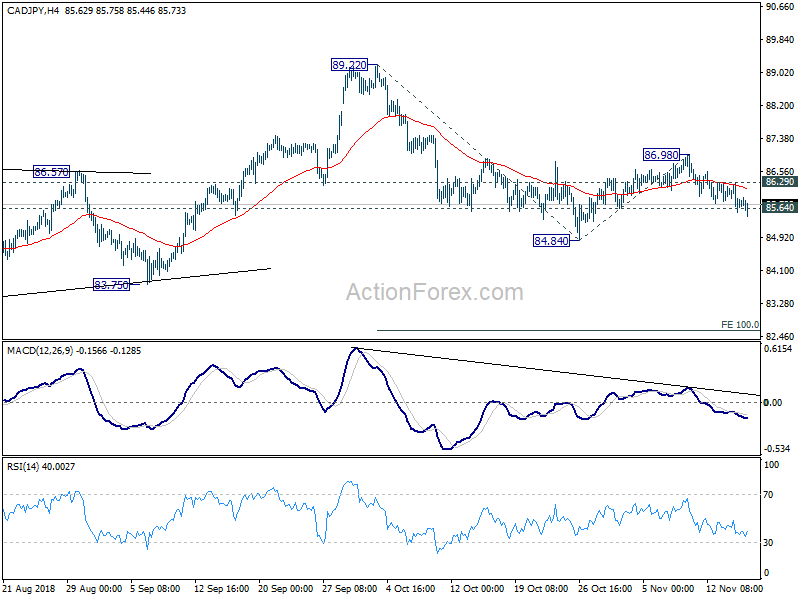
** Quick update: The position is stopped out with 66 pips loss within hours after this post. Following up on our position trading strategy mentioned in the weekly report, we've entered CAD/JPY short on break of 85.64 support. The development is actually quite disappointing as, despite WTI oil's free fall to below 55, CAD remains relatively resilient. Though, Yen is starting to pick up some strength for rebound, with USD/JPY in risk of near term reversal.
Near term outlook in CAD/JPY remains unchanged that corrective rise from 84.84 should have completed at 86.98 already. So, we'd hold on to CAD/JPY and lower the stop from 87.00 to 86.30 (slightly above 86.29 minor resistance). A break of 86.29 will suggests that the corrective rise from 84.84 is going to extend with another rise and 86.98 will likely be breached. So, if we're wrong in our view, there is no point in holding on to the stop at 87.00.
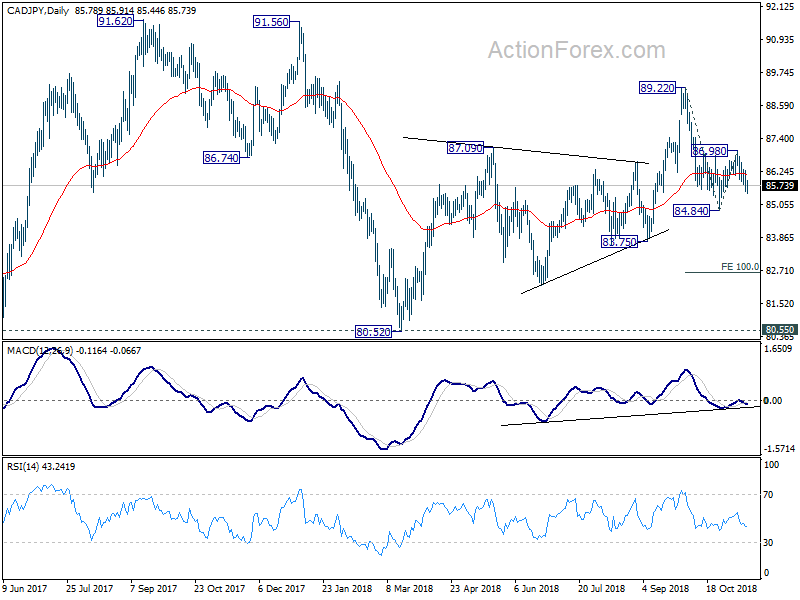
The overall larger outlook is unchanged that rise from 80.52 (March low) is a corrective three wave move that has completed at 89.22. Fall from 89.22 is, in a more bearish case, resuming the down trend from 91.62 (2017 high) through 80.52/55 support. Or in a less bearish case, fall fro 89.22 is a falling leg in the medium term range pattern. In either case, deeper decline is in favor to have a test on 80.52 low.
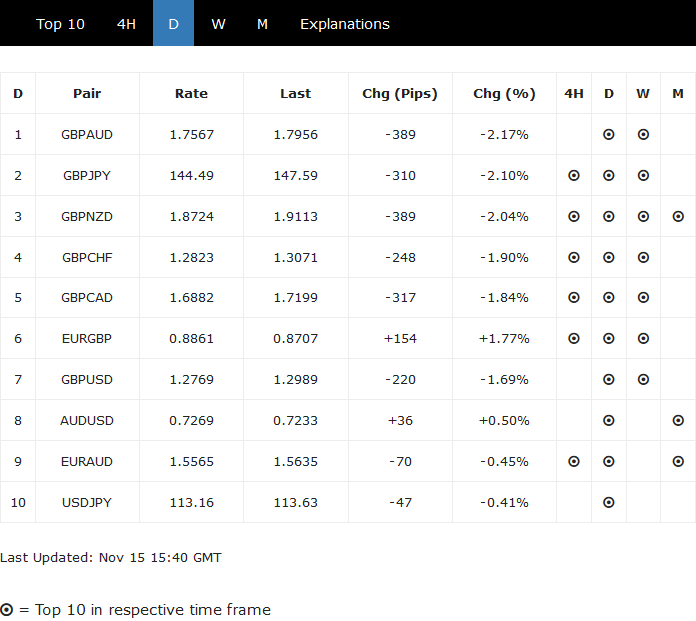
Today’s top mover: More medium term bearishness in GBP/AUD with today’s free fall
At the time of writing, GBP/AUD is the top mover today, rightly so. Pound is pressured by political turmoil in the UK. Everybody knows it. Aussie is boosted by strong employment data, and optimism over US-China trade negotiation.
Following up on our last note on GBP/AUD here. The rebound off 61.8% retracement of 1.7282 to 1.8726 at 1.7863 was out of our expectations. But GBP/AUD failed to take out 1.8156 resistance anyway and maintained bearishness. And finally, this 1.7863 fibonacci support is taken out firmly today.
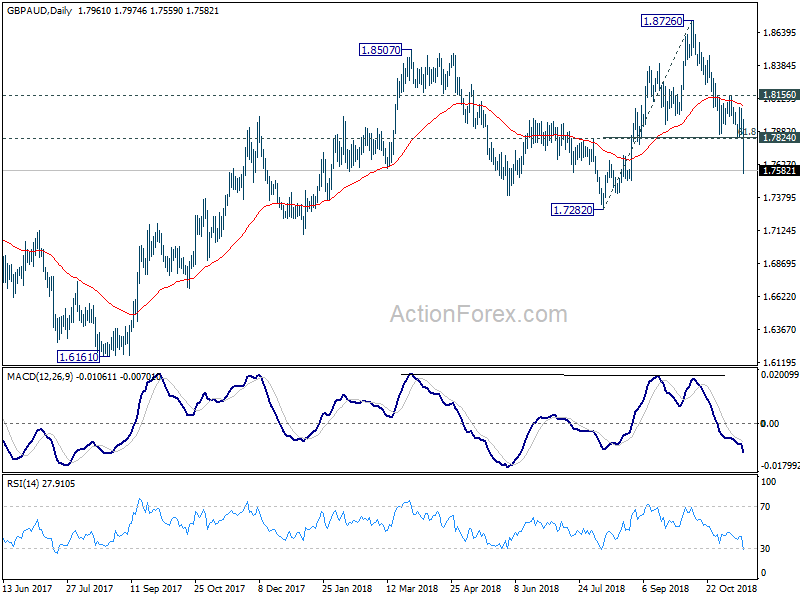
The development now adds to the case of medium term bearish reversal. That is, whole "corrective" up trend from 1.5626 (2016 low) has completed at 1.8726 on after missing 50% retracement of 2.2382 to 1.5626 at 1.9004. This is also supported by bearish divergence condition in weekly MACD.
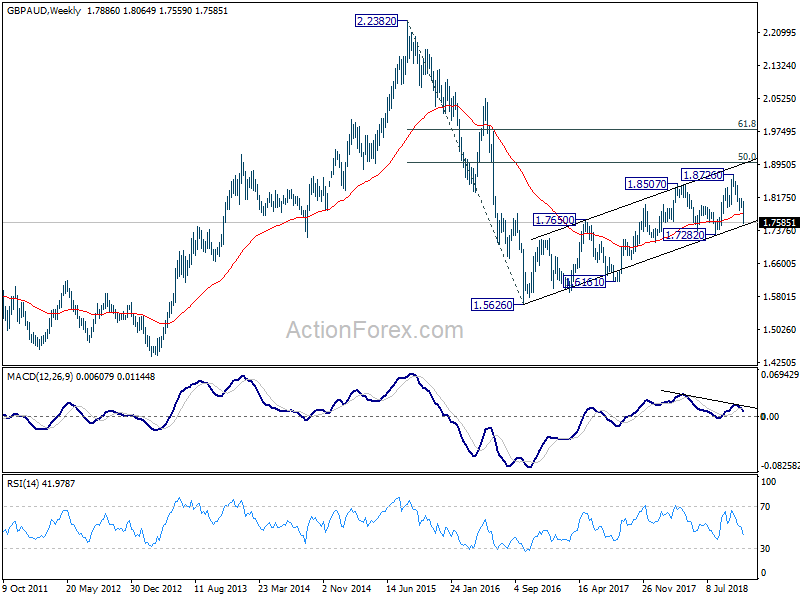
Deeper decline should be seen back to 1.7282 key support level first. Decisive break there will pave the way back to 1.5626 in medium term. And there is prospect of even resuming the down trend from 2.2382 (2015 high) through 1.5626 low in the long term. For now, this will be the preferred case as long as 1.7824 support turned resistance holds.
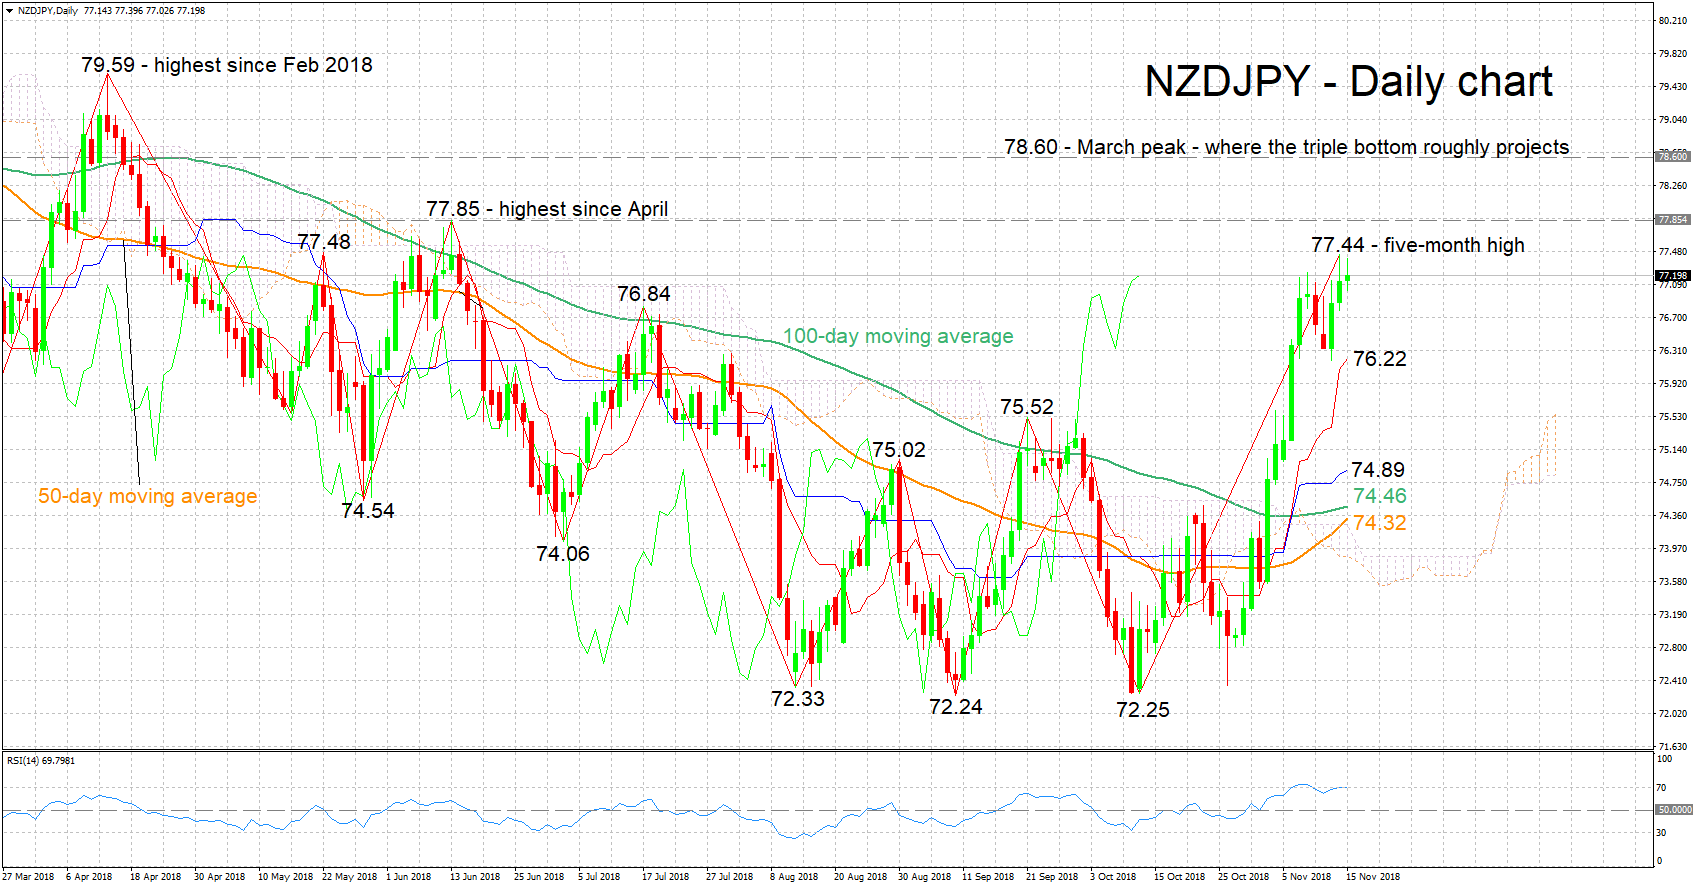
NZDJPY Around 5-Month High; Rally Could be Overstretched
NZDJPY is trading not far below Wednesday’s five-month high of 77.44. The pair has staged a remarkable recovery from early October’s low of 72.25, this being only marginally above September’s more than two-year nadir of 72.24.
The Tenkan- and Kijun-sen lines are positively aligned, attesting to the bullish short-term bias that is in place. However, notice that the Chikou Span may be signaling an overextended rally, the implication being that a near term pullback could take place. The RSI, which is practically at the 70 overbought level, is also cautioning that the move up may be overstretched.
Advances above yesterday’s multi-month high may meet initial resistance around the 77.85 top. Further above, the area around the March peak at 78.60, which is also where the triple bottom reversal pattern completed in October approximately projects to, could also act as a barrier to gains. More bullish movement would eye 79.59, the pair’s highest since February.
In case of declines, support could emerge around 76.84, this being a top from July. Lower, the Tenkan-sen at 76.22 would come into focus, with stepper losses turning the attention to the zone around a recent high at 75.52.
The gains from early October onwards have managed to turn the medium-term picture to a bullish one. Lending credence to this view is trading activity taking place above the 50- and 100-day moving average lines, as well as above the Ichimoku cloud. Also, a bullish cross by the two MAs increasingly looks imminent.
To conclude, both the short- and medium-term outlooks appear positive at the moment. There are signals of an overstretched rally in the near term though.