
There were some interesting turns in the financial markets last week. Global equities initially cheered after Democrats sealed a tremendous win in the US mid-term election by regaining majority in the House. But the lift quickly faded as stocks suffered quite notable setbacks towards Friday’s close. It looked like US treasury yields are ready to resume recent up trend after FOMC statement, which did nothing to alter the expectation of a December hike. But yields then reversed on Friday and closed generally lower.
In the currency markets, for the week, Australian and New Zealand Dollar were strongest, as initially lifted by rebound in Asian stocks. Aussie was supported by slightly more up beat RBA economic outlook. Kiwi was also additionally boosted by strong employment data. Sterling was the third strongest as there was some Brexit optimism. Canadian Dollar was the weakest as crude oil was in free fall. It’s followed by Yen on risk appetite and Euro on Italian’s budget showdown with EU.
But, for Friday, Yen was clearly the strongest one, followed by Swiss Franc, as risk appetite receded. Dollar also extended post FOMC rebound. Sterling was the worst performing one after soft September GDP and the never ending Brexit impasse. Australian Dollar was the second weakest, followed by Canadian Dollar and then New Zealand Dollar. Friday’s picture was in contrast with the weekly picture. Except that, Canadian Dollar was weak throughout. So, it looks like the markets, at least part of them, are turning around.
Dollar and yields tried to rally, but no follow through yet
Let’s have a look at Dollar first. Both USD/JPY and USD/CAD took the lead by resuming recent rally. But EUR/USD was held above 1.1300 low. USD/CHF was kept below 1.0094 high. Thus, there is no confirmation of broad based strength in Dollar yet. Though, GBP/USD’s steep fall now put focus back t 1.2951 minor support. And break there will indicate near term reversal and could help lift Dollar up elsewhere.
Developments in Dollar Index was positive too even though it has yet to confirm it’s strength The strong support seen from near term rising channel as well as rising 55 day EMA is certainly bullish. But it has yet to take out 96.98 key resistance decisively.
It also looked like 10-year yield could follow 5-year yield higher by breaking 3.248 resistance to resume medium term up trend. The rebound from 3.059 after touching rising 55 day EMA was also bullish. Yet, TNX was rejected mildly by 3.248 resistance to close at 3.189. This is a factor limiting Dollar’s rally on Friday.
Yen crosses defended key resistance, ready for reversal?
Yen defended some key levels last week. EUR/JPY hit as high as 130.14 but failed to break out 130.20 near term resistance and retreated. GBP/JPY was even strong and hit as high as 149.48. But it was rejected by 149.70 near term resistance to closed down at 147.66. Indeed, GBP/JPY was a top mover on Friday, indicating the intensity of the selloff.
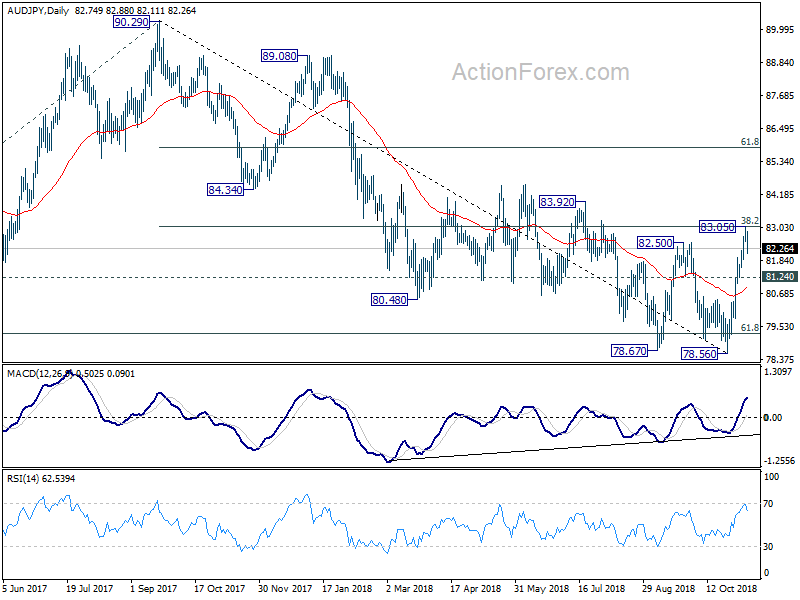
AUD/JPY also hit as high as 83.05 but was rejected by 38.2% retracement of 90.29 to 78.65 at 83.04 retreated sharply Near term outlook stays bullish, as long as 81.24 support holds. However, break of 81.24 on come back of risk aversion will invalidate the double bottom (78.67, 78.56) bullish reversal case. Medium term bearishness will be revived too.
More weakness in stocks, Asia in particular
Talking about risk aversion, China Shanghai SSE tried to break through 55 day EMA for a whole week but failed. It finally gave up to close sharply lower at 2598.87. More importantly, the decline started with a gap down. And it that also kept SSE indicate medium term falling channel, and makes the rebound from 2449.19 look corrective. Some might point to the optimism on solving some US-China trade conflict at the Trump-Xi meeting later in the month. But investors seemed not too convinced by such hopes.
Nikkei is not as bearish as the SSE. But the rejection by 55 day EMA and the sharp decline on Friday was not a good sign too.
The development of Nikkei was somewhat mirrored in S&P 500, which was rejected by 2816.94 resistance and 55 day EMA. But DOW has taken out equivalent resistance level. So the overall picture of SPX is probably even less bad. But comparing the three, it’s clear that the SSE looks rather bearish.
WTI oil in clear medium term decline
The more consistent development was found in WTI crude oil. It’s now rather clear that 76.69 is a medium term top. Up trend from 26.05 should have completed after hitting 61.8% retracement of 107.68 to 26.05 at 76.50, on bearish divergence condition in weekly MACD. The decline from 76.90 should be developing into a medium term move. 38.2% retracement of 26.05 to 76.90 at 57.48 would likely be taken out eventually for 61.8% retracement at 45.47.
To conclude, there is prospect of more Dollar strength ahead. But it has to break through 1.1300 against Euro first. And it should best be accompanied by upside breakout in 10 year yield. Or a reversal in yield would drag Dollar down and trigger a rebound in EUR/USD. There is prospect of a bullish turnaround in Japanese yen should selloff in Asian equities intensify. For the same reason, there is prospect of a bearish turn around in Aussie. But it would likely be overshadowed by Canadian Dollar which is dragged down by selloff in oil prices. Euro could stay overall mixed on Italy which Sterling is a wild card on Brexit.
Position trading strategy
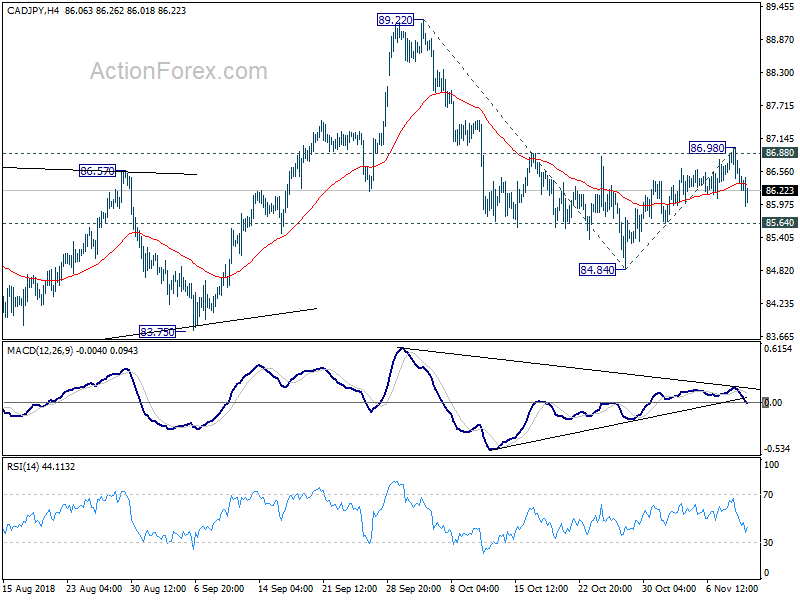
Just like last week, Dollar is a candidate for going long but it cannot convince us yet. Instead, we’ll turn to CAD/JPY for short opportunity. The corrective recovery from 84.84 has likely completed at 86.98 after hitting 86.88 resistance. Fall from 89.22 is possibly ready to resume.
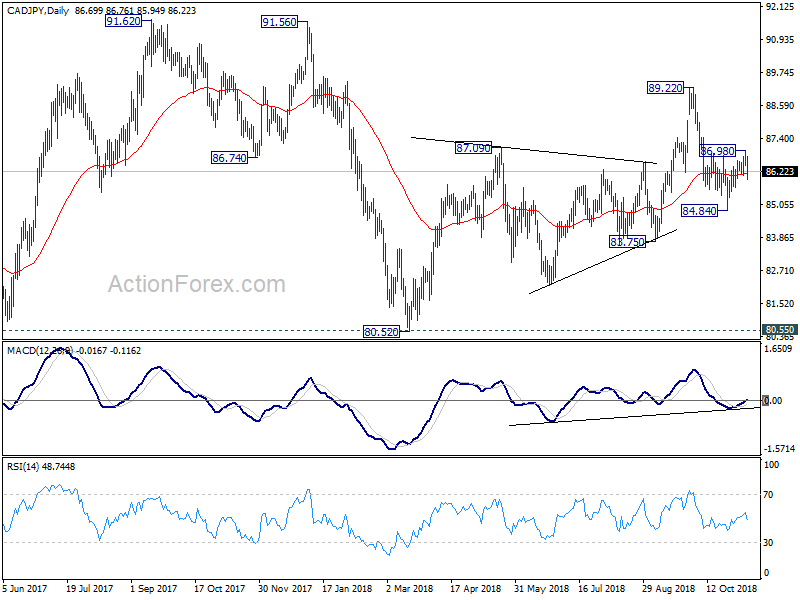
The bigger picture suggests that rise from 80.52 (March low) is a corrective three wave move that has completed at 89.22. Fall from 89.22 is, in a more bearish case, resuming the down trend from 91.62 (2017 high) through 80.52/55 support. Or in a less bearish case, fall fro 89.22 is a falling leg in the medium term range pattern. In either case, deeper decline is in favor to have a test on 80.52 low.
So our strategy is selling CAD/JPY on break of 85.64 minor support. That will add more credence to the bearish case of resuming decline from 89.22. Stop will then be put at 87.00, slightly above 86.98. First target is 100% projection 89.22 to 84.84 from 86.98 at 82.60. But we’re looking at 80.52 as the target. For the latter, risk/reward is at around 1:3.76.
EUR/USD Weekly Outlook
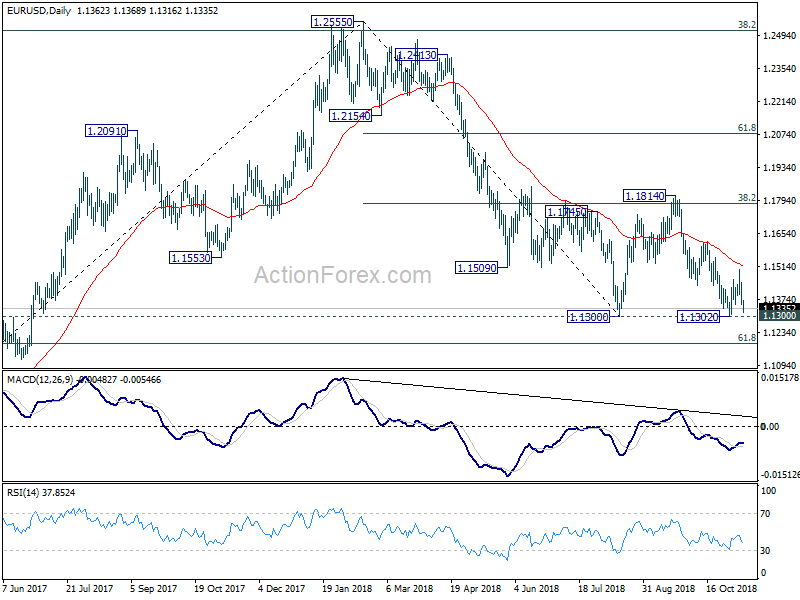
EUR/USD’s recovery was limited at 1.1499 last week, below falling 55 day EMA, and dropped sharply since then. Initial bias stays on the downside this week for 1.1300 low. Decisive break there will resume the whole down trend from 1.2555 and target 1.1186 fibonacci level next. On the upside, though, break of 1.1499 resistance will turn bias back to the upside for another rebound. But after all, price actions from 1.1300 are seen as developing into a corrective pattern. So, down trend resumption would just be delayed.
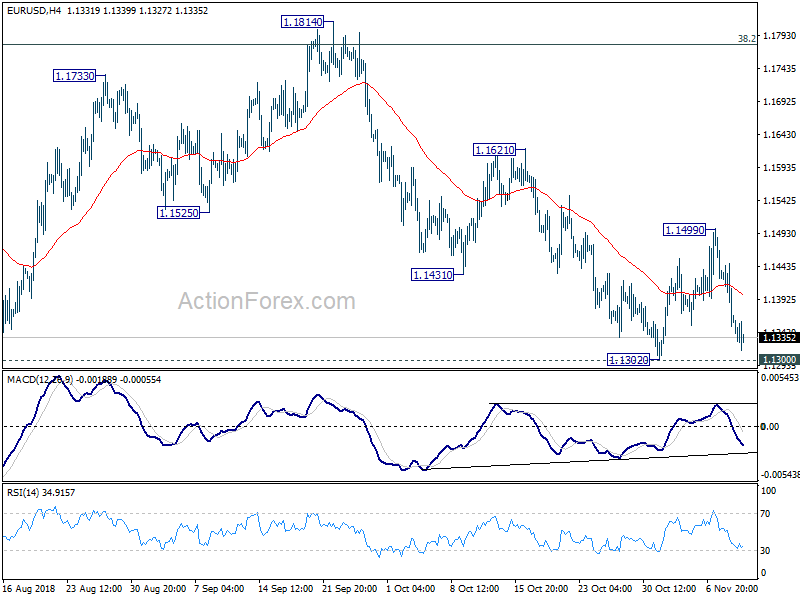
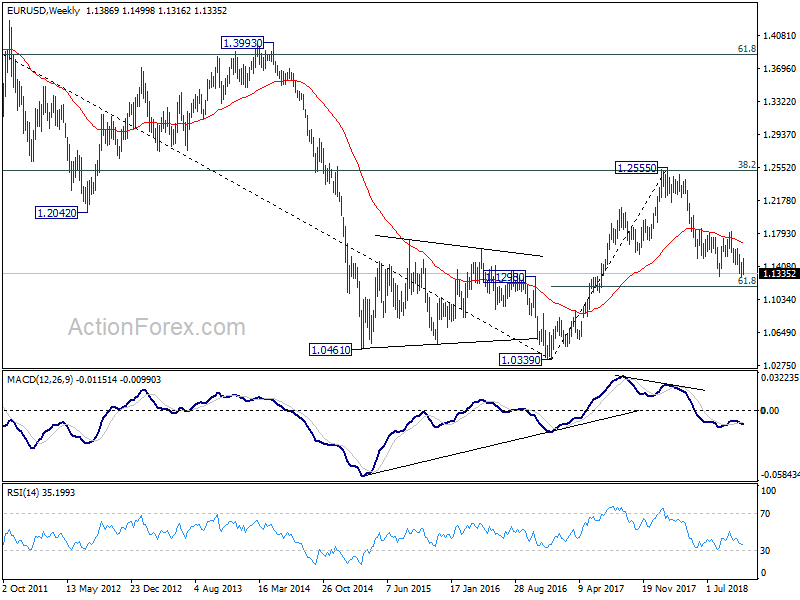
In the bigger picture, price actions from 1.1300 is seen as a corrective pattern. Decisive break of 1.1300 will resume the down trend from 1.2555 to 61.8% retracement of 1.0339 (2017 low) to 1.2555 at 1.1186 next. Sustained break there will pave the way to retest 1.0339. In case the consolidation from 1.1300 extends, upside should be limited by 1.1814 and 38.2% retracement of 1.2555 to 1.1300 at 1.1779. to bring down trend resumption eventually.
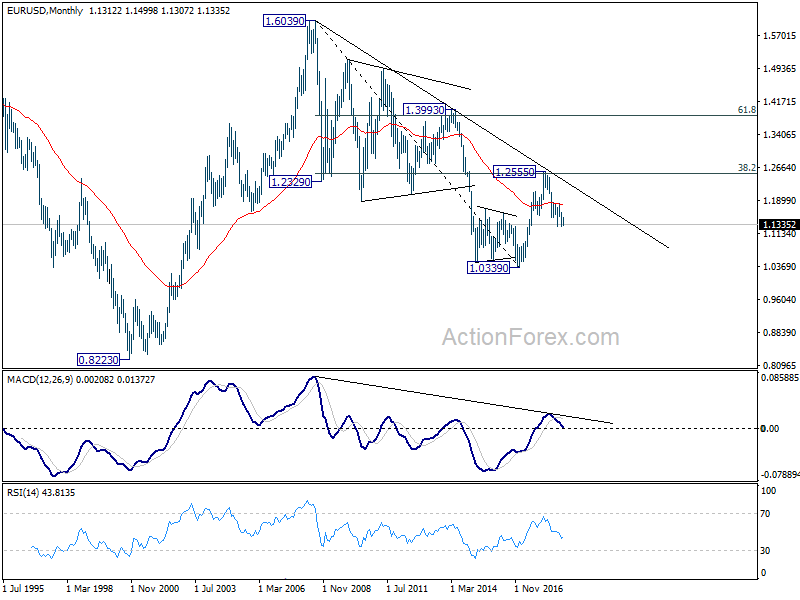
In the long term picture, the rejection from 38.2% retracement of 1.6039 to 1.0339 at 1.2516 argues that long term down trend from 1.6039 (2008 high) might not be over yet. EUR/USD is also held below decade long trend line resistance. Firm break of 61.8% retracement of 1.0339 to 1.2555 at 1.1186 should at least bring a retest on 1.0339 low.


