Sample Category Title
WTI Oil Outlook: Oil Prices Stand At The Back Foot Ahead Of Crude Inventories Reports
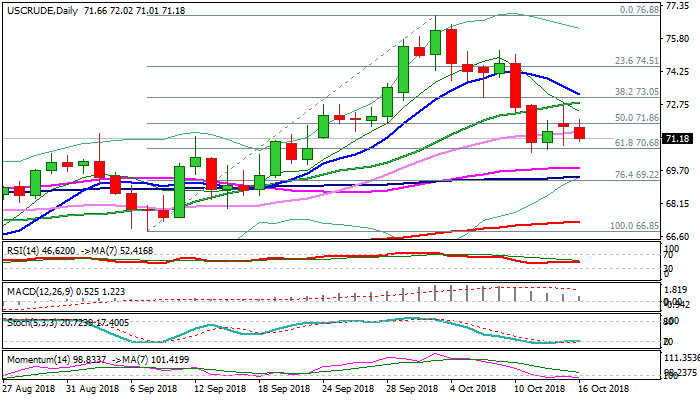
WTI oil was lower on Tuesday after recovery attempts previous day stalled and daily action ended in long-legged Doji, signaling strong indecision.
The prices came under pressure on report that production of US shale oil hit record high and on expectations of further of US oil inventories, with reports of fall of exports from Iran, partially offsetting negative impact.
Today's action holds in red as negative fundamentals are supported by weak techs, which maintain bearish momentum.
Near-term focus turns on cracked Fibo support at $70.68 (61.8% of $66.85/$76.88 upleg) which so far contained repeated attacks, with break here to signal and end short consolidation and continuation of bear-leg from $76.88 (03 Oct high).
Firm break lower would expose psychological $70 support, daily cloud top ($69.89) and 55 / 100SMA's ($69.83 / $69.41 respectively) in extension.
At the upside, rising 20SMA which capped Monday's upticks ($72.81) marks pivotal barrier, break of which would provide relief.
US Crude stocks reports are in focus, with API report due today and EIA report on Wednesday, expected to provide fresh signals.
Res: 72.02, 72.81, 73.19, 73.47
Sup: 71.01, 70.68, 70.49, 70.00
Markets Stable For Now But Risks Pile Up
Saudi in the spotlight as lies start to unravel
Investors may not be feeling particularly comfortable yet but we are seeing some welcome stability in the markets on Tuesday, with Europe posting small gains following a mixed session in Asia overnight. US futures are also pointing a little higher which will provide some comfort following a number of rather explosive sessions.
As ever, politics is driving everything right now and while a trade spat between the US and China has gone quiet, it’s been Saudi Arabia in the spotlight following the disappearance and alleged murder of journalist Jamal Khashoggi. Brexit is never far from the headlines as the UK and EU continue efforts to resolving the Northern Ireland backstop – without much success – while Italy offers another headache from within after it submitted its first populist budget that put it on a collision course with Brussels as it breaks its fiscal rules.
Oil eases as Trump takes heat out of situation
Oil prices have continued to edge lower on Tuesday, as Trump appeared to take some of the heat out of the Saudi situation following a phone call with King Salman. Trump appeared reassured by the conversation after the King denied any knowledge of what happened, which suggests he’ll be in no rush to impose sanctions or other measures against the country.
While it later emerged that Saudi Arabia was willing to admit that Khashoggi was unintentionally killed during an interrogation, having previously claimed he left via the back door, traders don’t appear to believe that this will influence Trump’s response to the situation with the American President clearly very reluctant to enter into a tit-for-tat with a key middle eastern ally.
Saudi Arabia has a number of options at its disposal for responding to US sanctions, including causing severe disruption in the oil market if it suddenly reduced output in what is already a tight market. Prices have already risen to levels not seen in four years and if the Saudi’s decide to use this as a weapon, it could cause prices to soar which would be very damaging for the global economy. There is a hope that the self-harming nature of such a move would deter such action.
UK wage growth accelerates in August
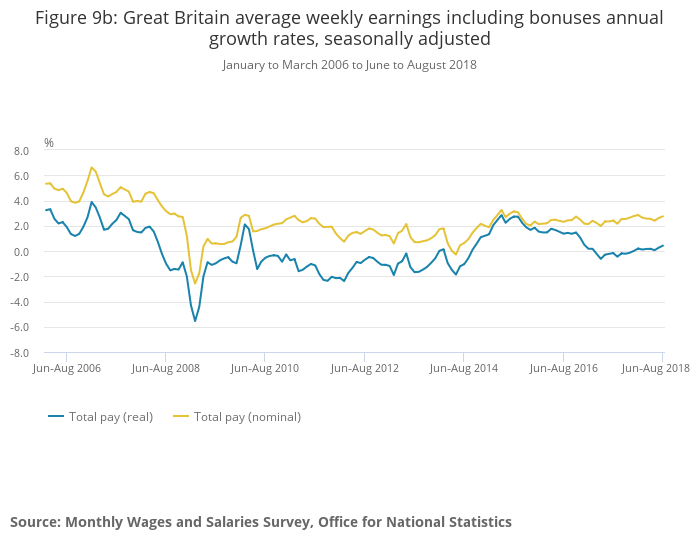
The UK labour market data this morning provided some positive news among the constant flow of tedious rhetoric regarding to the stalled Brexit negotiations. Despite the low growth environment the country finds itself in due to the uncertainty around the negotiations, unemployment remained at a 43-year low in August while wage growth exceeded expectations, rising 2.7% or 3.1% when bonuses are stripped out.
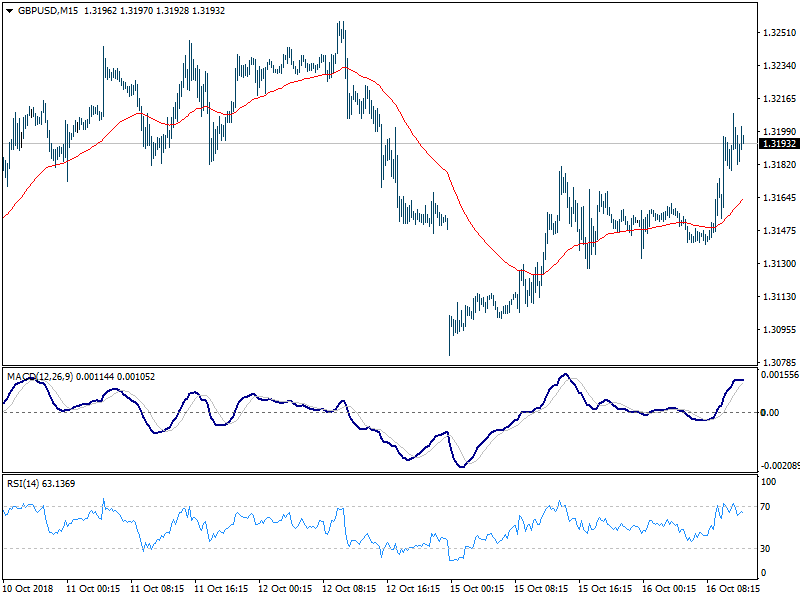
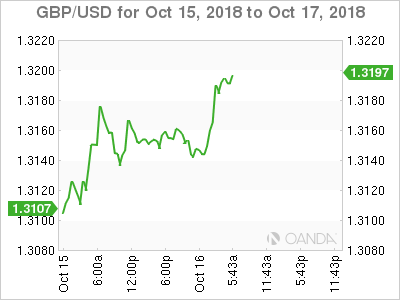
Real wage growth has been among the greatest casualties so far of the referendum result, having fallen in large part due to the currency impact on inflation. While we have edged back into positive territory this year, the increases are tiny which makes even a small beat today something to celebrate. The pound rallied following the data, breaking 1.32 against the dollar before paring gains.
EURUSD Outlook: Downbeat ZEW Data Softened Near-Term Tone
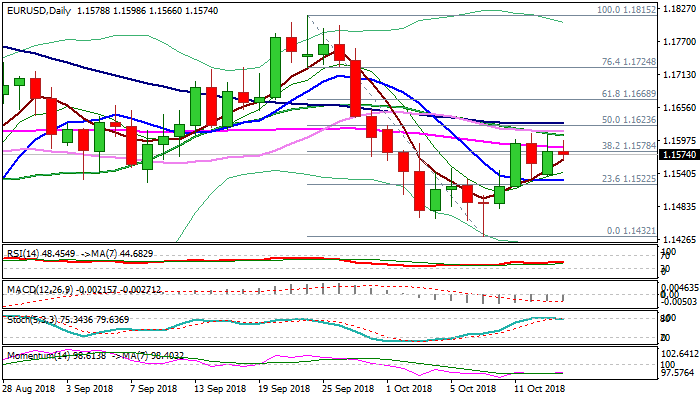
The Euro eased and probed through daily cloud top (1.1570) after disappointing ZEW data.
German economic sentiment weakened on fall well below expectations as Oct release at -24.7 (the lowest since July) strongly undershot forecast at -12.3.
Economic outlook for the European biggest economy was affected by rising concerns about failure of Brexit talks and escalating trade conflict between the US and China.
The Euro’s near-term action showed multiple upside rejections at 1.16 zone, despite weaker dollar, which increases risk of further losses, as downbeat data and recent election losses of German leading coalition, continue to weigh.
Adding to negative signals is reversal of daily slow stochastic from overbought zone, flat momentum, deeply in negative territory and daily MA’s (20/30/55) in bearish setup and capping upside attempts.
Return and close in the daily cloud would generate further negative signal and make the downside more vulnerable, with close below cloud needed to confirm bearish stance.
Alternative scenario requires sustained break above plethora of MA’s (1.1585/1.1627) to neutralize bearish threats and shift focus higher.
Res: 1.1585, 1.1606, 1.1627, 1.1668
Sup: 1.1566, 1.1545, 1.1531, 1.1518
The Analytical Overview Of The Main Currency Pairs
The EUR/USD currency pair
Technical indicators of the currency pair:
Prev Open: 1.15377
Open: 1.15789
% chg. over the last day: +0.28
Day's range: 1.15701 – 1.15909
52 wk range: 1.0571 – 1.2557
Yesterday, the bullish sentiment was observed on the EUR/USD currency pair. The US dollar was under pressure due to weak retail sales data. At the moment, the EUR/USD quotes are consolidating. The key support and resistance levels are: 1.15700 and 1.16000, respectively. Trading instrument has the potential for further growth. We recommend opening positions from the key levels.
Economic calendar on 16.10.2018:
German ZEW economic sentiment index at 12:00 (GMT+3:00);
JOLTS job openings in the United States at 17:00 (GMT+3:00).
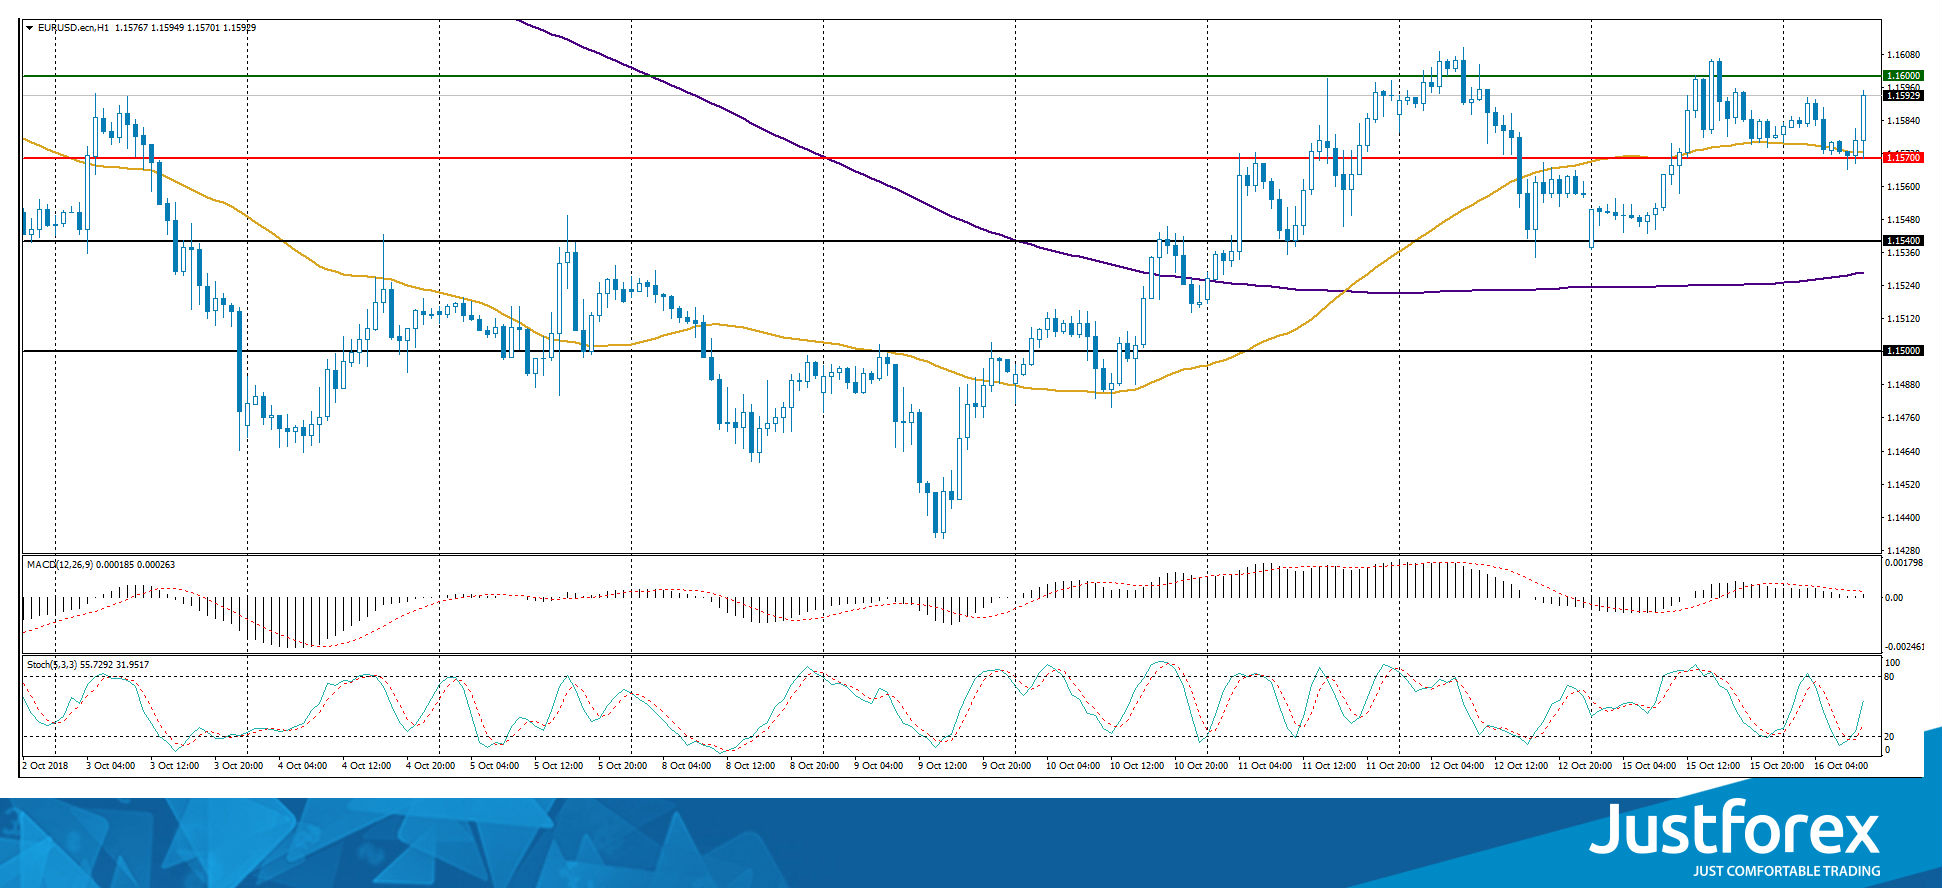
The price has fixed above 50 MA and 200 MA, which indicates the power of buyers.
The MACD histogram is near the 0 mark.
Stochastic Oscillator is in the neutral zone, the %K line is above the %D line, which indicates the bullish sentiment.
Trading recommendations
Support levels: 1.15700, 1.15400, 1.15000
Resistance levels: 1.16000, 1.16400
If the price fixes above the round level of 1.16000, a further increase of the EUR/USD quotes is expected. The movement is tending to 1.16400-1.16600.
An alternative may be a decrease in the EUR/USD currency pair to the level of 1.15400-1.15000.
The GBP/USD currency pair
Technical indicators of the currency pair:
Prev Open: 1.30805
Open: 1.31509
% chg. over the last day: +0.39
Day's range: 1.31543 – 1.31972
52 wk range: 1.2361 – 1.4345
The British pound is still under pressure after it became known that the UK and the EU could not reach an agreement on Brexit. At the moment, the GBP/USD currency pair has recovered most of the losses. Key support and resistance levels are: 1.31500 and 1.32000, respectively. Investors expect new information regarding the Brexit process. Positions should be opened from the key levels.
Economic calendar on 16.10.2018:
Report on the labor market in the UK at 11:30 (GMT+3:00).
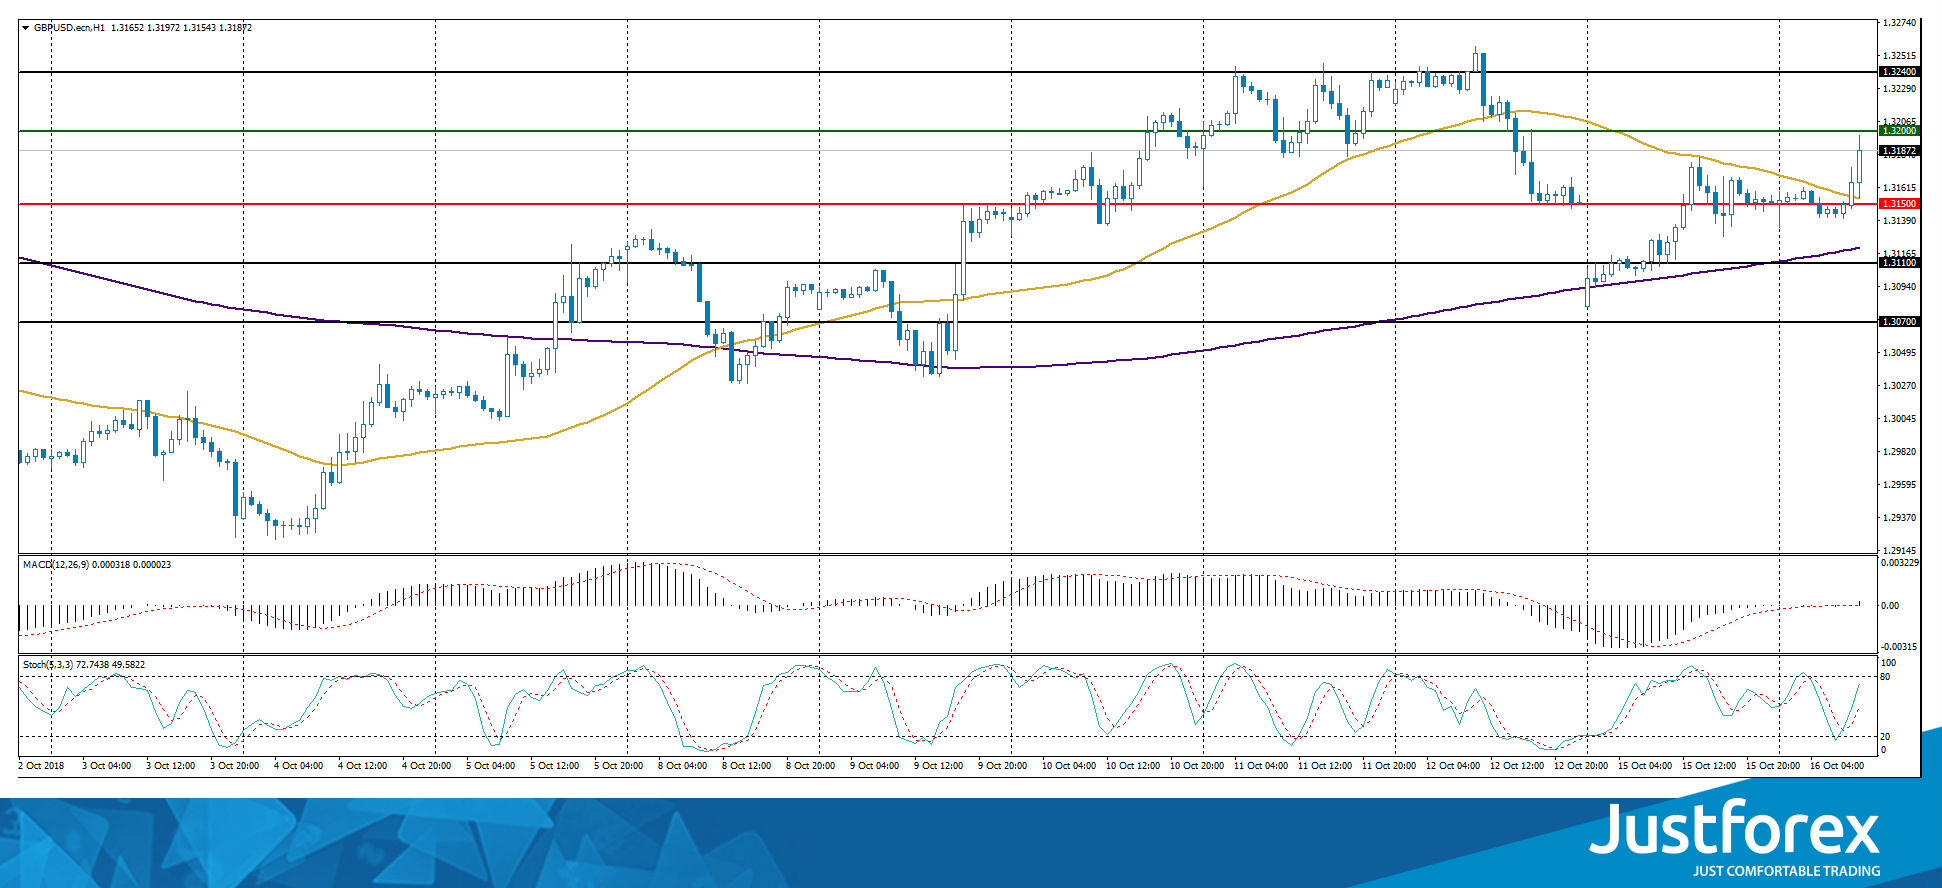
The price has fixed above 50 MA and 200 MA, which indicates the power of buyers.
The MACD histogram is near the 0 mark. There are no signals at the moment.
Stochastic oscillator is in the neutral zone, the %K line is above the %D line, which indicates the bullish sentiment.
Trading recommendations
Support levels: 1.31500, 1.31100, 1.30700
Resistance levels: 1.32000, 1.32400
If the price fixed above the resistance level of 1.32000, the further growth of the GBP/USD quotes is expected. The movement is tending to 1.32400-1.32600.
An alternative may be the decrease of the GBP/USD currency pair to the level of 1.31100-1.30700.
The USD/CAD currency pair
Technical indicators of the currency pair:
Prev Open: 1.30147
Open: 1.29915
% chg. over the last day: -0.22
Day's range: 1.29805 – 1.29969
52 wk range: 1.2059 – 1.3795
Yesterday, aggressive sales were observed on the USD/CAD currency pair. Trading instrument has updated local lows. At the moment, quotes are consolidating. The technical pattern is ambiguous. Local support and resistance levels are: 1.29700 and 1.30000, respectively. Positions should be opened from these marks. The USD/CAD currency pair has the potential for further correction.
The news feed on the economy of Canada is calm.
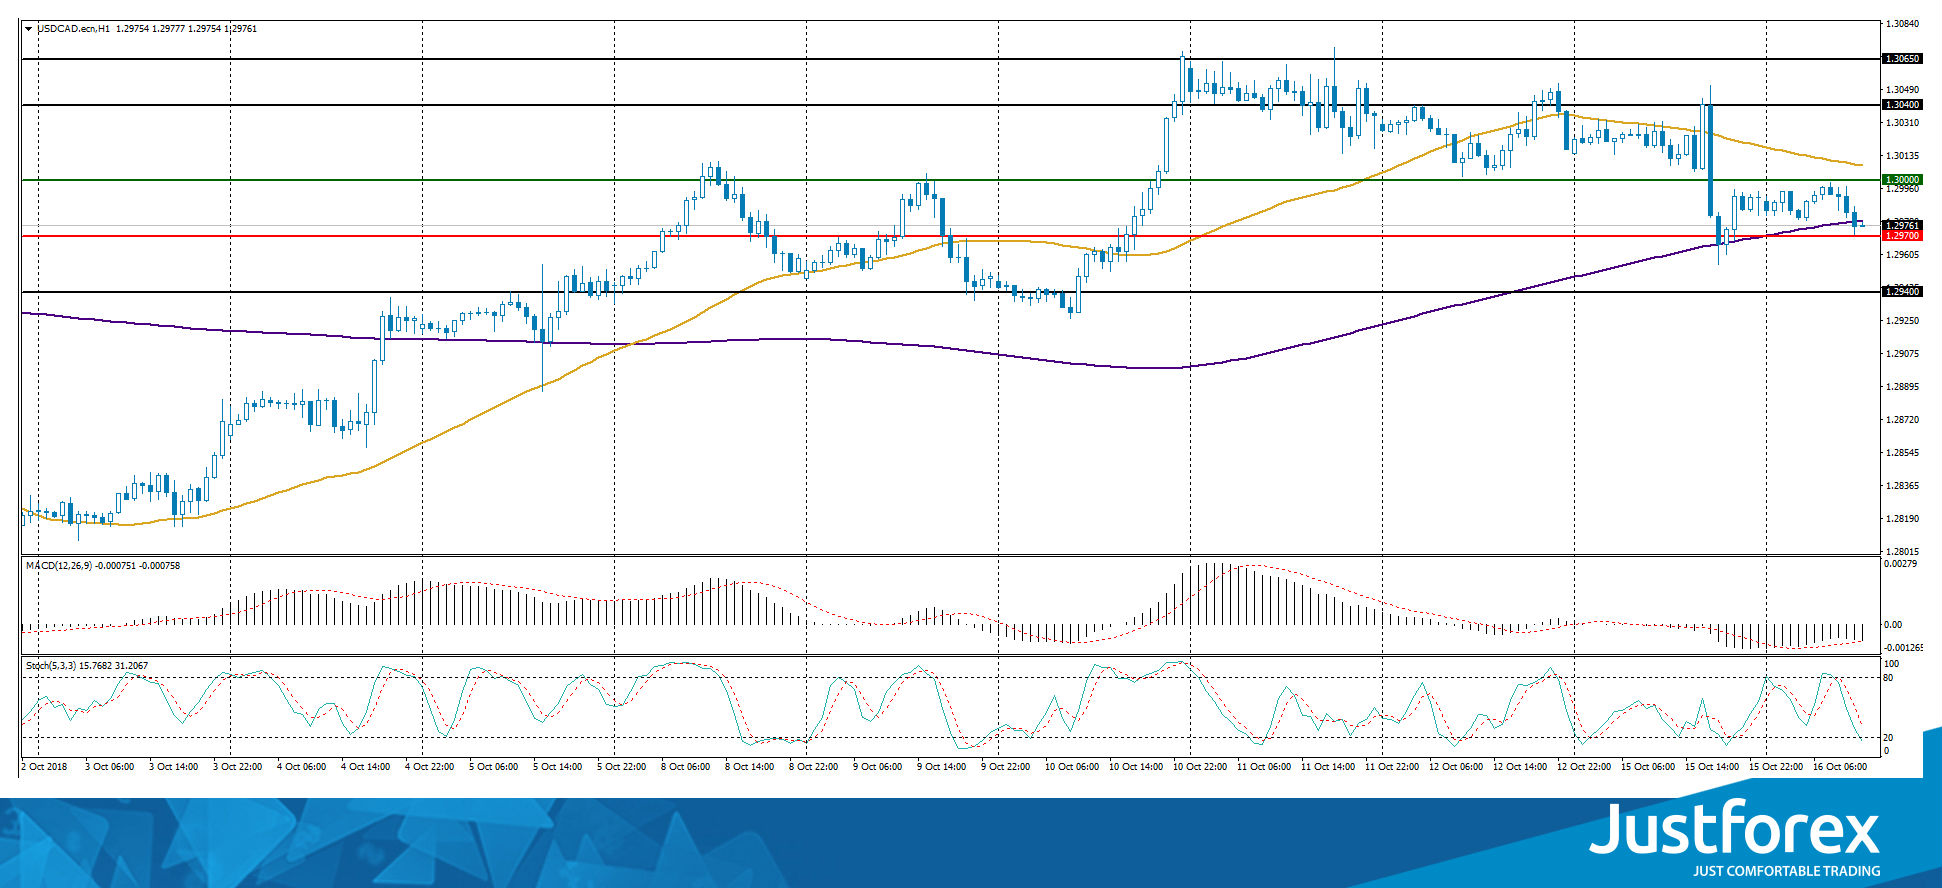
Indicators do not send accurate signals: the price is located between 50 MA and 200 MA.
The MACD histogram is in the negative zone, but above the signal line, which gives a weak signal to sell USD/CAD.
Stochastic Oscillator is in the neutral zone, the %K line is below the %D line, which indicates the bearish sentiment.
Trading recommendations
Support levels: 1.29700, 1.29400
Resistance levels: 1.30000, 1.30400, 1.30650
If the price fixes below the support of 1.29700, it is necessary to look for entry points to the market to open short positions. The target movement level is 1.29400-1.29200.
Alternative option. If the price fixes above the round level of 1.30000, the growth of the USD/CAD quotes is expected. The movement is tending to 1.30400-1.30600.
The USD/JPY currency pair
Technical indicators of the currency pair:
Prev Open: 112.131
Open: 111.767
% chg. over the last day: -0.33
Day's range: 112.089 – 112.129
52 wk range: 104.56 – 114.74
Since the beginning of this week, trades on the USD/JPY currency pair have been rather active. At the same time, a unidirectional trend is not observed. At the moment, the local support and resistance levels are: 111.900 and 112.250, respectively. Positions should be opened from these marks. Trading instrument is tending to recover.
Publication of important economic reports from Japan is not planned.
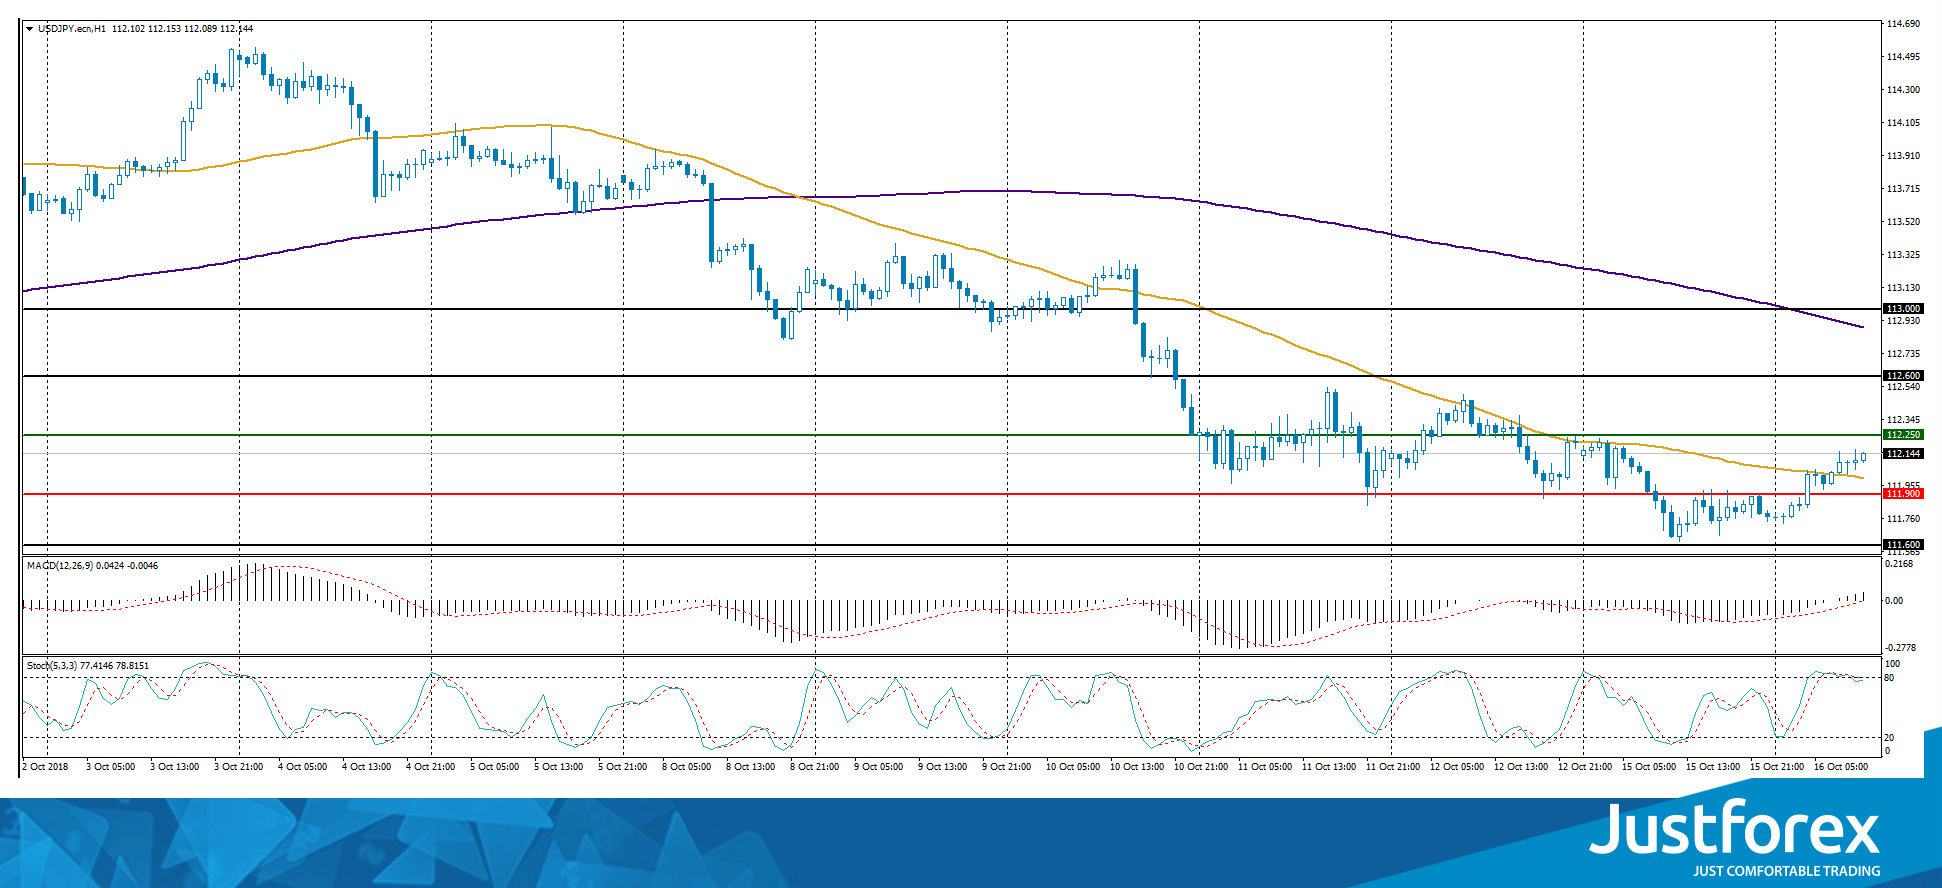
Indicators do not send accurate signals: the USD/JPY quotes have fixed between 50 MA and 200 MA.
The MACD histogram has moved into the positive zone, which indicates the bullish sentiment.
The Stochastic Oscillator is near the overbought zone, the %K line is crossing the %D line. There are no accurate signals.
Trading recommendations
Support levels: 111.900, 111.600
Resistance levels: 112.250, 112.600, 113.000
If the price fixes above the resistance level of 112.250, the USD/JPY quotes growth is expected. The movement is tending to 112.600-112.800.
Alternative option. If the price fixes below 111.900, we recommend looking for entry points to the market to open short positions. The target movement level is 111.600-111.400.
Sterling jumps after stronger than expected wage growth, upside limited
UK unemployment rate was unchanged at 4.0% in August, matched expectations. Wage growth, on the other hand, is an upside surprise. Average weekly earnings including bonus rose 3.7% 3moy in August, above expectation of 2.4% 3moy. Average weekly earnings excluding bonus rose 3.1% 3moy, above expectation of 2.8% 3moy. In September, claimant counts rose 18.5k, above expectation of 4.5k. Full release here.
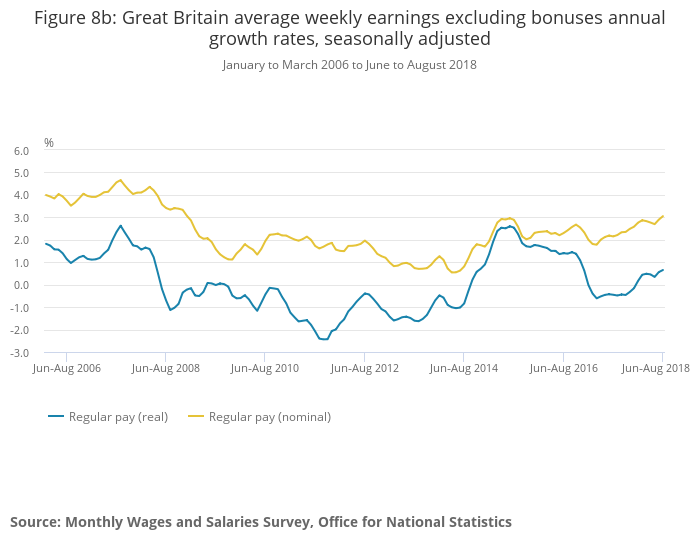
GBP/USD edged higher after the release. But upside is limited so far..
The Buck Cannot Find A Bid
Tuesday October 16: Five things the markets are talking about
The ‘big’ dollar came under pressure yesterday and is finding it difficult to gain much traction this morning as investors taking profit on U.S assets outweighs concerns about Italy, Brexit and a Sino-U.S trade war. Furthermore, twin U.S deficits and prospects of a halt in Fed’s rate hike cycle are also weighing on the dollar.
Elsewhere, it has been mixed picture across regional stock markets overnight as investors await the next wave of corporate earnings and further developments across the aforementioned geopolitical issues.
Note: Any hint of a slowdown or stronger growth could affect the pace of Fed’s rate hikes.
Oil prices continue to fluctuate within striking distance of recent highs amid tensions between Saudi Arabia and the U.S over the disappearance of Jamal Khashoggi, a prominent journalist with U.S citizenship, while the precious ‘yellow’ metal holds its gains.
On tap: FOMC minutes are due Wednesday (02:00 pm EDT), with investors focused on projections for further interest rate rises.
1. Stocks mixed results
In Japan, the Nikkei rebounded overnight, supported by short covering in index heavyweights (automakers and SoftBank), but retailers came under pressure on worries about domestic personal consumption and slowing demand from China. The Nikkei share average closed +1.3% higher, after tumbling -1.8% yesterday. The broader Topix rallied +0.7%.
Down-under, Aussie shares rebounded overnight, as mining and financials bounced back from Monday’s -1% drop and six-month low, but rising tensions between Saudi Arabia and the West and weaker PPI data in China capped broader market gains. The S&P/ASX 200 index rose +0.6%. In S. Korea, the Kospi stock index closed flat on Tuesday as global uncertainties capped gains during the day.
In China, stocks ended lower overnight, after data showed factory-gate inflation had cooled for a third consecutive month in September amid lean domestic demand. The blue-chip CSI300 index ended -0.8% weaker, while the Shanghai Composite Index also closed -0.8% lower. In Hong Kong, the Hang Seng was up +0.1%.
Note: Chinese inflation was boosted by food while prices were mostly subdued elsewhere. China Sept CPI y/y came in as expected at +2.5% vs. +2.5%e (a seven-month high): PPI y/y was +3.6% vs. +3.5%e.
In Europe, regional bourses trade mostly higher across the board with the Italian FTSE MIB outperforming following the submission of its draft budget to the E.C, while the U.K’s FTSE underperforms on Brexit uncertainty.
U.S stocks are set to open in the ‘black’ (+0.3%).
Indices: Stoxx600 +0.4% at 361, FTSE -0.2% at 7012, DAX +0.2% at 11638, CAC-40 +0.1% at 5099, IBEX-35 +0.9% at 9004, FTSE MIB +1.1% at 19500, SMI +0.3% at 8678, S&P 500 Futures +0.3%
2. Oil dips on expectations of higher U.S stocks, gold unchanged
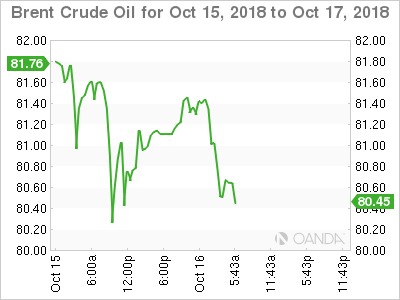
Oil prices have eased a tad amid expectations of an increase in U.S crude inventories, but signs of a fall in Iranian oil exports for October are limiting losses.
Brent crude for December delivery has fallen -6c, or -0.07%, to +$80.72 per barrel, while U.S West Texas Intermediate (WTI) crude for November delivery is down -14c at +$71.64 a barrel.
U.S crude stockpiles are forecasted to have risen last week for the fourth consecutive week, by about +1.1M barrels, ahead of reports from the API (data is due at 4:30 pm today) and the U.S DoE’s EIA (will be released at 10:30 am EDT tomorrow).
In the first two weeks of October, Iran has exported +1.33M bpd of crude to countries including India, China and Turkey. That is down from +1.6M bpd during the same period in September.
Note: October exports are a sharp drop from the +2.5M bpd in April before President Trump withdrew from a multilateral nuclear deal with Iran. In May Trump ordered the re-imposition of economic sanctions on the country. The sanctions will come into force on Nov. 4.
Also supporting prices is today’s comments from OPEC’s Secretary General Barkindo who said, “global spare oil capacity was shrinking,” adding “producers and companies should increase their production capacities and invest more to meet current demand.”
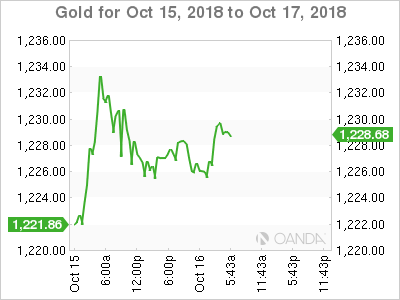
Ahead of the U.S open, gold prices are holding steady near yesterday’s three-month high as a number of risk-averse investors seek refuge in the metal amid rising political tensions and economic uncertainty.
Spot gold was little changed at +$1,226.71 an ounce – it touched +$1,233.26 yesterday, its highest print since mid July, as global equities slid on rising tensions between the Saudi’s and the West. U.S gold futures are flat at +$1,230.40 an ounce.
3. German Bund yields edge higher
A cautious, risk-on mood currently prevails in eurozone sovereign bond markets so far this morning, with yields of German Bunds and of other core eurozone bonds up, and Italian bond yields down.
This would suggest that market risk sentiment may be improving following last week’s sudden correction, but the balance remains a tad precarious in the current political environment. German 10-year Bund yield has backed up +1.4 bps to +0.51%.
Note: The +0.50% level in Bund yields remains pivotal and with more debt product coming to market today (Germany offers +€4B in the September 2020-dated Schatz) should be able to back up sovereign yields a tad more.
Elsewhere, the yield on 10-year Treasuries has backed up +1 bps to +3.17%, the highest in a week. In the U.K, the 10-year Gilt yield has decreased -1 bps to +1.603%, the lowest in almost two-weeks, while in Italy, the 10-year BTP yield has declined -2 bps to +3.522%.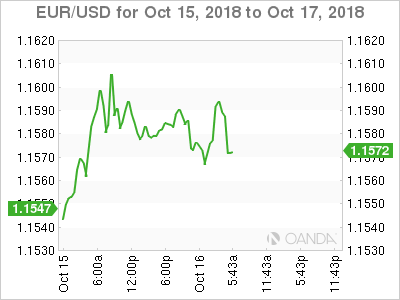
4. G7 currency pairs are little changed
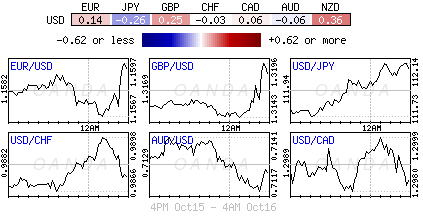
Major currencies (€, £, ¥ and C$) are relatively unchanged ahead of the U.S open.
Dealers and investors have little technical or fundamental data to work with at current levels. In fact, the market is looking for guidance, which may come in the shape of the U.S Treasury forex report, which is likely to be released this week and where the U.S could name China a currency manipulator.
If the U.S were to name China a currency manipulator it would further pressure China on trade and add to the Sino-U.S trade tensions.
EUR/USD is flat at €1.1579 and other major currency pairs are not moving by much either. GBP/USD is up slightly at £1.3163 as leaders struck a conciliatory tone a day after Brexit negotiations broke down and USD/JPY is up +0.3% at ¥112.07
Elsewhere, the performance of several petro-forex (NOK, CAD, RUB) has been held back due to various unique factors that have not translated into a growth boost for these currencies. The ruble has been driven by U.S sanctions, and the Canadian dollar has been held back by NAFTA re-negotiations.
TRY (-0.20% at $5.7865) has retreated after seven days of gains after the country released U.S pastor Andrew Brunson on Friday.
5. U.K wage growth fastest in a decade
U.K data this morning showed that wage growth quickened over the summer at the fastest pace in almost a decade, adding to signs of inflationary pressure.
The ONS said that average weekly earnings in Britain, ex-bonuses, grew +3.1% in the three-months through August.
The figures will likely reinforce market expectations that the BoE remains on course tighten monetary policy over the next 24-months to keep overall price-growth in check, assuming the U.K.’s exit from the E.U goes well.
Other data showed that U.K unemployment in the three-months through August was unchanged on the previous three-months at +4%, while the number of people in work, +32.4M, remained close to its record high.
Note: The BoE hiked interest rate in August and signalled that they expect to do so again two or more times over the next couple of years to bring inflation back to their +2% annual goal.
A weaker pound since the Brexit referendum has to push up the price of imports, squeezing U.K citizens’ purchasing power.
Investors Are Still Hesitant To Reload On Risk
Investors are still hesitant to reload on risk
World equities idled on the first trading of the week as investors continued to have mixed feelings. Half of Europe's markets ended wearing green, while the other half headed lower. In the US, only the Russell 2000 – a small-cap stock index – was able to keep its head above water as it rose 0.41%. The S&P 500 and the Nasdaq were both down, falling 0.59% and 0.88%, respectively. This morning, Asian equities were trading trendless with Japan equities edging higher, while Chinese ones suffered another blow. The Shenzhen Composite fell most as it erased another 1.72%. The CSI 300 was down 0.60%. In Europe, futures are moving back and forth around the neutral threshold.
In the FX market yesterday, disappointing US data weighed on the buck, but only temporarily. Retail sales data for the month of September came in well below expectations. The headline number rose only 0.1%m/m, while market participants were looking for an 0.6% increase. It seems that this unexpected decline is mostly attributable to a sharp contraction in restaurant sales, however, while the control group, which excludes gasoline, auto, building materials and food services, rose 0.5%. Therefore, it is complicated to draw hard conclusion from this report. But note must be taken that retail consumers did decide to cut their spending budgets. This could be an omen for the coming months, especially after such a strong second quarter. The rest of the week will be relatively light in term of hard data with only September's industrial production due later today; housing starts and building permits tomorrow and existing home sales on Friday. On the central bank side, the market will closely look at the September FOMC (Federal Open Market Committee) minutes that will be published tomorrow.
In our opinion, the risk is skewed to the upside for the buck as the uncertainty on this side of the Atlantic is for investors to maintain a long USD bias. Nevertheless, in the longer term, we think that the single currency will resume its rally against the backdrop of a rising US deficit and the increasing costs of servicing debt.
Turkish lira (slowly) gains investors' support
Even after raising interest rates during its MPC (Monetary Policy Committee) on 13 September, the CBRT (Central Bank of Turkey) failed to convince market participants sufficiently. Key issues relating to spreading inflation, shown by the September CPI (Consumer Price Index) at 24.52% on a yearly basis (m/m: +10.88%) and expected to head above 25% by year end, along with the question of the independence of the CBRT, have put constant pressure on the Turkish lira. But the trend appears to be changing.
Indeed, after the Turkish authorities complied with US demands to release Pastor Andrew Brunson following a court decision last week, the lira has been gaining ground since last Thursday, trading below the 6 range against the greenback and appreciating by 4.75% since then. For now, it appears that investors have finally decided to support the lira, although the forthcoming CBRT MPC meeting of 25 October could turn out differently than expected. Investors are expecting a 300 bps rate hike. If the central bank disappoints, the risk of an extra collapse of the Turkish lira has not disappeared.
Accordingly, it appears that the TRY trend is tending towards further strength, as the Turkish government is working with the US to investigate the case of the missing Saudi Arabian journalist Jamal Khashoggi. The upcoming visit to Turkey by US Secretary of State Mike Pompeo will confirm the easing of tension between both nations, thus giving further relief to the lira.
USD/TRY is trading along 5.79, approaching the 5.74 range.
UK Inflation And Retail Sales Expected To Ease In September, Could Weigh On Pound Amid Brexit Stalemate
After Tuesday’s solid jobs numbers, UK economic releases will continue with inflation data on Wednesday and retail sales figures on Thursday. With all eyes this week locked on the Brexit talks, the data may not attract the usual amount of attention. However, with both inflation and retail sales forecast to moderate in September, the data could add to the pound’s downside risks should UK and EU leaders fail to overcome the latest impasse in the Brexit discussions at this week’s EU summit.
The headline rate of inflation in the UK has been on the up since July, reversing the trend of an easing in inflationary pressures during the first half of the year. Expectations that inflation would struggle to fall towards the Bank of England’s 2% target prompted policymakers to raise interest rates by a quarter of a percentage points in August, despite the uncertain outcome of the Brexit negotiations.
But there may be some good news for the BoE on Wednesday when the CPI report is published at 8:30 GMT, as consensus forecasts are for the 12-month CPI rate to drop to 2.6% in September from 2.7% in August. The core rate is also anticipated to fall, from 2.1% to 2.0%. If confirmed, the figures would ease fears of inflation running wild again.
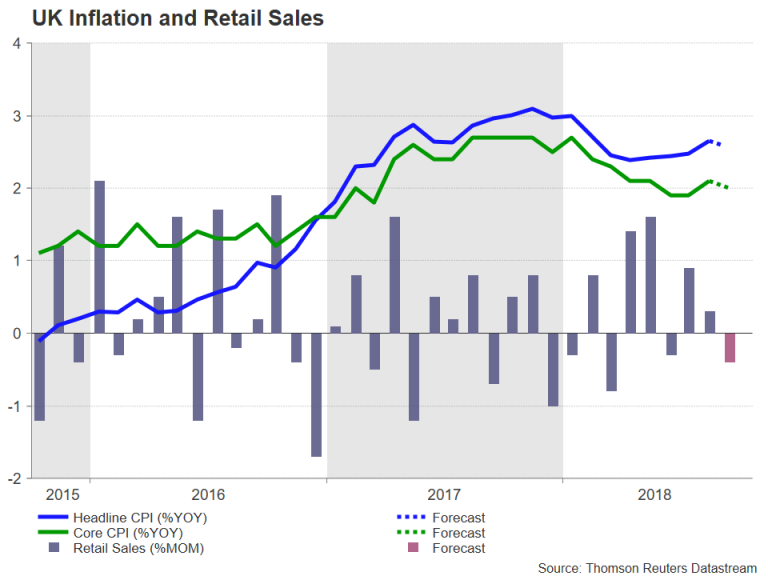
Thursday’s retail sales numbers (due at 8:30 GMT) are also not expected to be particularly positive for the pound. British retail sales growth bounced back strongly in the second quarter of the year following a poor start to 2018. However, the third quarter has been somewhat weaker. Retail sales are forecast to have declined by 0.4% month-on-month in September after a 0.3% increase in the prior month, though the annual rate is projected to have edged up from 3.3% to 3.6%. Core retail sales, which excludes fuel, is also expected to have dropped by 0.4% over the month.
A negative set of data, combined with the absence of a breakthrough in the Brexit talks, could send sterling sharply lower. Cable is currently hovering just below the psychological 1.32 level and failure to reclaim the handle would bring into view the 23.6% Fibonacci retracement level of the upleg from 1.2660 to 1.3297, at 1.3147. A pull below this support would lead the way towards the 38.2% Fibonacci level at 1.3054. Deeper losses would bring the pair within range of the key 50% Fibonacci level of 1.2979. A breach of the 50% Fibonacci would turn the focus for pound/dollar back to the downside and threaten a new low below the October trough of 1.2919.
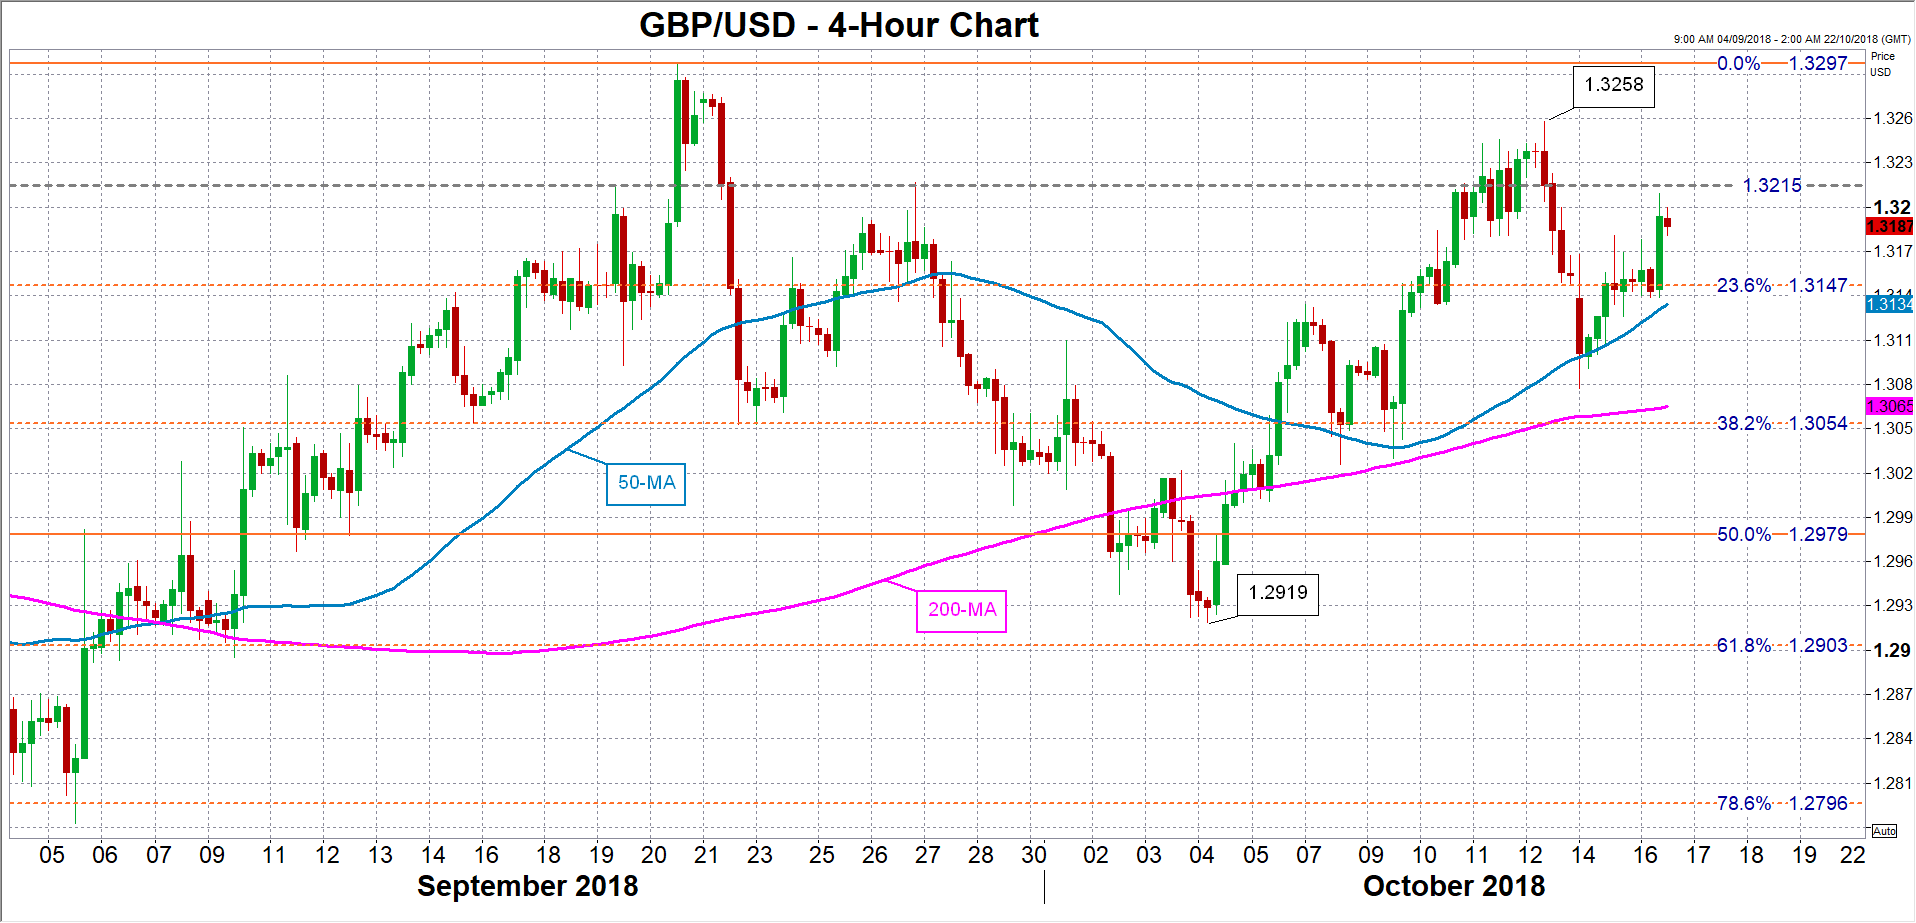
Weaker-than-expected figures would not matter much for investors, however, in the unlikely event that the UK and the EU strike a surprise early deal at the October 17-19 summit. Alternatively, a beat in the inflation and retail sales numbers would provide support for sterling if there is no deal. But if there is a Brexit agreement, positive data would only fuel any rally in the pound.
Cable could break above immediate resistance around 1.3215 in such a scenario to make a run towards the October 12 high of 1.3258. A push higher would send the pair towards the September top of 1.3297, which if broken, would signal a possible shift to a more bullish phase in the medium term.
BTCUSD Escapes Two-Month Lows, Looks Positive To Neutral In Short-Term
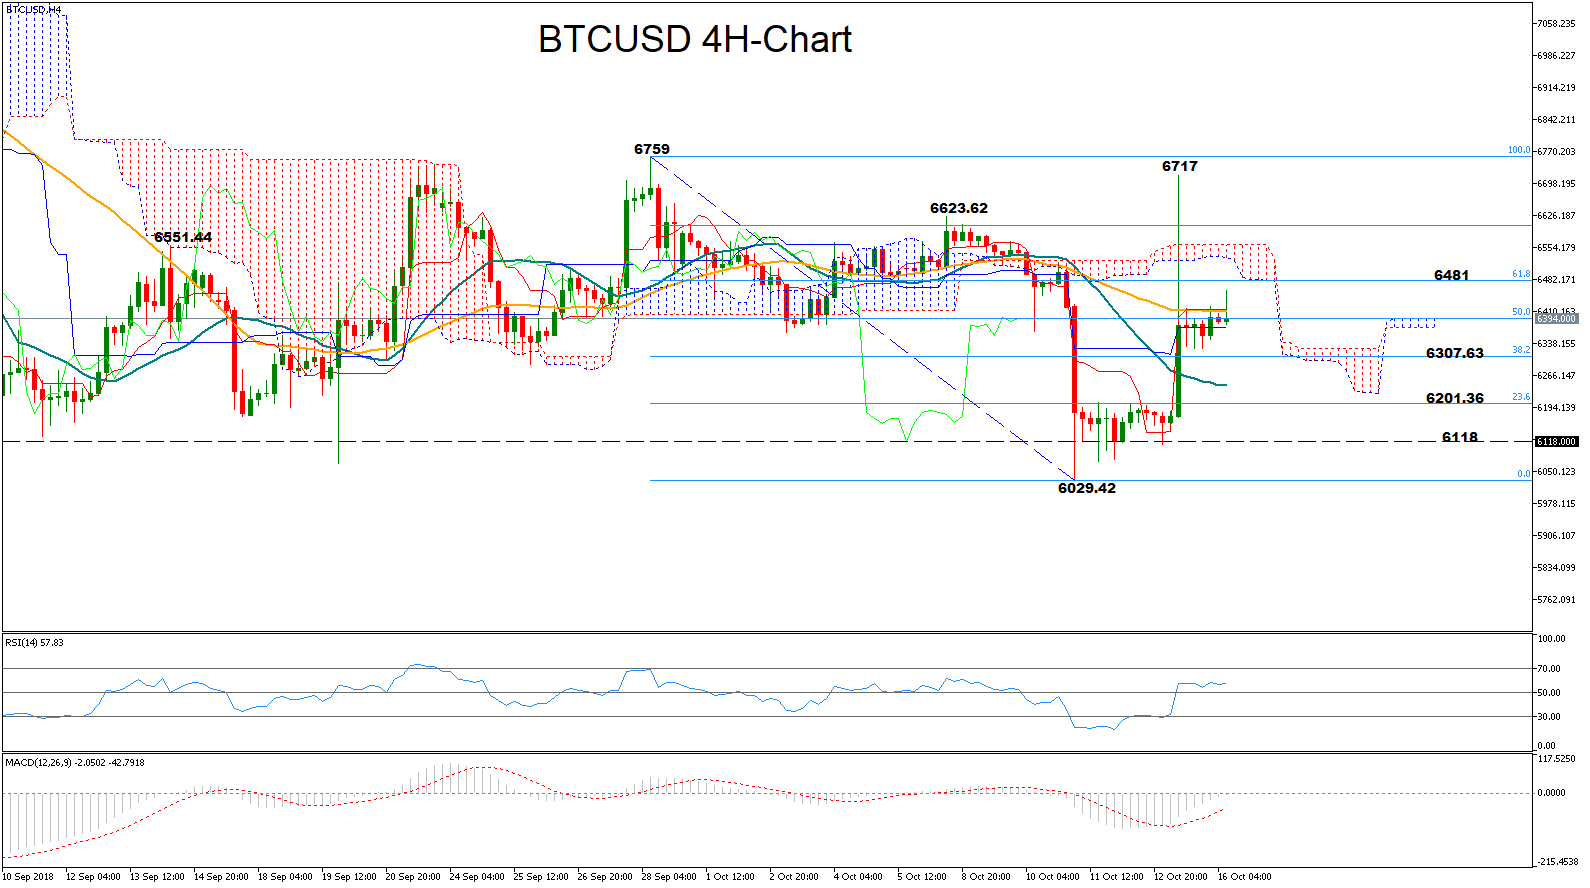
After a deep fall towards the two-month low of 6029.42 last Thursday, BTCUSD managed to show a recovery only on Monday, posting a spectacular rally to climb as high as 6717, the highest since September 28. The market could see further improvement as the RSI fluctuates in bullish territory above 50 and the MACD strengthens to the upside and above its red signal line, though consolidation cannot be ruled out as the former holds around its 50 neutral mark and the latter stands around zero.
On the upside, the price may pause around the 61.8% Fibonacci of the downleg from 6759 to 6029.42, near 6481. The bottom of the Ichimoku cloud is also located close to this area giving some importance to this resistance. Moving higher the 6551.44- 6623.62 zone marked by the peaks on September 14 and October 10 may come under the radar before bullish actions pick up steam towards yesterday’s top of 6717. Should bulls overcome the 6759 level, positive momentum could pick up speed.
On the flip side, if bearish forces dominate, the price could fall until the 38.2% Fibonacci of 6307.63, which provided some resistance back in September. Lower than that, attention would immediately shift to the 23.6% Fibonacci of 6201.36 where the price stalled the past couple of days. If that proves a weak obstacle too, support could be next found between 6118 and 6029.42.
WTI Crude Futures Touch Rising Trend Line, Outlook Remains Bullish
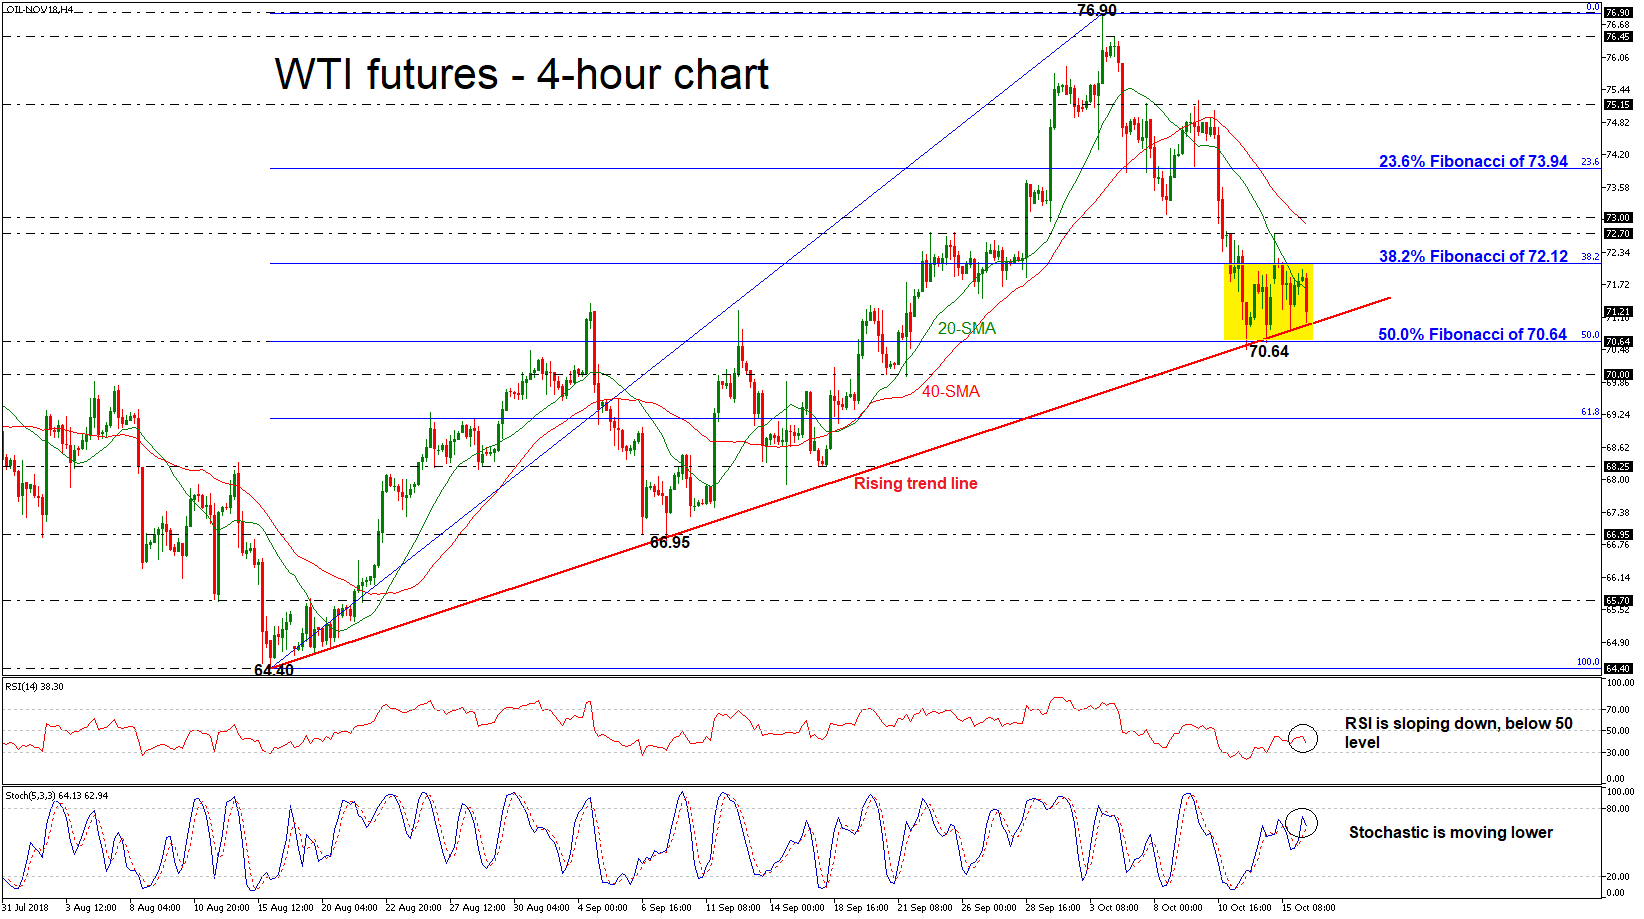
WTI crude oil futures tumbled lower over the last couple of sessions, reaching again the short-term ascending trend line in the 4-hour chart. Also, oil prices dropped below the 20-simple moving average (SMA), while the technical indicators are confirming the recent negative structure in the near-term. The RSI indicator is pointing south in the negative zone and the stochastic oscillator is ready for a bearish cross within the %K and %D lines.
Should the price manage to strengthen its negative momentum and post a significant leg below the uptrend line, the next support could come from the 50.0% Fibonacci retracement level of the upleg from 64.40 to 76.90, around 70.64. A break below this area would shift the bias to a more neutral one and open the way towards the 70.00 handle. Below this level, the next target could come from the 61.8% Fibonacci mark of 69.17.
On the flip side, if prices rebound on the rising trend line, confirming the short- to medium-term bullish bias, the 38.2% Fibonacci of 72.12 could come in focus again. Further advances could drive oil until the 72.70 – 73.00 area, which encapsulates the 40-SMA. The next key resistance to watch higher is the 23.6% Fibonacci of 73.94.
To summarize, WTI crude looks neutral to bearish in the very short-term, while in the longer-term picture, it has been strongly positive since January 2016.