Sample Category Title
Trade Idea: GBP/JPY – Stand aside
GBP/JPY - 149.00
New strategy :
Stand aside
Position: -
Target: -
Stop:-
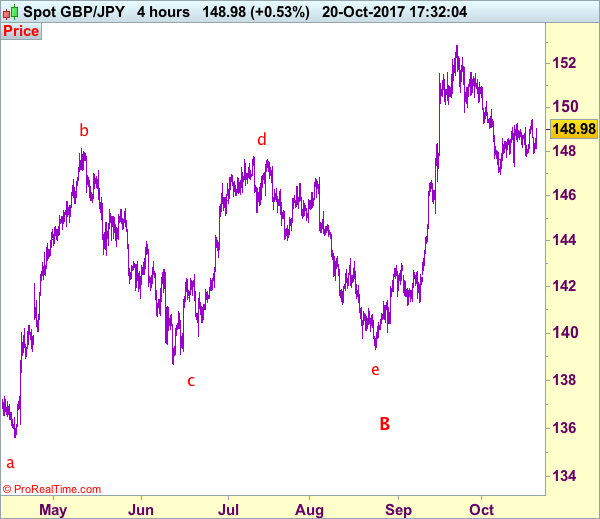
Despite retreating to 147.95, as sterling has rebounded again after holding above previous support at 147.80, retaining our view that further choppy consolidation would be seen and test of resistance at 149.40 cannot be ruled out, break there would signal the erratic rise from 146.95 is still in progress for retracement of the fall from 152.85 to 149.90-00 and possibly test of resistance at 150.25 but still reckon upside would be limited to 150.90-00 and bring another decline later.
On the downside, only a break below said support at 147.80 would shift risk to downside and signal the rebound from 146.95 has ended, bring weakness to another previous support at 147.30, below would confirm and then retest of 146.95 would follow. Looking ahead, once this level is penetrated, this would confirm the fall from 152.85 top has resumed for retracement of recent upmove to 146.60-65 and then 146.00, having said that, loss of momentum should limit downside and previous support at 145.25 should remain intact.
Our preferred count is that larger degree wave V with circle is unfolding from 251.12 with wave (I) 219.34, (II): 241.38 and wave (III) is subdivided into 1: 192.60, 2: 215.89 (23 Jul 2008) and wave 3 ended at 118.87 earlier in 2009. The correction from there to 162.60 is wave 4 which itself is a double three and is labeled as first a-b-c ended at 151.53, followed by wave x at 139.03, 2nd a ended at 162.60, 2nd b at 146.75 and 2nd c leg of wave 4 ended at 163.00. Therefore, the decline from 163.00 to 116.85 is now treated as wave 5 which also marked the end of larger degree wave (III), hence wave (IV) major correction has commenced for retracement of the wave (III) from 241.38 and upside target at 183.95-00 (50% Fibonacci retracement of the wave (II) from 241.38) had been met, a drop below 160.00 would suggest wave (IV) has ended at 195.85, bring decline in wave (V) for initial weakness to 130 (already met) and 120.
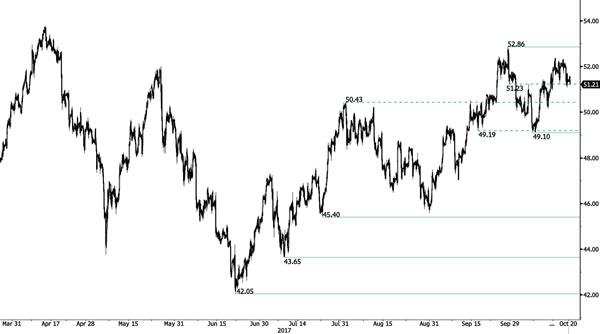
CRUDE OIL Resting On 51.23 Support
Crude oil is consolidating in range defined by the support at 50.43 and the strong resistance lies at 52.86 (28/09/2017). Expected to show continued increase within this range.
In the long-term, crude oil has recovered after its sharp decline last year. However, we consider that further weakness are very likely. For the time being the pair lies in an upside momentum. Strong support lies at 35.24 (05/04/2016) while resistance can now be found at 55.24 (03/01/2017 high).
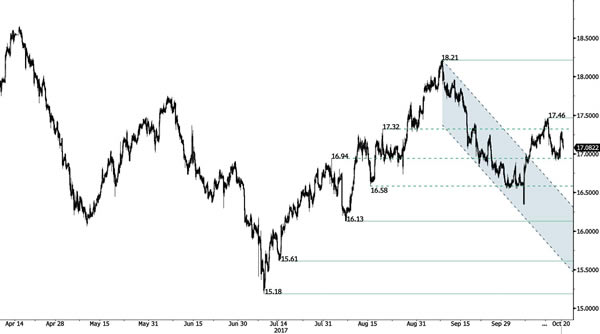
SILVER Reversal Ahead Of Resistance
Silver is again weakening and is now resting on support at 16.94. Hourly resistance is given at 17.46 (13/10/2017 high). Additional support can be found at 16.13 (06/10/2017 low). Hourly resistance can be found at 17.10 (intraday high).
In the long-term, the trend is rater negative. Further downsides are very likely. Resistance is located at 25.11 (28/08/2013 high). Strong support can be found at 11.75 (20/04/2009).
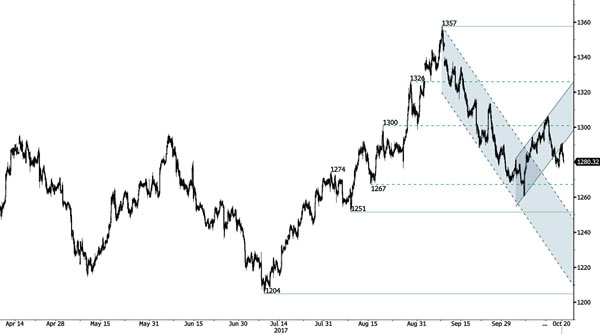
GOLD Fading Bullish Momentum
Gold has broken the support at 1284 confirming an underlying bearish trend. Strong support lies at a distance at 1204 (10/07/2017 high). Resistance is located at 1288 (intraday high).
In the long-term, the technical structure suggests that there is a growing upside momentum. A break of 1392 (17/03/2014) is necessary ton confirm it, A major support can be found at 1045 (05/02/2010 low).
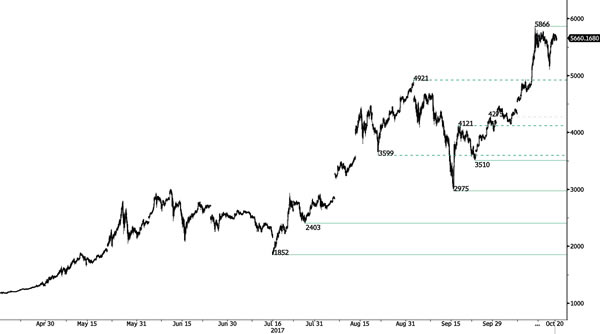
BITCOIN Consolidating
Bitcoin has bounced strongly suggesting a near term test of 5866 (all-time high). Strong support stands very far at 2975 (22/08/2017 low). Bitcoin si ready to set up new all-time high. The road is wide open for further increase. In the short-term, the digital currency should monitor $6000.
In the long-term, the digital currency has had an exponential growth. There are decent likelihood that the asset will reach $10'000.
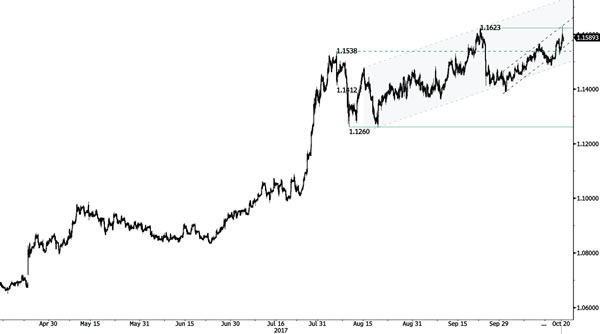
EUR/CHF Sharp Spike But Resistance Holds
EUR/CHF recovery bounce continues testing 1.1623 (15/09/2017 high). Support is given at 1.1388 (02/09/2017 low).
In the longer term, the technical structure has reversed. Strong resistance is given at 1.20 (level before the unpeg). Yet, the ECB's QE programme is likely to cause persistent selling pressures on the euro, which should weigh on EUR/CHF. Supports can be found at 1.0184 (28/01/2015 low) and 1.0082 (27/01/2015 low).
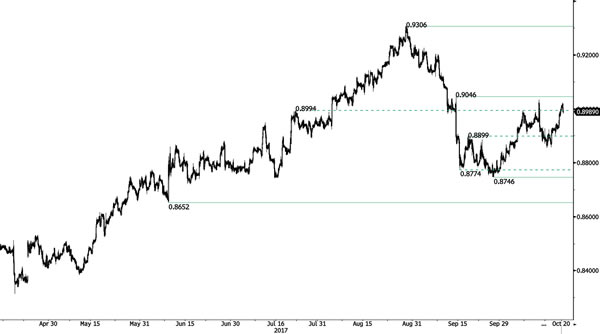
EUR/GBP Strong Recovery
EUR/GBP continues to bounce higher yet not important resistances have been broken. The pair is back below former resistance at 0.8899 (19/09/2017 low). Hourly support is given at a distance at 0.8746 (27/09/2017 low).
In the long-term, the pair has largely recovered from recent lows in 2015. The technical structure suggests a growing upside momentum. The pair is trading above from its 200 DMA. Strong resistance can be found at 0.9500 (psychological level).
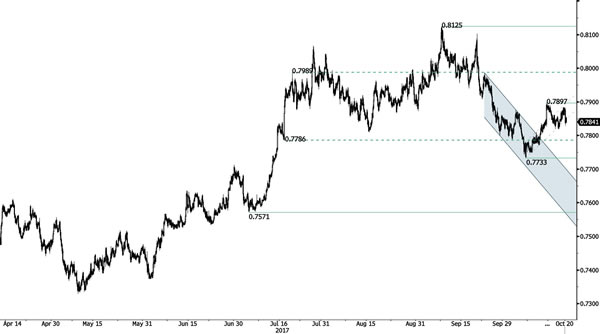
AUD/USD Rangebound
AUD/USD is trading sideways between resistance at 0.7897 and support at 0.7821. Hourly resistance is given at 0.7897 (13/10/2017 high). Support lies at at 0.7786 then 0.7733 (06/10/2017 low). Expected to show continued consolidation.
In the long-term, the trend is turning positive. Key supports stands at 0.6009 (31/10/2008 low) . A break of the key resistance at 0.8164 (14/05/2015 high) is needed to invalidate our long-term bearish view.
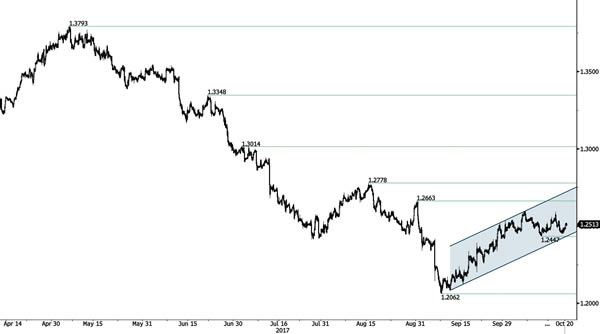
USD/CAD Drifting Higher
USD/CAD continues to bounce within uptrend channel. Strong support is located at a distance at 1.2062 (08/09/2017 low). Hourly support lies at 1.2331 (26/09/2017 high). Resistance is given at 1.2663 (31/08/2017 high). Expected to show continued short-term bullish pressures within uptrend channel.
In the longer term, the pair has broken longterm support that can be found at 1.2461 (16/03/2015 low). Strong resistance is given at 1.4690 (22/01/2016 high). The pair is likely to head further lower.
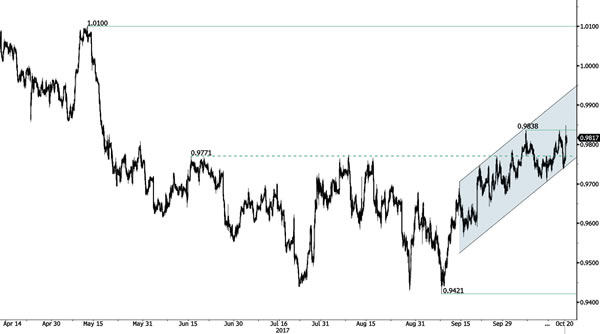
USD/CHF Strong Recovery Bounce
USD/CHF has broken resistance at 0.9838. Hourly support stands at 0.9712 (12/10/2017 low). The technical structure suggests an improving short-term buying interest. Expected to show continued bullish pressures within uptrend channel.
In the long-term, the pair is still trading in range since 2011 despite some turmoil when the SNB unpegged the CHF. Key support can be found 0.8986 (30/01/2015 low). The technical structure favours nonetheless a long term bullish bias since the unpeg in January 2015.