Sample Category Title
USD/CHF Pushing Lower, USD/CAD Sideways Price Action, AUD/USD Weakening.
USD/CHF Pushing lower.
USD/CHF is pushing lower. Hourly resistance can be found at 0.9771 (09/06/2017 high). Strong resistance is given at 1.0107 (10/04/2017 high). Hourly support is given at 0.9553 (30/06/2017 low). Expected to show continued bearish pressures.
In the long-term, the pair is still trading in range since 2011 despite some turmoil when the SNB unpegged the CHF. Key support can be found 0.8986 (30/01/2015 low). The technical structure favours nonetheless a long term bullish bias since the unpeg in January 2015.
USD/CAD Sideways price action.
USD/CAD is moving sideways. Support given at 1.2913 (04/07/2017 low). Resistance is located at 1.3014 (02/15/2017). Expected to show continued downside pressures.
In the longer term, the pair lies in a bullish channel since a year. Strong resistance is given at 1.4690 (22/01/2016 high). Long-term support can be found at 1.2461 (16/03/2015 low).
AUD/USD Weakening.
AUD/USD's technical structure is bullish since early May despite ongoing bearish move. The pair should further head back towards resistance at 0.7712 (30/06/2017 high). However, a break of support at 0.7520 (09/06/2017 low) would nonetheless indicate a deeper bearish trend.
In the long-term, we are waiting for further signs that the current downtrend is ending. Key supports stand at 0.6009 (31/10/2008 low) . A break of the key resistance at 0.8295 (15/01/2015 high) is needed to invalidate our long-term bearish view.
EUR/USD Back To Bullish, GBP/USD Short-Term Selling Pressures, USD/JPY Riding Within Symmetrical Triangle.
EUR/USD Back to bullish.
EUR/USD is back to bullish and should target resistance at 1.1445 (29/06/2017 high). Hourly support can be found at 1.1292 (28/06/2017 low). Stronger support lies at 1.1076 (18/05/2017 low).
In the longer term, the momentum is clearly negative. We favour a continued bearish bias towards parity. Key resistance holds at 1.1714 (24/08/2015 high) while strong support lies at 1.0341 (03/01/2017 low).
GBP/USD Short-term selling pressures.
GBP/USD is still lower. The pair failed to monitor resistance given at 1.3046 (18/05/2017 high). The road is wide-open for further weakness.
The long-term technical pattern is even more negative since the Brexit vote has paved the way for further decline. Long-term support given at 1.0520 (01/03/85) represents a decent target. Long-term resistance is given at 1.5018 (24/06/2015) and would indicate a long-term reversal in the negative trend. Yet, it is very unlikely at the moment.
USD/JPY Riding within symmetrical triangle.
USD/JPY is riding within symmetrical triangle towards resistance given at 114.37 (10/05/2017 high). Hourly support can be found at 112.83 (05/07/2017 low). Stronger support is located at 108.13 (17/04/2017 low). Expected to show continued bullish pressures within symmetrical triangle.
We favor a long-term bearish bias. Support is now given at 96.57 (10/08/2013 low). A gradual rise towards the major resistance at 135.15 (01/02/2002 high) seems absolutely unlikely. Expected to decline further support at 93.79 (13/06/2013 low).
Jobs Data Eyed As Bond Yields Rise
- Higher bond yields weighing on equity markets;
- Wages key in US jobs report, Canadian data also key ahead of BoC decision next week.
US equity markets are expected to open relatively flat on Friday, with bond yields back in focus as we await the June labour market data from the US and Canada.
Bond yields have been rising once again this week as investors continue to prepare for the prospect of less monetary accommodation from central banks around the world. Recent commentary from a number of policy makers has done nothing to alter people's views, if anything they've supported them. While it seems an odd time for such coordinated moves, something has clearly spooked policy makers and triggered this change.
The moves in bond markets appear largely responsible for the stalling stock market rally and is likely what's weighing on them once again today. Still, it's important to note that we're still far from correction territory in the vast majority of indices, even the NASDAQ which has been hit particularly hard by the tech sell-off. There's certainly no reason to panic at this stage and the moves could prove to be nothing more than a temporary adjustment.
It's not even certain in some cases whether central banks will follow through on their warnings. We'll see the first test of this next week when the Bank of Canada announces its decision on interest rates. The ECB has long been expected to reduce its bond buying again at the end of the year, while the Fed's position has not changed and the Bank of England may still hold off, given the Brexit uncertainty that's hanging over the economy.
With central banks in mind, focus will now shift to the economic data for a fundamental justification for tighter monetary policy. It's jobs report day in the US – widely viewed as the most important economic report for the world's largest economy – and people will be looking for signs that the labour market remains on track but, arguably more importantly, that wages are rising. Higher wages will be the clearest sign yet that inflation is likely to pick up in the future but we haven't seen the tighter labour market reflected here yet. Canadian jobs data will also attract a lot of attention ahead of next week's BoC decision.
Technical Outlook: WTI Oil Accelerates Further Down As Rising Oversupply Concerns Offset Positive Impact From Upbeat US Crude Inventories...
WTI oil remains firmly in red for the third straight day and approaches support at $44.05 (Fibo 61.8% retracement of $42.04/$47.30 recovery rally).
Fresh bears found temporary footstep at $44.19 (4-hr cloud base) but strong bearish structure on all timeframes sees risk of further weakness
Oil price was sharply down in early Friday as strong concerns about global oversupply continue to heavily weigh on overall sentiment and offset positive impact from upbeat US crude stocks data, which showed much stronger than expected draw in crude inventories last week. (crude stocks fell 6.3 million barrels, beating forecast for 2.4 million barrels draw).
Close below $44.05 pivot would generate strong bearish signal for further weakness towards targets at $43.28 (Fibo 76.4%) and $43.62/52 (26/23 June lows), with final push towards key support at $42.04 (21 June low) not ruled out.
Broken 20SMA marks initial resistance at $44.71, followed by top of 4-hr cloud at $45.00 and broken 10SMA at $45.14.
Res: 44.71, 45.00, 45.14, 45.40
Sup: 44.19, 44.05, 43.66, 43.28
US Job Report And G20 Meeting In Focus
NFP will grab attention today
The opening of the G20 meeting today will most likely be completely sidelined by financials since, as usual, no key decision will be taken there. Maybe we'll get some action should Donald Trump make another incredible declaration that only he knows how to make. The key event this Friday is the June US jobs report which is due for release at GMT 12:30. After disappointing substantially last month as it printed at 138k versus 182k median forecast, June's non-farm payrolls are expected to come in at 178k.
However, the fact that the continuous improvement of the past months in the job market has failed to translate into sustained wage pressure has considerably diminished investors' interest for this data. Average hourly earnings are expected to have risen 2.6% y/y last month, compared to 2.5% in May. Finally, the unemployment and participation rate should remain stable at 4.3% and 62.7% respectively.
EUR/USD inched up 0.75% yesterday and is on its way to test the 1.1445 resistance from June 30th. We remain constructive on the euro as we anticipate the ECB is finally on its way to start talking - even cautiously - about reducing its support to the economy, while the Federal Reserve will likely be forced to slow down its tightening pace against the backdrop of weakening inflationary pressure.
G20: What to expect?
The G20 meeting is always a good occasion to get economic and geopolitical visions of world leaders regarding key topics such as the global recovery. Today and tomorrow, the leaders will meet in Hamburg. It will be very interesting to see the first time Donald Trump and Vladimir Putin will ever meet in person.
We expect to see what will be the nature of Trump's message and in particular the nature of global relations in the future, especially relations between Russia and the US. Other important topics such as the migrant crisis or the climate should be discussed but this won't likely have any impact on markets. We recall that Trump exited the Paris Climate Agreement and further negotiations on climate should at some point take place.
For the time being, stocks are sliding lower and we believe that markets will remain stable today waiting for further developments. Declarations about the global economic recovery and estimation of the potential risks that are threatening growth are definitely important. Markets are calm in the beginning of the summer and this G20 may disrupt it.
Global yields rally
Markets have hit a reflection point on central banks' reflation trade. Perhaps reflation is not the correct term since policy makers are not waiting for inflation to reach satisfactory levels but rather are using the solid economic outlook to unwind extreme policy measures.
Market movements for most of the summer have been lacking historical recognisable patterns. However this week, particularly, behaviour is starting to exhibit identifiable trends. Bond yields are rising globally, driving FX and equity markets (slow motion taper tantrum). Traders are slowly liquidating low yielding G10 and high beta EM currencies. So far the move has been orderly, however, it's easy to see how the rotation could change to disorderly.
The BoJ were forced to intervene as 10yr JGBs hit the upper threshold of curve control strategy at 10bp. The Japanese central banks offered unlimited quantity of 10yr JGB at 11bps. The decisive move highlights the BoJ's commitment to achieve its 2% inflation target and pinning the rate curve long-end.
Investors are now convinced that for a majority of G10 central banks, the next move will be tightening. It may be represented by subtle shifts in language that removed the probability of lower interest rates or additional asset purchased but comments can have tightening effects.
Speculations of the ECB exit has weighed on German equity markets despite Draghi's efforts to backtrack from original statements. Despite the summer heat, traders should be wary that a shift in monetary policy regime generally have extreme consequences in financial markets. As yield differentials widen, watch for carry heavy positions to unwind while in-stock interest rate sensitive sectors such as real estate and construction will come under selling pressure.
Technical Outlook: Cable Falls Back Near Daily Cloud Top On Downbeat UK Data
Cable came under pressure after UK Industrial, Construction and Manufacturing output unexpectedly fell in May.
Industrial production was at -0.1% in May vs 0.4% forecast, Construction output fell 1.2% against forecast rise by 0.7%, while Manufacturing output numbers showed decline of 0.% in May, below forecasted increase of 0.5%.
Cable erased gains from Thursday on fall back to 1.2912 and pressuring again daily cloud top support (1.2906), break of which would generate fresh bearish signal.
Res: 1.2974, 1.2983, 1.3000, 1.3029
Sup: 1.2906, 1.2893, 1.2872, 1.2861
XAU/USD Analysis: Short Term Pattern Is Adjusted
Due to a rebound that occurred on Friday morning, the borders of the previously discovered ascending channel pattern on the hourly chart of the yellow metal can be adjusted. It can be observed that the metal’s price might after all reach above the 1,230 mark. However, on its way the bullion is set to face the resistance put up by the 55 and 100-hour SMAs, which are located just below and above the 1,225 mark. By examining the course of the SMAs, it can be seen that both of them will meet with the commodity price at the 1,225 mark. If their combined resistance is passed, then the 1,230 level becomes a target. Meanwhile, if the SMAs force the rate lower, a far down to the 1,220 level would be most likely, as until next week the lower trend line of the ascending channel is not reaching above that level.
USD/JPY Analysis: Approaches Monthly R1
On Thursday, USD/JPY failed to form a distinctive trend either direction, thus remaining in the 112.90/113.44 range the whole trading session and being supported by the 100-hour SMA. Nevertheless, the stillness of the market was disrupted by a sudden 49-pip surge early on Friday. The given move shifted tremendously indicator readings that became strongly bullish. It is expected that the given upward momentum might maintain for several hours; however, the monthly R1 at 113.90 could resist any attempts to move the rate north. The base scenario favours the US Dollar appreciating against the Yen in short term, but reversing somewhere near the two-month high at 114.34.
GBP/USD Analysis: Moves In Up-Trend
The Pound appreciated against the US Dollar on Thursday, reaching the 1.2974 mark late in the evening. The pair found support at the weekly PP and the 55-hour SMA, while minor resistance was met at the 100-hour SMA. Friday’s morning session started with weak volatility prior to the pair gaining momentum to the downside. In the short term, the pair may be pushed south, testing a resistance cluster formed by the 100– and 55-hour SMAs. However, technical indicators favour further appreciation that may consequently confirm an up-trend. Thus, a possible trading range in this session may be 1.2940/1.3030, regarding as very likely an attempt to approach the upper limit. Meanwhile, a breakout of the aforementioned support cluster could lead to a test of the 1.2920 area.
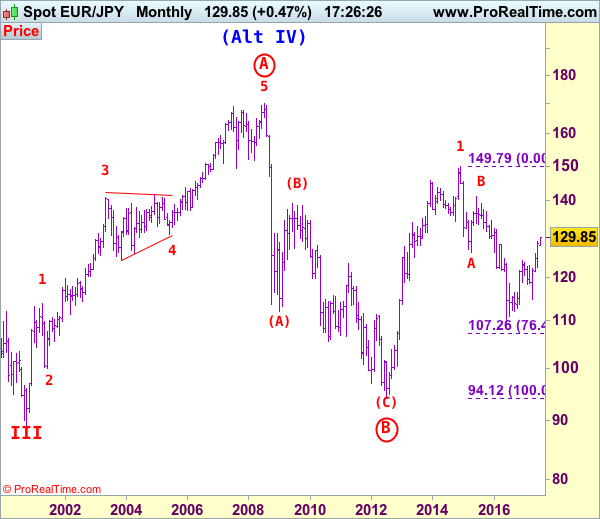
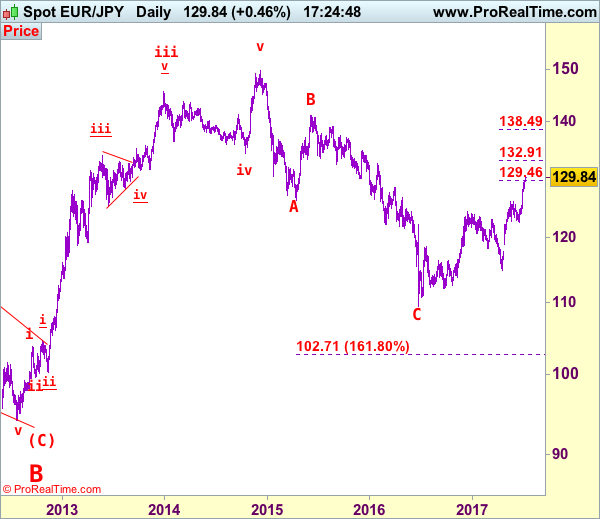
EUR/JPY Elliott Wave Analysis
EUR/JPY - 129.80
EUR/JPY: Wave v as well as larger degree wave (C) ended at 94.11 and first leg of larger degree wave C upmove has possibly ended at 149.79 and wave 2 correction has possibly ended at 109.49.
As the single currency has continued trading with a firm undertone after breaking previous resistance at 125.82, adding credence to our bullish view that recent upmove is still in progress and upside bias remains for medium term uptrend to extend further gain to 130.00, then towards 130.90-10, however, near term overbought condition should prevent sharp move beyond 132.00 and price should falter below 132.90-00 (1.236 times projection of 109.49-124.10 measuring from 114.85), risk from there has increased for a retreat to take place later.
The daily chart is labeled as attached, early selloff from 169.97 (July 2008) to 112.08 is wave (A) of B instead of end of entire wave B and then the rebound from there to 139.26 is wave (B), hence, wave (C) has possibly ended at 94.12 with a diagonal triangle as labeled in the daily chart, hence upside bias is seen for further gain. Recent rally above indicated retracement level at 116.69 (50% Fibonacci retracement of the intermediate fall from 139.26-94.12) adds credence to this view and signal major reversal has commenced but first leg of this wave C has possibly ended at 149.79, hence wave 2 has commenced with wave A ended at 126.09, followed by wave B at 141.06, wave C commenced and could have ended at 109.49, above 126.00 would add credence to this view, then headway to 130.00 would follow.
On the downside, although initial pullback to 129.00-10 and 128.00 cannot be ruled out, reckon 127.40-45 would limit downside and bring another rise to aforesaid upside targets. Only a drop below support at 126.49 would suggest top is possibly formed, bring test of previous resistance at 125.82 (now support), a sustained breach below this level would add credence to this view, bring correction to 125.15-20 but previous resistance at 124.65 would hold, bring another upmove later. In the unlikely event, euro drops below 124.65 on a daily basis, this would signal a temporary top is formed instead, then further fall to 124.00 and later towards support at 123.66 would follow.
Recommendation: Buy at 126.50 for 130.00 with stop below 125.50.
Remark: Due to holidays, update will resume on 19 July 2017
To re-cap the corrective upmove from the record low of 88.93 (18 Oct 2000), the wave A from there is subdivided as: 1:88.93-113.72, 2:99.88 (1 Jun 2001), 3:140.91 (30 May 2003), 4:124.17 (10 Nov 2003) and 5 ended at record high of 169.97 (21 Jul 2008). The brief but sharp selloff to 112.08 is viewed as a-b-c x a-b-c wave (A) of B. The subsequent rebound to 139.26 is (B) of B and (C) of (B) has possibly ended at 94.12 and in any case price should stay well above previous chart support at 88.93, bring rally in larger degree wave C towards 150.00.