
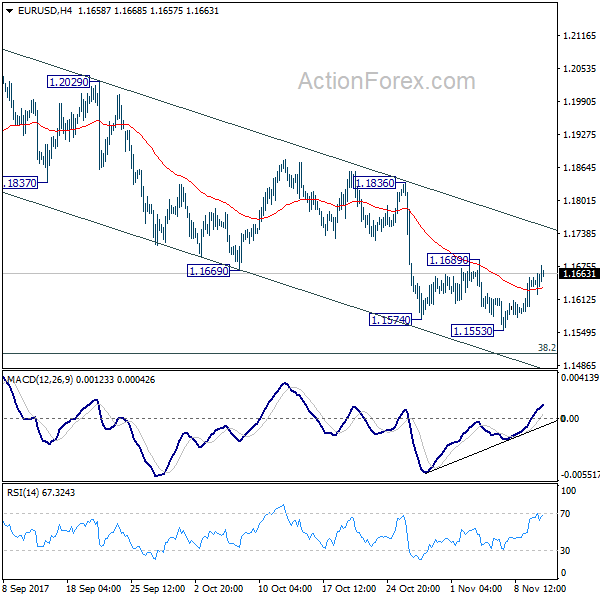
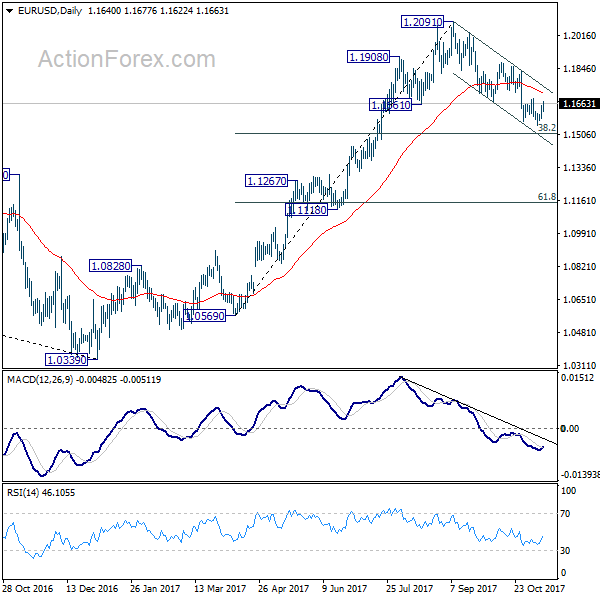
EUR/USD dipped to 1.1533 last week but recovered quickly. Initial bias remains neutral this week first. As long as 1.1689 resistance holds, deeper decline is in favor. Below 1.1553 will resume whole fall from 1.2091 and target 38.2% retracement of 1.0569 to 1.2091 at 1.1510. We’d be cautious on strong support from there to bring rebound. But sustained break of 1.1510 will pave the way to next support zone at 1.1118/1267. On the upside, break of 1.1689 resistance will now indicate short term bottoming and turn bias back to the upside for 1.1836 resistance instead.
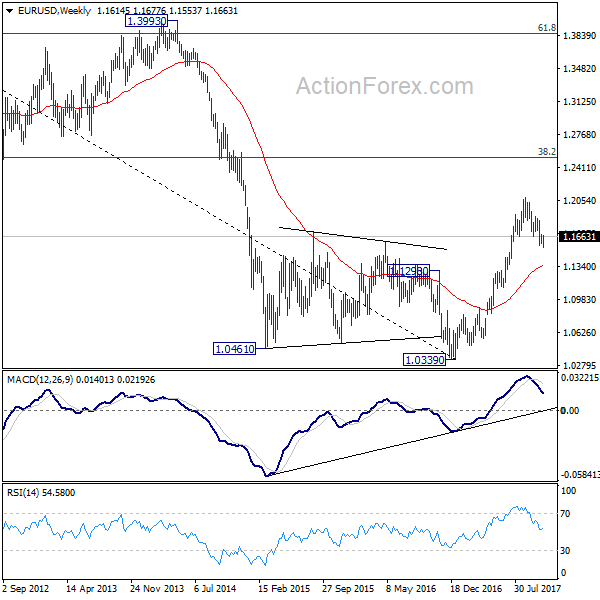
In the bigger picture, rise from 1.0339 medium term bottom is seen as a corrective move for the moment. Therefore, in case of another rally, we’d be cautious on 38.2% retracement of 1.6039 (2008 high) to 1.0339 (2017 low) at 1.2516 to limit upside and bring reversal. Meanwhile, sustained trading below 55 week EMA (now at 1.1346) will suggest that such medium term rebound is completed and could then bring retest of 1.0339 low.
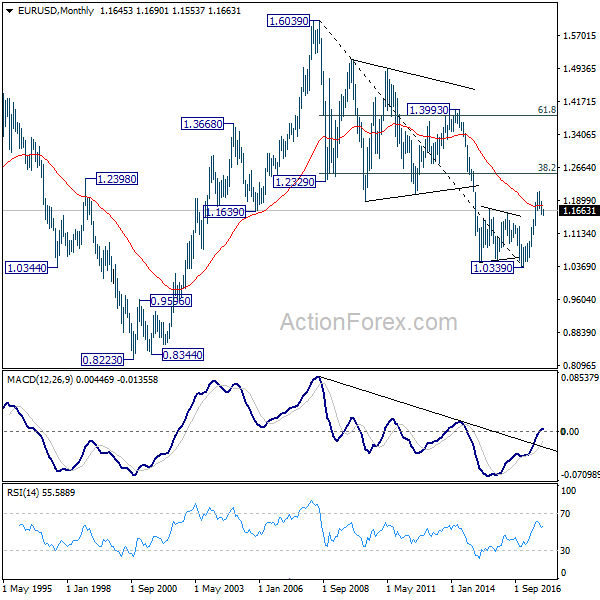
In the long term picture, 1.0339 is now seen as an important bottom as the down trend from 1.6039 (2008 high) could have completed. It’s still early to decide whether price action form 1.0339 is developing into a corrective or impulsive move. On the upside, strong resistance could be seen from 38.2% retracement of 1.6039 to 1.0339 at 1.2516. On the downside, we’re not anticipating a break of 1.0339 in near to medium term.


