
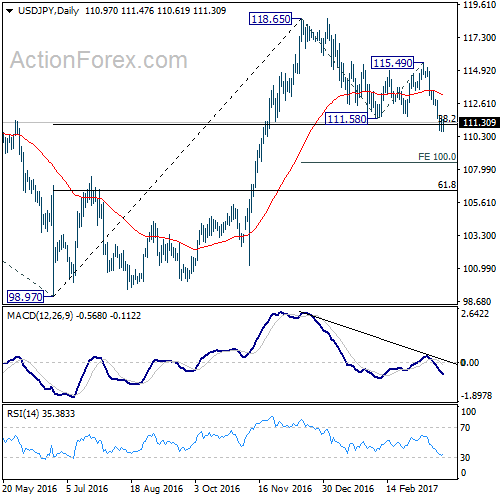
USD/JPY’s decline from 118.65 resumed last week by taking out 111.58 support last week and reached as low as 110.62. 38.2% retracement of 98.97 to 118.65 at 111.13 was breached but there was no follow through selling yet. But in any case, price actions from 118.65 are still viewed as a correction for the moment.
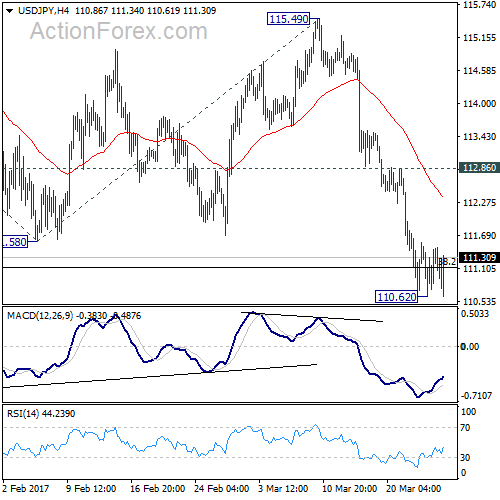
Initial bias is neutral in USD/JPY this week first. On the upside, break of 112.86 resistance will argue that a short term bottom is formed. In such case, intraday bias will be turned back to the upside for 115.49 resistance. Break will indicate completion of the correction from 118.65. Meanwhile, break of 110.62 will likely send USD/JPY to 100% projection of 118.65 to 111.58 from 115.49 at 108.42 to extend the correction.
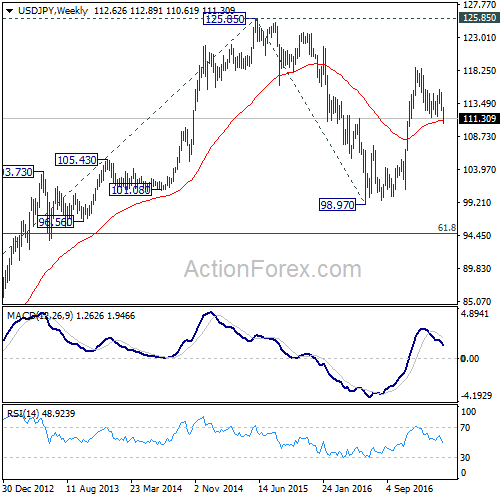
In the bigger picture, price actions from 125.85 high are seen as a corrective pattern. The impulsive structure of the rise from 98.97 suggests that the correction is completed and larger up trend is resuming. Decisive break of 125.85 will confirm and target 61.8% projection of 75.56 to 125.85 from 98.97 at 130.04 and then 135.20 long term resistance. Nonetheless, sustained trading below 55 week EMA (now at 111.08) will extend the consolidation from 125.85 with another fall through 98.97 before completion.
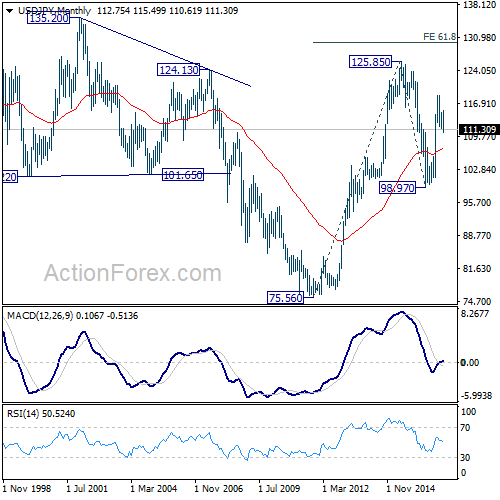
In the long term picture, the rise from 75.56 long term bottom to 125.85 medium term top is viewed as an impulsive move. Price actions from 125.85 are seen as a corrective move which could still extend. But, up trend from 75.56 is expected to resume at a later stage for above 135.20/147.68 resistance zone.


