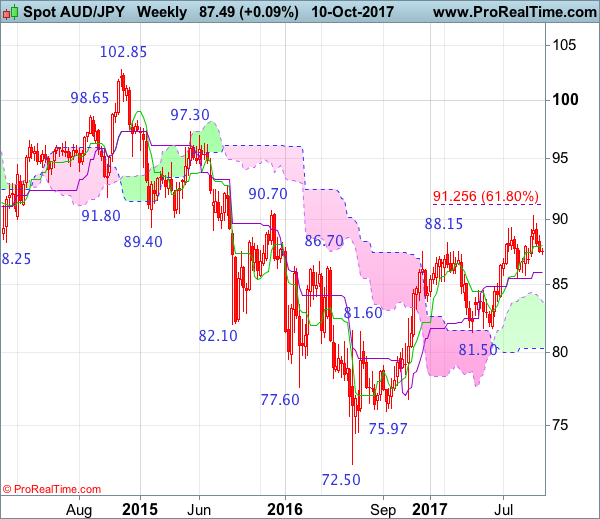
Weekly
• Last Candlesticks pattern: Shooting star
• Time of formation: 13 Mar 2017
• Trend bias: Down
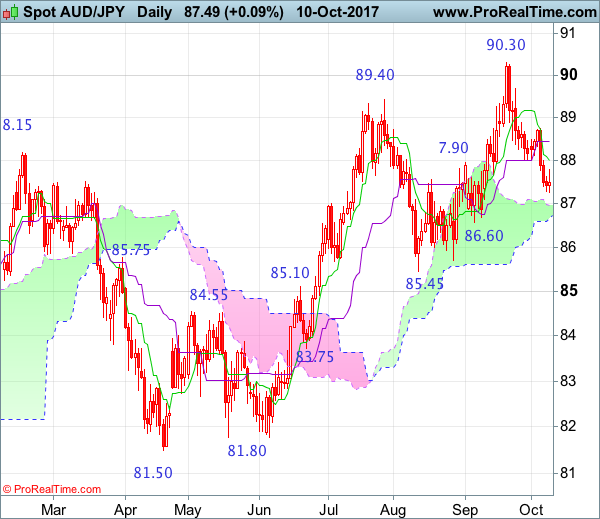
Daily
• Last Candlesticks pattern: Bearish engulfing pattern
• Time of formation: 16 Feb 2017
• Trend bias: Near term down
AUD/JPY – 89.05
Despite recovering to 88.70, renewed selling interest emerged and aussie has slipped again since, dampening our bullishness and suggesting a temporary top has possibly been formed at 90.30, hence consolidation with downside bias is seen for weakness to the lower Kumo (now at 86.72) but a daily close below support at 86.60 is needed to add credence to this view, bring retracement of early upmove to 86.30-35 and possibly towards 86.00, having said that, support at 85.70 should remain intact, bring rebound later.
On the upside, whilst recovery to the Tenkan-Sen (now at 88.00) cannot be ruled out, reckon the Kijun-Sen (now at 88.44) would limit upside and bring another decline later. Only above resistance at 88.70 would defer and suggest the first leg of decline from 90.30 top has ended, risk a stronger recovery to 89.00 and possibly towards 89.65-70 but price should falter below said resistance at 90.30, bring another leg of corrective decline later this month.
Recommendation: Exit long entered at 88.10 and sell at 88.20 for 86.20 with stop above 89.10
On the weekly chart, aussie’s retreat after rising to 90.30 last month suggests a temporary top has possibly been formed there and consolidation with mild downside bias is seen for weakness to 86.70-75 and possibly towards support at 85.70, however, only a drop below support at 85.45 would add credence to this view, bring retracement of recent upmove to 84.95-00, then test of the upper Kumo (now at 83.75 also previous support level) which is likely to hold and price should stay above support at 82.55-60, bring rebound later.
On the upside, although initial recovery to the Tenkan-Sen (now at 88.00) cannot be ruled out, reckon upside would be limited to 88.20-30 and resistance at 88.70 should hold, bring another decline later. A weekly close above 88.70 would risk rebound to 89.40-50 but still expect upside to be limited to 89.65 and price should falter below resistance at 90.30, bring another retreat later. Only a break of said resistance at 90.30 would extend recent upmove to previous resistance at 90.70 and possibly towards 91.50-60 but price should falter below another previous chart resistance at 92.70, bring correction later.