
The EUR/USD currency pair
Technical indicators of the currency pair:
Prev Open: 1.12966
Open: 1.13158
% chg. over the last day: +0.17
Day’s range: 1.13052 – 1.13220
52 wk range: 1.1214 – 1.2557
EUR/USD stabilized after a long fall last week. EUR is supported by the strong economic reports from Germany. The financial market participants are worried about the possible recession in the world economy. Right now the quotes are consolidating. The key levels are 1.13000 and 1.13250. You should open positions from these levels and watch the US economic releases.
The Economic News Feed for 26.03.2019:
Real Estate Market Report (US) – 14:30 (GMT+2:00);
Consumer Trust Index (US) – 16:00 (GMT+2:00);
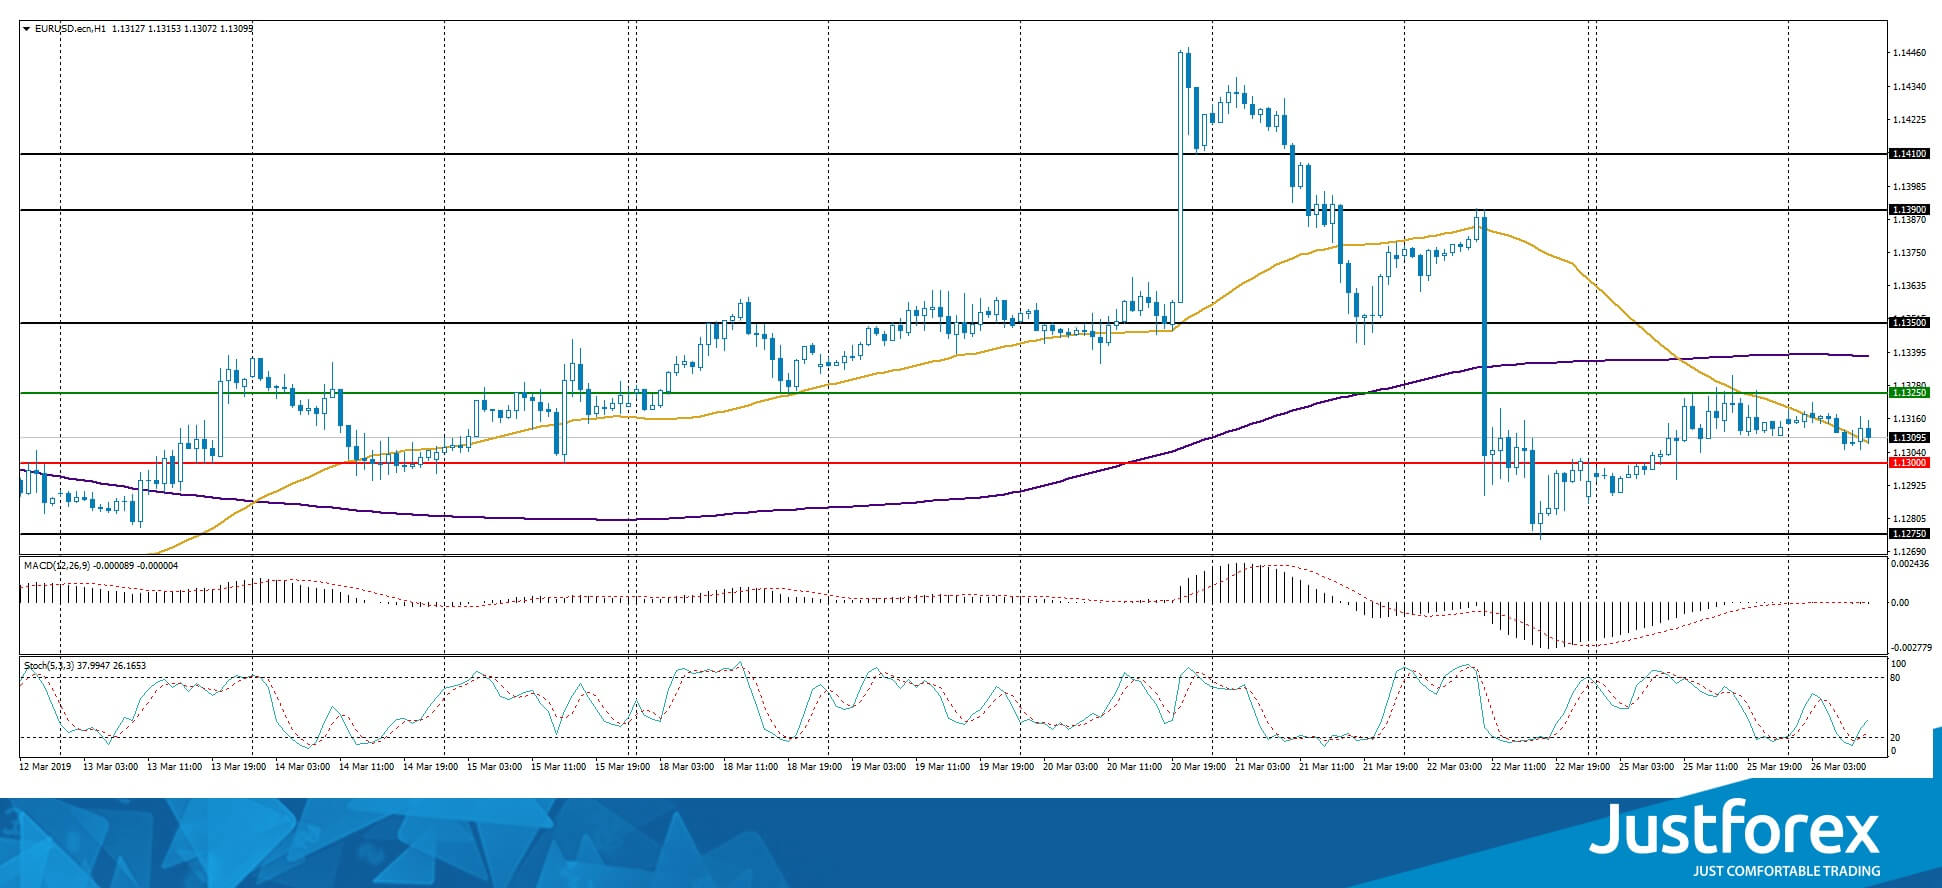
The indicators do not provide precise data, the price has crossed 50 MA.
The MACD histogram is close to 0.
The Stochastic Oscillator started to leave the oversold zone, the %K line is above the %D line which points towards a recover of EUR/USD.
Trading recommendations
Support levels: 1.13000, 1.12750
Resistance levels: 1.13250, 1.13500, 1.13900
If the price fixes below 1.13000, expect the quotes to fall toward 1.12750-1.12500.
Alternatively, the quotes can recover toward 1.13500-1.13700.
The GBP/USD currency pair
Technical indicators of the currency pair:
Prev Open: 1.32141
Open: 1.31946
% chg. over the last day: -0.05
Day’s range: 1.31774 – 1.32226
52 wk range: 1.2438 – 1.4378
GBP keeps consolidating. The GBP/USD quotes are testing the key levels at 1.31600 and 1.32250. On Monday Theresa May said that she doesn’t have enough support for a second vote. Keep an eye on this issue and open positions from the key levels.
The Economic News Feed for 26.03.2019 is calm.
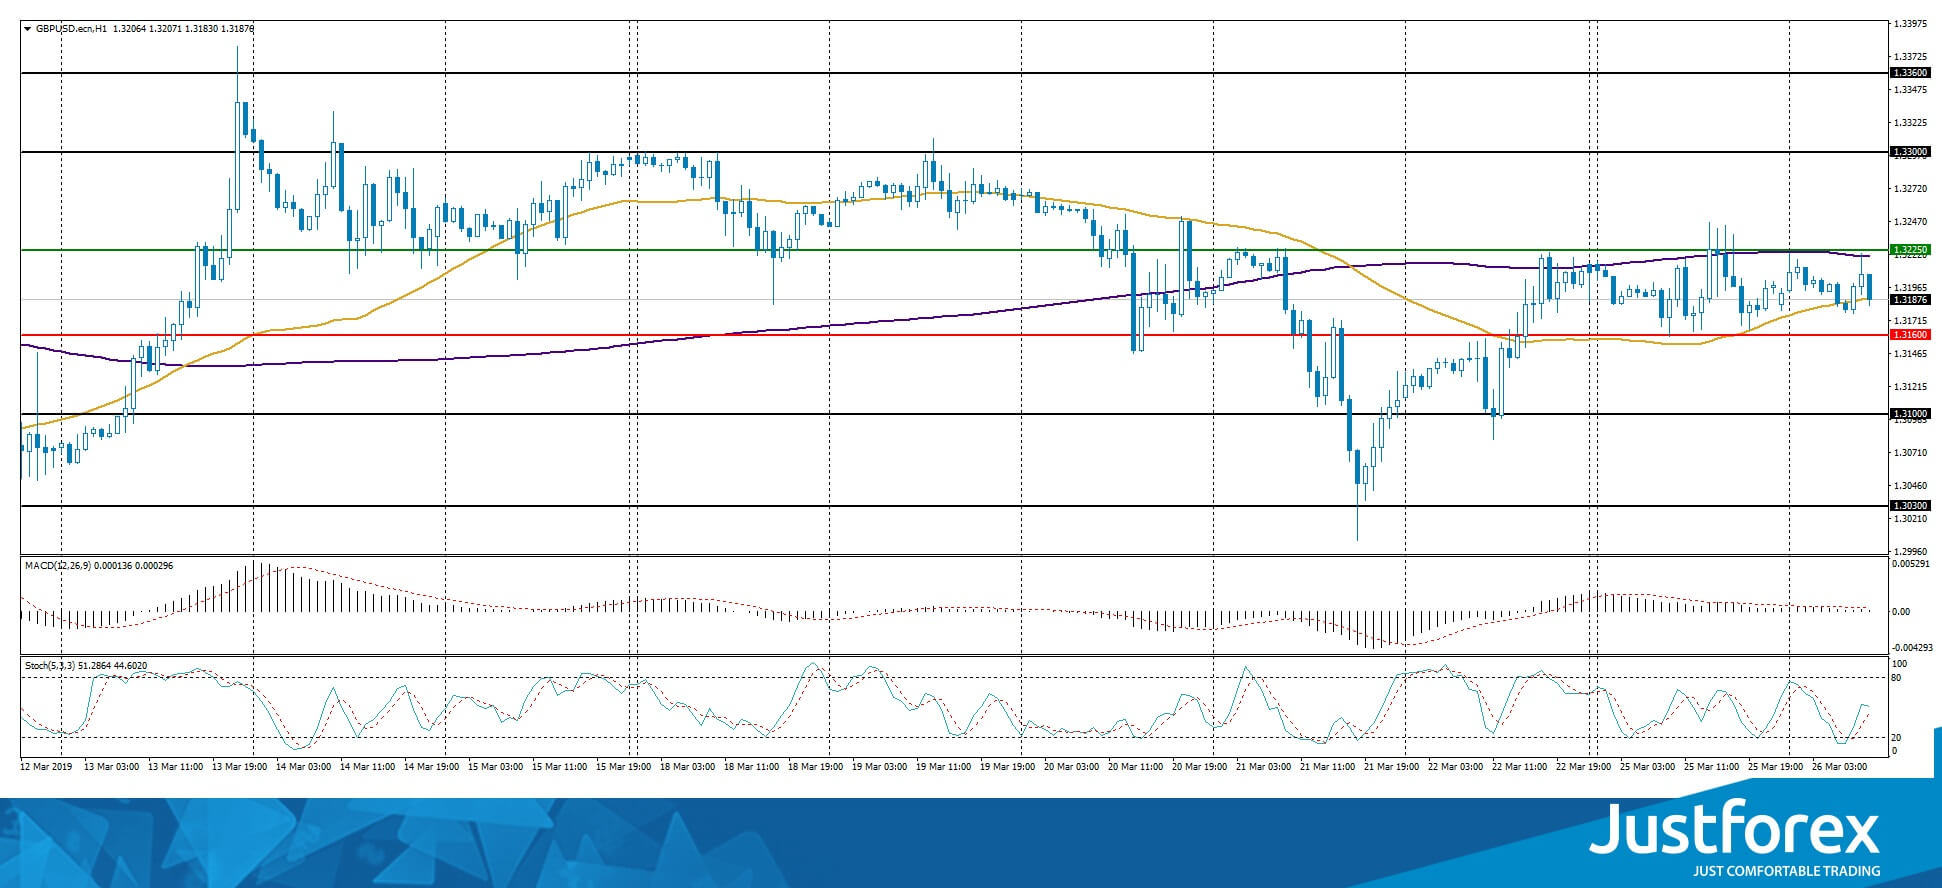
Indicators do not provide precise signals, the price crossed 50 MA and 200 MA.
The MACD histogram is close to 0.
The Stochastic Oscillator is in the neutral zone, the %K is above the %D line which points to the bullish mood.
Trading recommendations
Support levels: 1.31600, 1.31000, 1.30300
Resistance levels: 1.32250, 1.33000, 1.33600
If the price fixes above 1.32250, expect the movement toward 1.32750-1.33000.
Alternatively, the quotes can fall toward 1.31000.
This article reflects a personal opinion and should not be interpreted as an investment advice, and/or offer, and/or a persistent request for carrying out financial transactions, and/or a guarantee, and/or a forecast of future events.
The USD/CAD currency pair
Technical indicators of the currency pair:
Prev Open: 1.34257
Open: 1.34064
% chg. over the last day: -0.23
Day’s range: 1.33863 – 1.34073
52 wk range: 1.2248 – 1.3664
USD/CAD retreated from the local maximums. The technical picture is ambiguous. CAD is consolidating in the 1.33850-1.34100 range. The financial market participants are waiting for additional drivers. Today you should keep an eye on the US economic releases and open positions from the key levels.
The Economic News Feed for 26.03.2019 is calm.
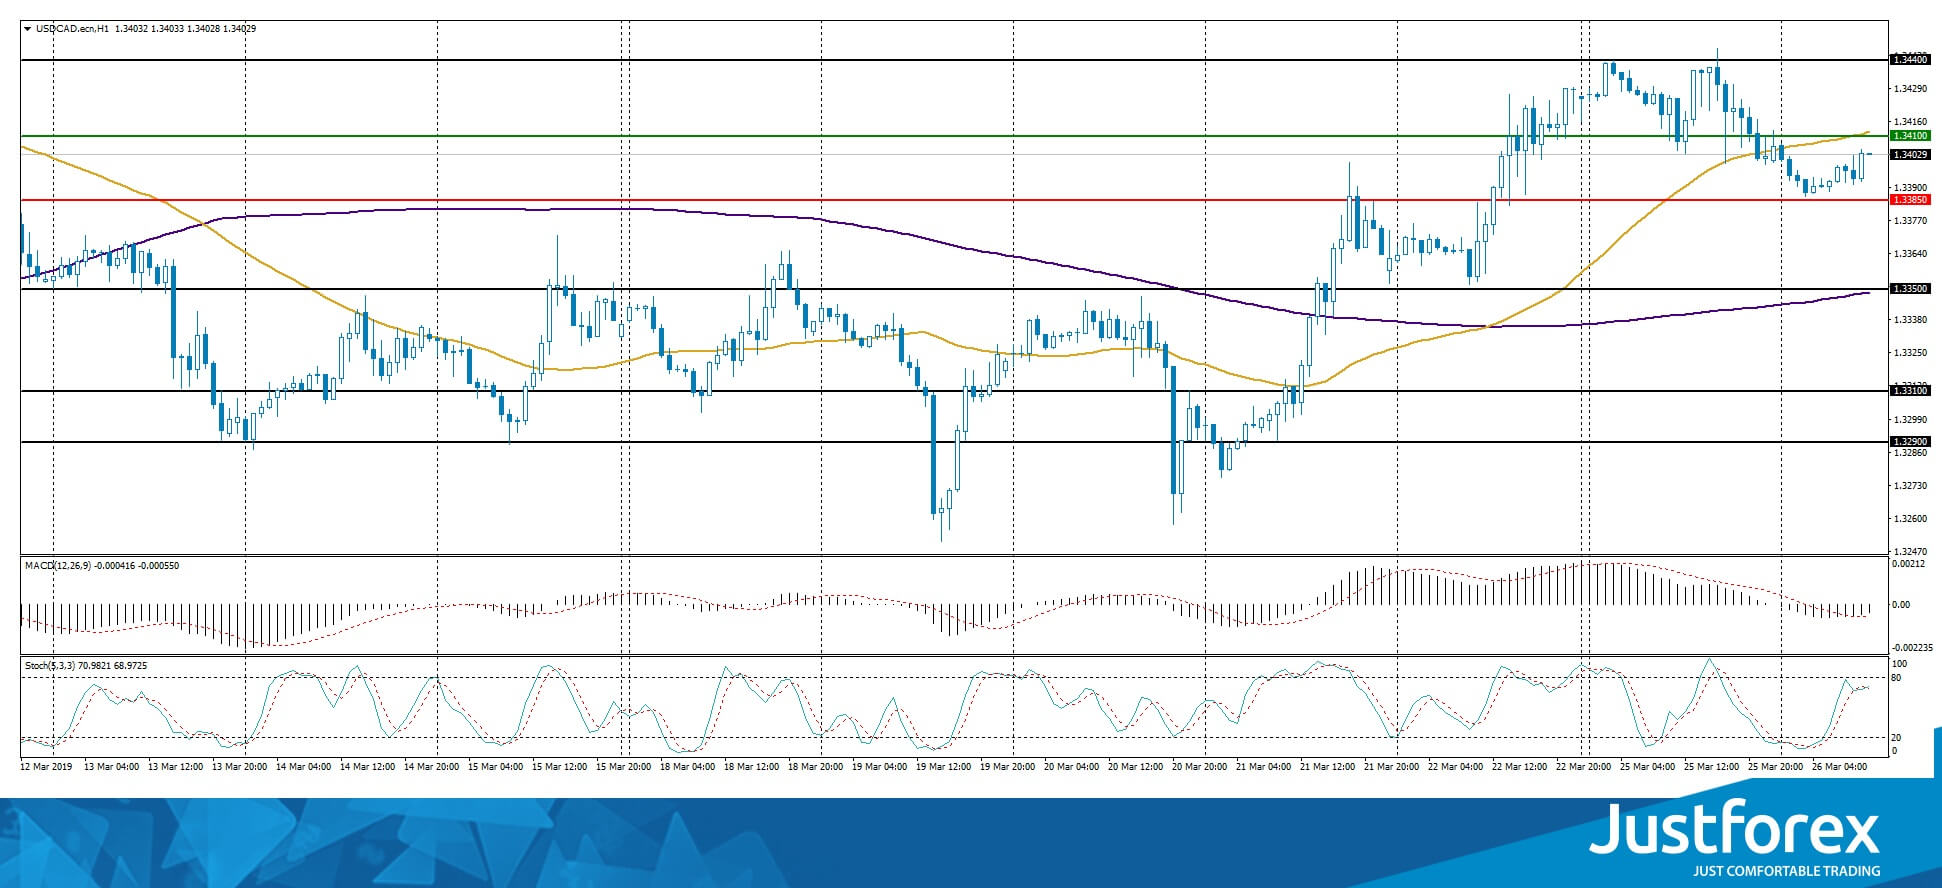
The indicators do not provide precise signals, the price fixed between 50 MA and 200 MA.
The MACD histogram is in the negative zone but above the signal line which gives a weak signal to sell USD/CAD.
The Stochastic Oscillator is in the neutral zone, the %K line is crossing the %D line. There are no signals at the moment.
Trading recommendations
Support levels: 1.33850, 1.33500, 1.33100
Resistance levels: 1.34100, 1.34400, 1.35000
If the price fixes above 1.34100, expect the quotes to grow toward 1.34400-1.34700.
Alternatively, the quotes can fall toward 1.33600-1.33400.
The USD/JPY currency pair
Technical indicators of the currency pair:
Prev Open: 109.996
Open: 109.977
% chg. over the last day: -0.03
Day’s range: 109.977 – 110.243
52 wk range: 104.56 – 114.56
USD/JPY stabilized after an agressive sell-off last week. The key support and resistance levels are 109.800 and 110.300. The demand for safe assets is high. The investors are worried about growing recession risks. Keep an eye on the economic reports and the US Treasury bonds` yield dynamic. Open positions from the key levels.
The Economic News Feed for 26.03.2019 is calm.
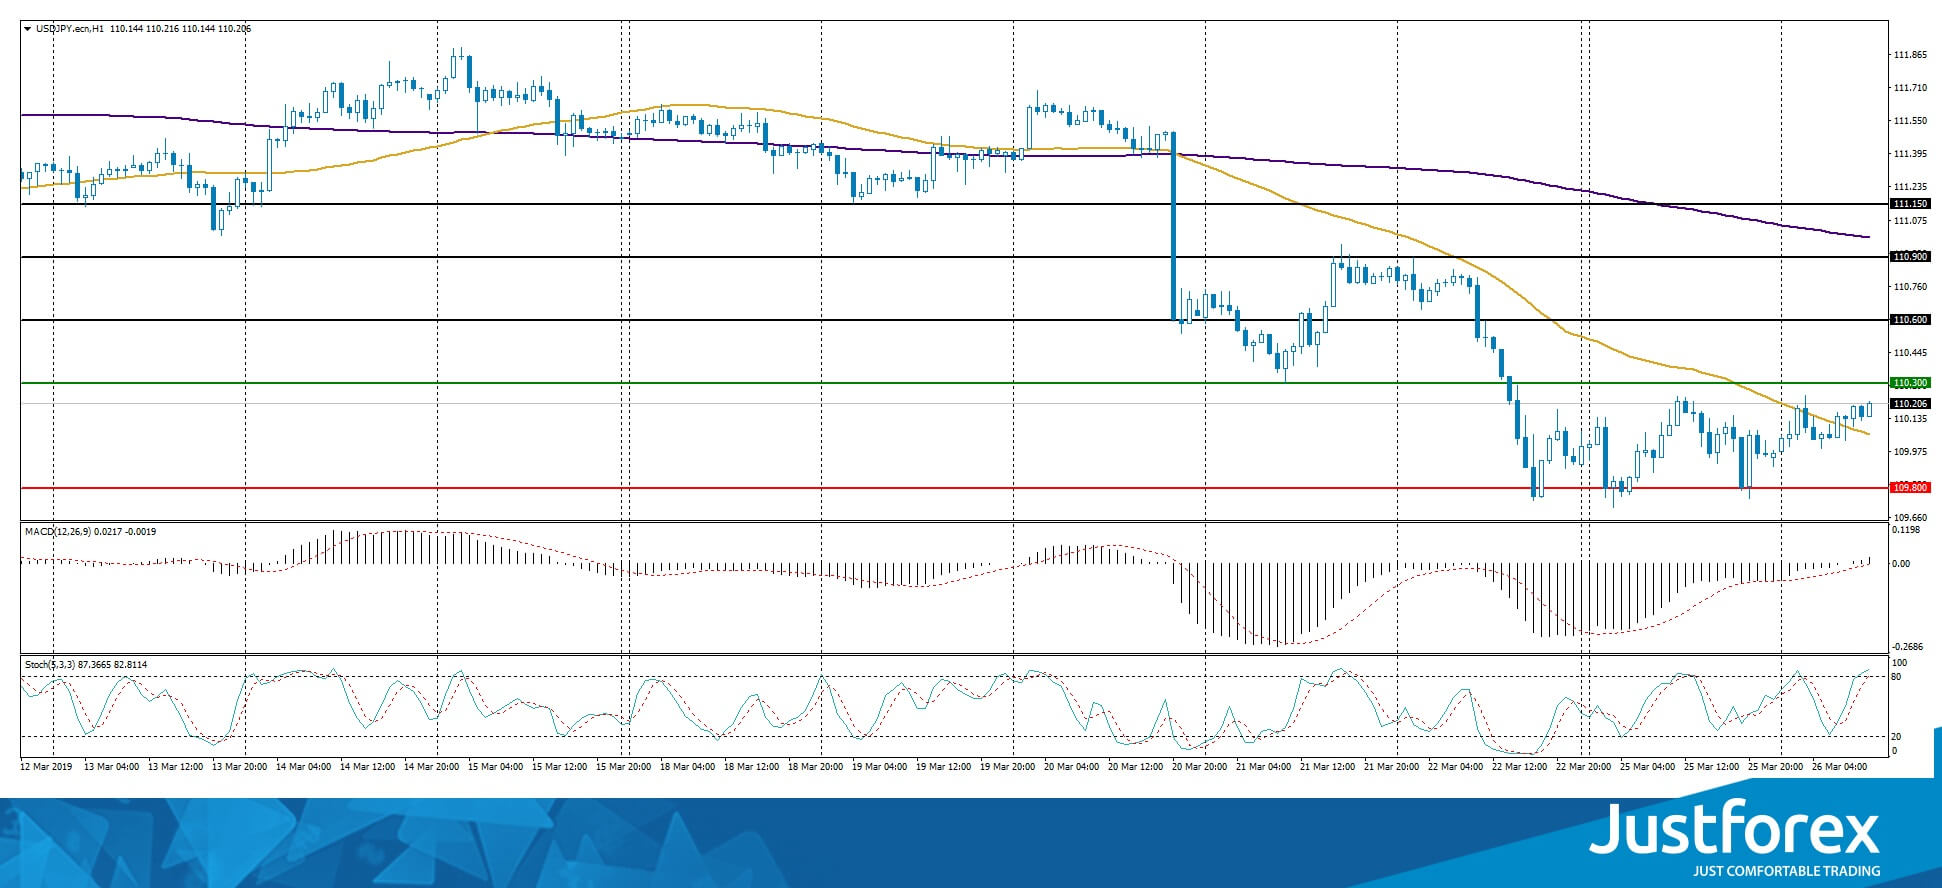
Indicators do not provide precise signals, the price has crossed 50 MA.
The MACD histogram is in the positive zone which points to the power of the buyers.
The Stochastic Oscillator is near the overbought zone, the %K line is above the %D line which gives a weak signal to buy USD/JPY.
Trading recommendations
Support levels: 109.800, 109.500
Resistance levels: 110.300, 110.600, 110.900
If the price fixes above 109.800, expect the quotes to fall toward 109.500-109.300.
Alternatively, the quotes can recover toward 110.600-110.900.


