
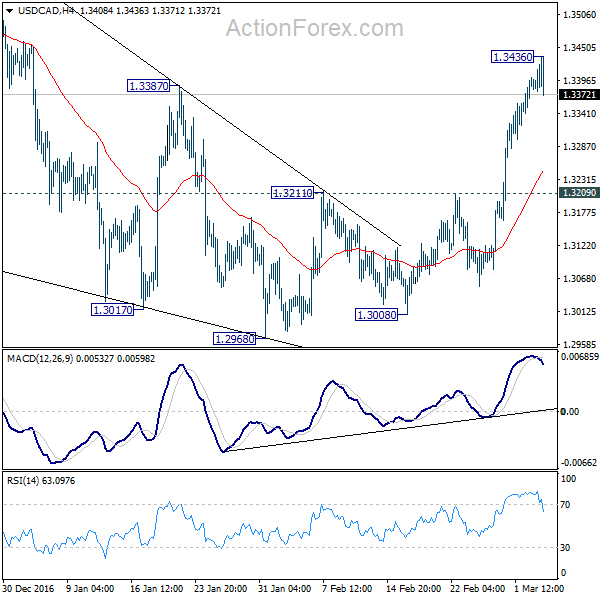
USD/CAD jumped to as high as 1.3446 last week and the development indicates completion of corrective fall from 1.3598 at 1.2968. As a temporary top is in place at 1.3436 with 4 hour MACD crossed below signal line, initial bias is neutral for some consolidations first. But downside of retreat should be contained above 1.3209 support and bring another rise. Above 1.3236 will target a test on 1.3598 high. Break there will extend the medium term rise from 1.2460 to next fibonacci level at 1.3838.
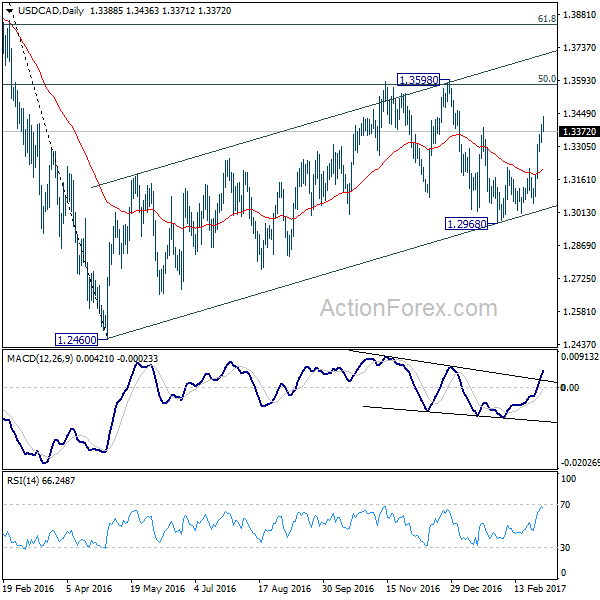
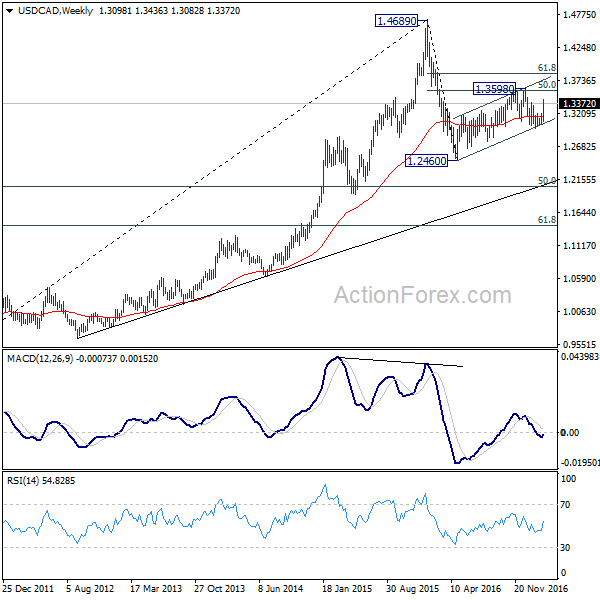
In the bigger picture, price actions from 1.4689 medium term top are seen as a correction pattern. The first leg has completed at 1.2460. The second leg is likely still in progress and could target 61.8% retracement of 1.4689 to 1.2460 at 1.3838. We’d look for reversal signal there to start the third leg. Break of 1.2968 wold at least bring at retest of 1.2460 low. However, sustained trading above 1.3838 would pave the way to retest 1.4689 high.
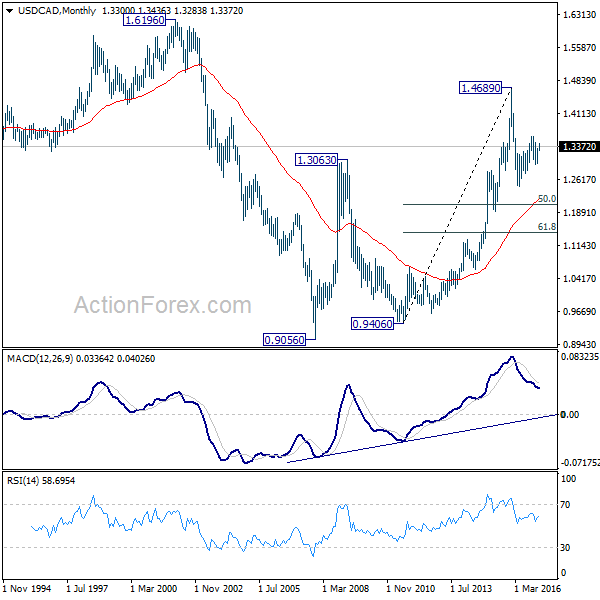
In the longer term picture, rise from 0.9056 (2007 low) is viewed as a long term up trend. It’s taking a breath after hitting 1.4689. But such rise expected to resume later to test 1.6196 down the road.


