
U.S. Highlights
- Markets were in a good mood overall this week, despite no deal in Congress on the next round of assistance. The big political news was Biden’s historic VP pick. With 81 days until the election, the race is on!
- Inflation bounced back more quickly than expected in July, as pandemic related discounting rolled off. Core inflation at 1.6% year on year, remained unthreatening.
- Retail sales continued to improve, albeit by slightly less than analysts were expecting. The big increases due to pent up demand from the closures are in the past, but progress is still being made.
Canadian Highlights
- The real estate market continues to show resilience. Housing starts jumped 16% in July, well above consensus expectations of a modest pullback.
- The manufacturing sector too beat all expectations, rebounding strongly in June. However, the sector still has a long way to go, as manufacturing sales remain 13% below pre-pandemic levels.
- The federal government announced measures to facilitate individuals on CERB to begin their transition to EI as soon as the end of this month.
U.S. – Markets Optimistic Despite No Deal Yet from Washington
Markets were in a good mood this week, despite the lack of agreement on the next round of assistance from Washington. July data continued to roll in, with inflation bouncing back and retail sales continuing to make progress. The big news was Joe Biden selecting his running mate, Senator Kamala Harris. The choice is historic, but likely not a game changer from a policy perspective. Biden’s stance on many issues was set before Harris was chosen, and it is unclear how much influence VPs have on the campaign’s priorities, and it is still a bit early to see if the pick has improved Biden’s odds in the polls.
On the economic data for July, inflation, as measured by the Consumer Price Index, rebounded more sharply than expected. Core inflation rose 0.6% month-over-month – the largest jump since 1991. The move was largely due to price hikes in areas that had seen significant discounting earlier in the pandemic, like motor vehicle insurance and airline fares (spending categories that also experienced steep declines in sales volumes). The acceleration in price growth has led some to raise the specter of stagflation – where higher inflation takes hold despite low growth. However, we think its bit early for that, given some of the volatility in various categories recently. Core inflation was up a modest 1.6% year-on-year in July, so there is still room for prices to normalize further before inflation gets anywhere near a level that is concerning for the Federal Reserve.
Retail sales continued to improve in July, rising 1.2% on the month. They came in below what markets were expecting, but even in the face of surging infections in many areas of the country, retailers continued to make progress. The pace of the rebound has slowed, now that the initial flurry of pent-up demand after the closures has played out. Many of the major categories are very close to or even above their pre-pandemic level of sales (Chart 1). The hardest hit categories are clothing, restaurants and bars and department stores. Restaurants and bars among the later businesses to open, and in some areas face renewed shutdowns. And demand for clothing is likely low, given many people are staying home in their sweatpants, (it has also been hit by the shift to online retailers).
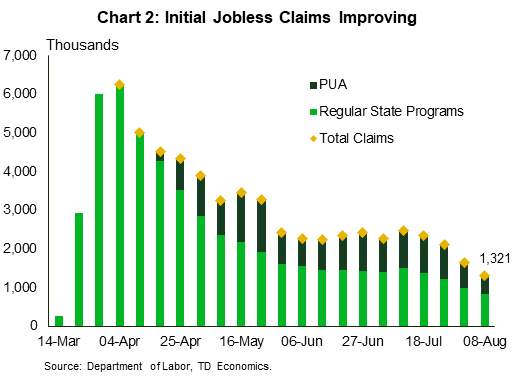
Progress on sales is likely to slow further in the months ahead, particularly now that the generous unemployment benefits ($600/week) have ended. The good news is that initial jobless claims continued to move in an encouraging direction in the week ended August 8th (Chart 2). Moreover, the number of people collecting unemployment benefits also declined in late July. Still, at 28.3 million people, the total remains incredibly high.
This tally underscores the need for assistance from Washington. Many states’ unemployment benefit rates top out at very low levels: Florida at $275 per week and Arizona at $240 per week. Trump’s executive order funds $300 per week out of FEMA disaster relief funds. But that will likely only last about six weeks. Congress needs to act on another round of relief, particularly for state governments to forestall another round of layoffs at the state and local level which would weigh on growth over the medium term, similar to the dynamic as we saw in the 2010-2012 period.

Canada – Housing Market Strengthens Against All Odds
Financial markets seesawed this week, with the S&P/TSX composite 0.3% lower compared to last week (as of writing). However, the index is still 46% higher than the lows seen in late-March. Elsewhere, oil prices continued their upward drive on the back of fresh hopes of progress in the coronavirus vaccine trials and expectations for a fall in U.S. crude inventories. As of writing, oil prices are 2.4% higher compared to last week but remain 31% lower than the levels seen at this year’s outset.
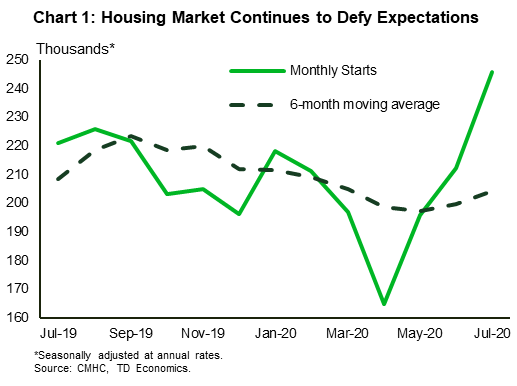
In terms of economic data, Canadian housing continues to defy expectations. Housing starts jumped to 245.6k (annualized) units in July, up from 212.1k units in June (Chart 1). While low interest rates have helped, it is surprising to see the real estate sector’s resilience given the weakness in the labour market. The apparent contradiction can be explained by lower income workers having faced the brunt of labour market disruptions compared to higher income workers. This has seemingly allowed higher income workers who have maintained their salaries while working from home to become opportunistic buyers, benefiting from low interest rates and improved bargaining power.
Meanwhile, the manufacturing sector soared in June, surprising many along the way. Manufacturing sales increased 20.7% on the month, beating Statistics Canada’s flash estimate for a 16.8% increase (Chart 2). The positive data were once again driven by transportation equipment and petroleum/coal product industries, which grew by 144.3% and 31.5%, respectively. Although the June jump is good news, sales remain 13.2% below pre-pandemic levels. July data for manufacturing employment and hours worked imply that the near-term future of the manufacturing sector is bright. However, there are dark clouds in the horizon as cases have surged in the U.S. – Canada’s largest export market.
In other news, Statistics Canada reported there being 1.3 million businesses in June, an increase of 0.6% compared to the same month last year. While this may seem surprising, we need to account for governments’ and financial institutions’ support measures for businesses, and the fact that filing for insolvency and bankruptcy can be a long-drawn process. There may be an uptick in insolvencies in the coming months as temporary support measures end.
On the fiscal front, the Government has taken measures to make the transition from CERB to Employment Insurance (EI) easier. The Government has temporarily set a minimum unemployment rate for the EI program at 13.1%. When individuals start transitioning from CERB to EI at the end of this month, those living in EI regions with unemployment rates lower than 13.1% will have their benefits calculated based on the 13.1% rate. Moreover, those living in regions with a higher unemployment rate will have their benefits calculated using the actual rate for that region.
Meanwhile, the benchmark five-year mortgage rate reported by the Bank of Canada dropped for the third time this year. The rate has now dropped to 4.79%, after falling in May and March. The fall in rates will make it easier for prospective home buyers to qualify for a mortgage. However, it is likely to have a limited macroeconomic impact, as it would primarily benefit those applicants who only narrowly did not qualify for a mortgage earlier.

Canada: Upcoming Key Economic Releases
Canadian Consumer Price Index – July
Release Date: August 19, 2020
Previous: 0.8% m/m, 0.7% y/y, index: 137.2
TD Forecast: 0.5% m/m, 0.6% y/y, Index: 137.9
Consensus: 0.3% m/m, 0.5% y/y, Index: 137.7
We look for headline CPI to edge lower to 0.6% year-on-year (y/y) in July, with prices up 0.5% on the month. Energy prices will provide another sizeable tailwind, with gasoline alone contributing ~0.2pp to the monthly increase (vs 0.3pp in June) while softer US grocery prices and a stronger Canadian dollar will weigh on the food component. Elsewhere, we should see another solid increase in the ex. food & energy index, with airfares expected to make a strong contribution. Canadian airfares have averaged a 15% m/m increase in July over the last two years, although data collection remains affected by flights suspended due to COVID. Airfares were a leading contributor to the unexpected strength in Core CPI south of the border, but historically there has not much correlation between Canadian & US airfares (before March 2020) which introduces an element of uncertainty. Core measures should also hold stable from June, with the average of the three BoC measures expected to remain unchanged at 1.7% y/y.

Canadian Retail Sales – June
Release Date: August 21, 2020
Previous: 18.7%, ex-auto: 10.6%
TD Forecast: 19.0%, ex-auto: 13.5%
Consensus: 24.5%, ex-auto: 16.0%
Retail sales are forecast to rise by another 19% in June, building on a similar increase from May. This is below the early tracking from StatCan for a 24.5% increase and would leave total sales 2.5% below year-ago levels, putting Canada slightly behind the US recovery (+1.1% y/y). Motor vehicles should once again drive the headline print on another large increase in auto sales, leaving the ex-autos measure up 13.5%. Google mobility data has shown a steady increase in time spent at retail locations in June, which should support broad strength among core components like apparel and general merchandise, although monthly grocery purchases remain well above pre-COVID levels even after a 12.5% drop from March. Real retail sales should see a (slightly) smaller increase, owing to a 1.3% increase in consumer goods prices.


