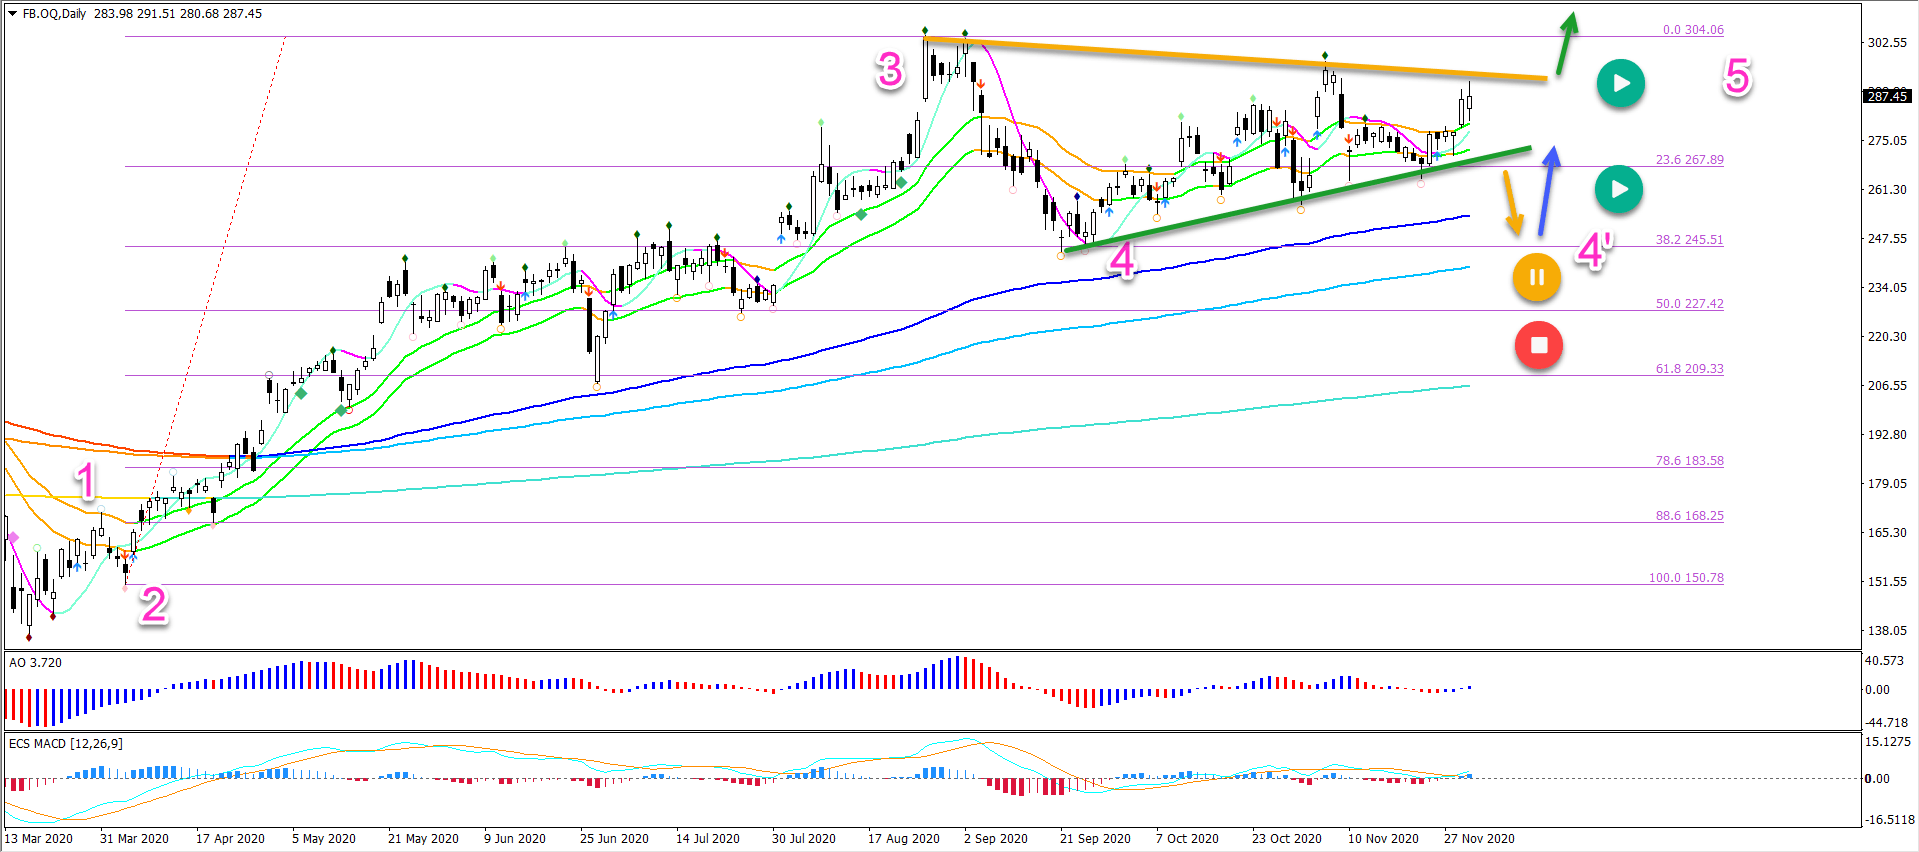
Facebook showed a strong bullish momentum. This is probably a wave 3 (pink). The retracement has respected the 38.2% Fibonacci retracement level.
Facebook (FB) is showing a perfect uptrend alignment. We can see this via the moving averages (MAs): price is above the 21 ema zone, which is above the long-term MAs.
Will the uptrend continue and when should the bulls be worried? Let’s review
Price Charts and Technical Analysis
Facebook showed a strong bullish momentum. This is probably a wave 3 (pink). The retracement has respected the 38.2% Fibonacci retracement level.
The sideways price action has either completed a wave 4 at the previous bottom (pink) or could complete it in the near future (wave 4′).
The trend lines and the 21 ema zone are critical for the next price swing:
A bearish breakout could indicate a larger wave 4.
A bullish breakout could indicate the continuation of the wave 5.
The bullish targets are located at $325 and $350. A break below the 38.2% and 50% Fib make the wave 4 less likely.
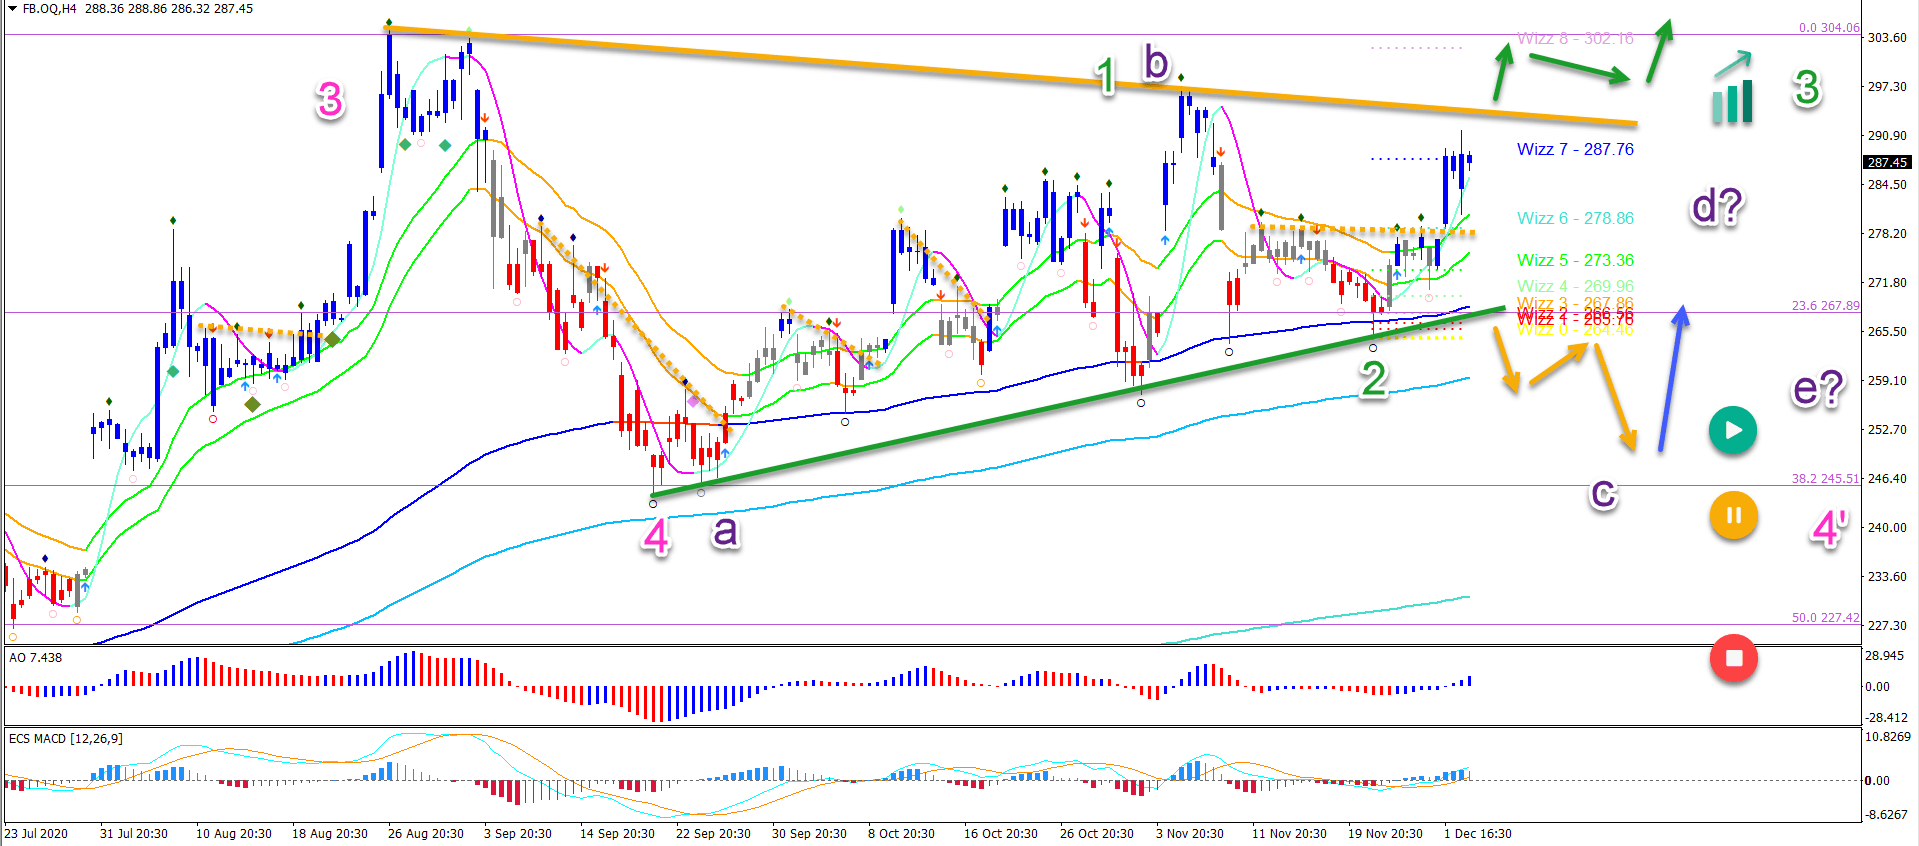
On the 4 hour chart, we see two patterns offered. This will depend on the breakout direction below or above support and resistance.
Bullish break: price is building a 123 wave (green).
Bearish break: price is building a larger wave C (purple) or even an ABCDE triangle.