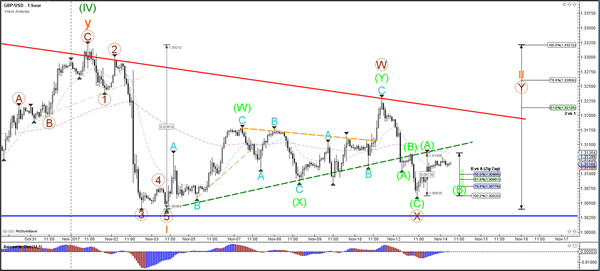
Currency pair GBP/USD
The GBP/USD broke above and below the local triangle pattern (dotted lines) but the major support (blue) and resistance (red) trend lines are still intact. A breakout is needed before a larger directional move can be expected.
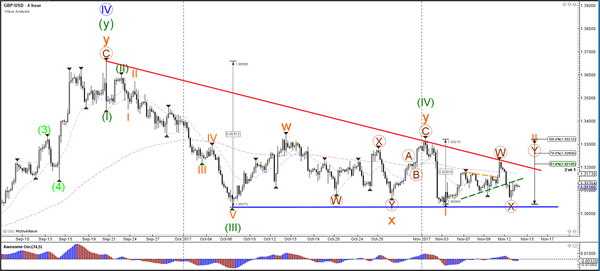
The GBP/USD is probably expanding the correction via an ABC zigzag correction (green) if price stays in between support and resistance trend lines. A break below the 100% Fibonacci level of wave B vs A invalidates the bullish ABC wave.
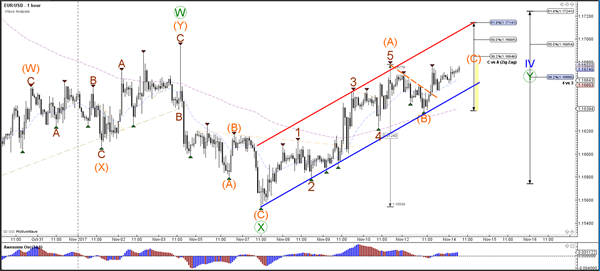
Currency pair EUR/USD
EUR/USD is expanding the wave 4 (blue) bullish retracement within the larger downtrend (red line).The Fibonacci levels of wave 4 (blue) could therefore act as a resistance zone. A break below the support trend line (blue) could indicate a potential bearish breakout within wave 5 (blue) of wave C (purple).
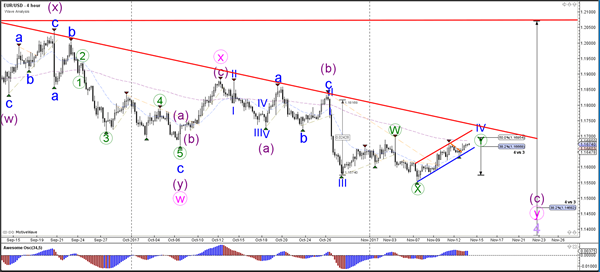
The EUR/USD could be building an ABC (orange) zigzag correction within wave 4 (blue) after itbroke above the local resistance trend line (dotted orange).
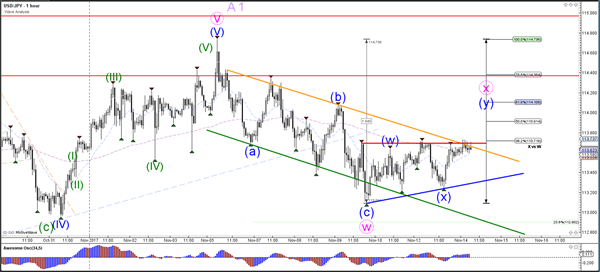
Currency pair USD/JPY
The USD/JPYis still in its choppy bearish trend channel. A bullish breakout could test the resistance levels of wave X (pink). A bearish breakout could test the Fibonacci levels of wave 2 or wave B (light purple).
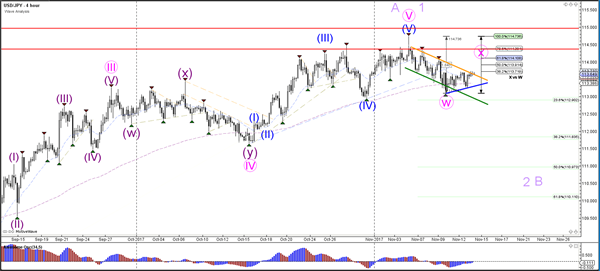
The USD/JPY is testingthe resistance of the bearish channel (orange line) and previous tops (red line).