
This week is full of data for the Antipodeans and fro now, a combination of decent to positive Chinese and Australian data are providing boosts to both the New Zealand Dollar and the Australian Dollar.
The Employment rate for NZ came exactly in line and following consecutive beats for Australian and Chinese PMIs, the export-reliant economies are seeing a revamped economic outlook and this is helping commodities like Oil to reverse some of its downward movement.
In the meanwhile, let’s take a look at multiple timeframe charts for the Aussie as it leads the Forex board in today’s session.
Tonight will see the release of Australian trade balance data at 21:30 ET (expected at 3,250M) and next week (August 12) will see the release of the upcoming Royal Bank of Australia rate decision, with a 99% chance of a cut priced into Markets.
AUDUSD Multi-timeframe Analysis
AUDUSD Daily Chart
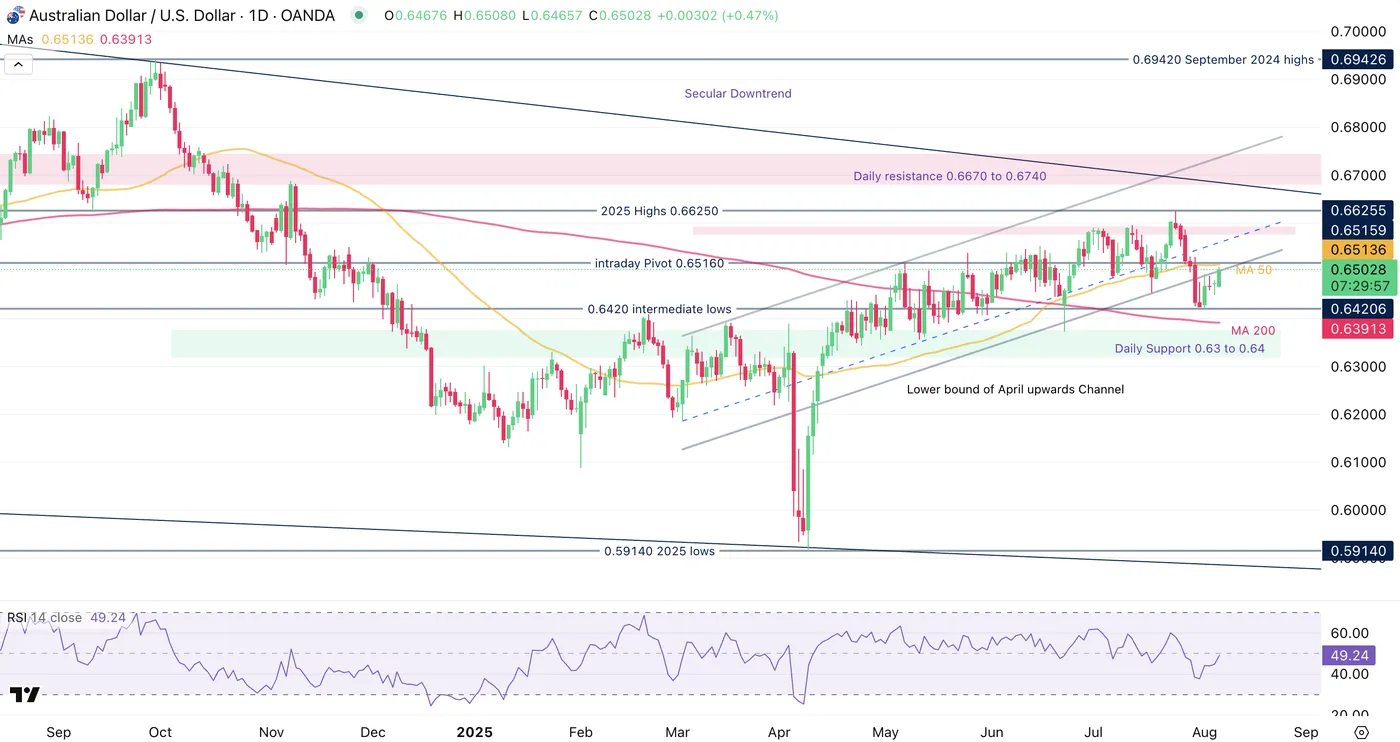
AUDUSD Daily Chart, August 6, 2025 – Source: TradingView
The Aussie is sending mixed signals in Markets between the break of its April ascending channel and the ongoing rally since its lows.
RSI Momentum has came back from bearish territory into neutral levels, pointing to more balanced price action.
The ongoing buying is heading towards the 50-Day MA close to 100 pips above (0.65135) – Testing this one would infer a re-entry into the daily ascending channel and will lead to interesting price action.
Any break retest scenario could still be into play, and to spot higher chances of this happening, it is important to look at if the ongoing USD selloff continues or not.
AUDUSD 8H Chart
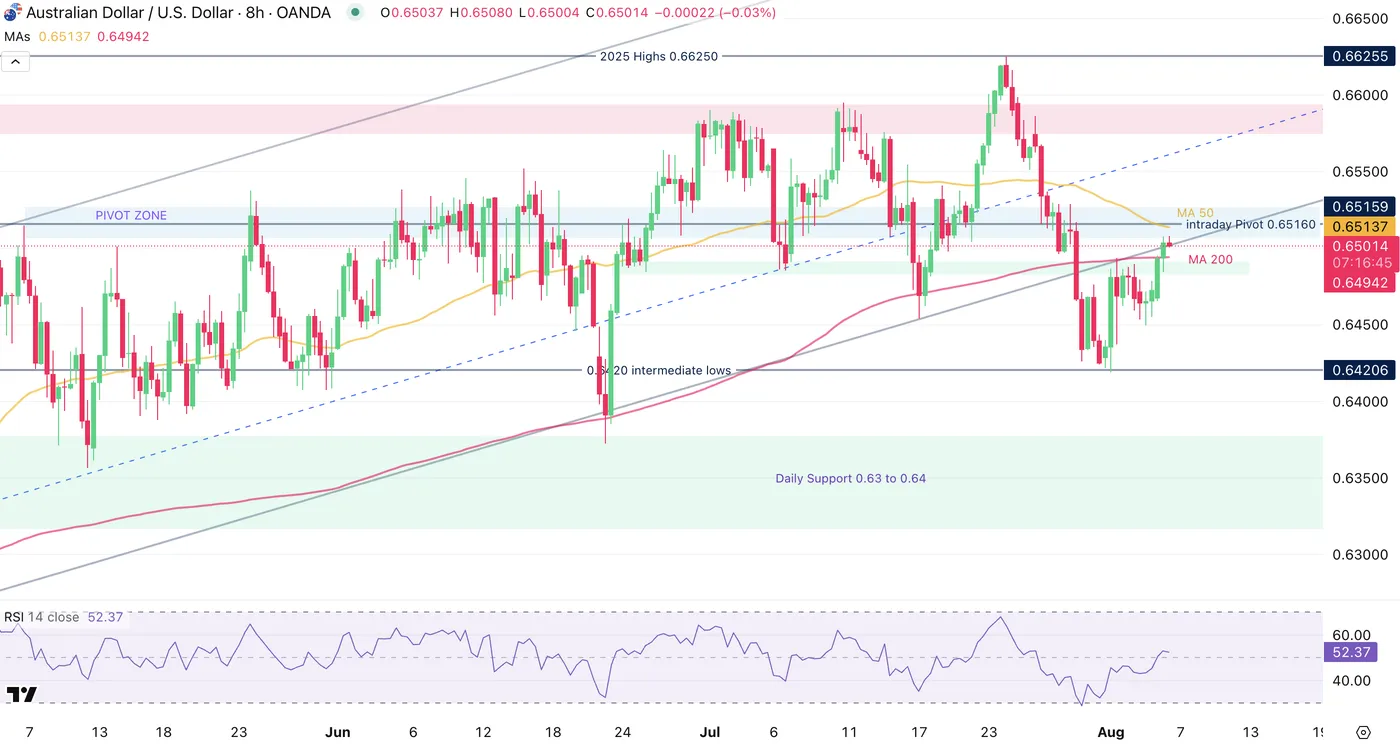
AUDUSD 8H Chart, August 6, 2025 – Source: TradingView
Sellers could be trying to push prices at the lower bound of the upwards broken daily channel, but failure to do so reconfrims the Neutral Bias in the currency pair.
The current action is key for the future outlook – A re-entry within the channel would boost the technical aspect of the AUD.
A failure to re-enter points to more bearish action and failing to break neither the most recent lows (0.6420) or recent swing highs (0.6530) would lead to some consolidation, similar to what we have observed in other currencies like the CHF.
For now, it is essential to watch the reactions between 0.65 (current trading) and 0.65130 to spot if Sellers try to take the hand.
AUDUSD 1H Chart
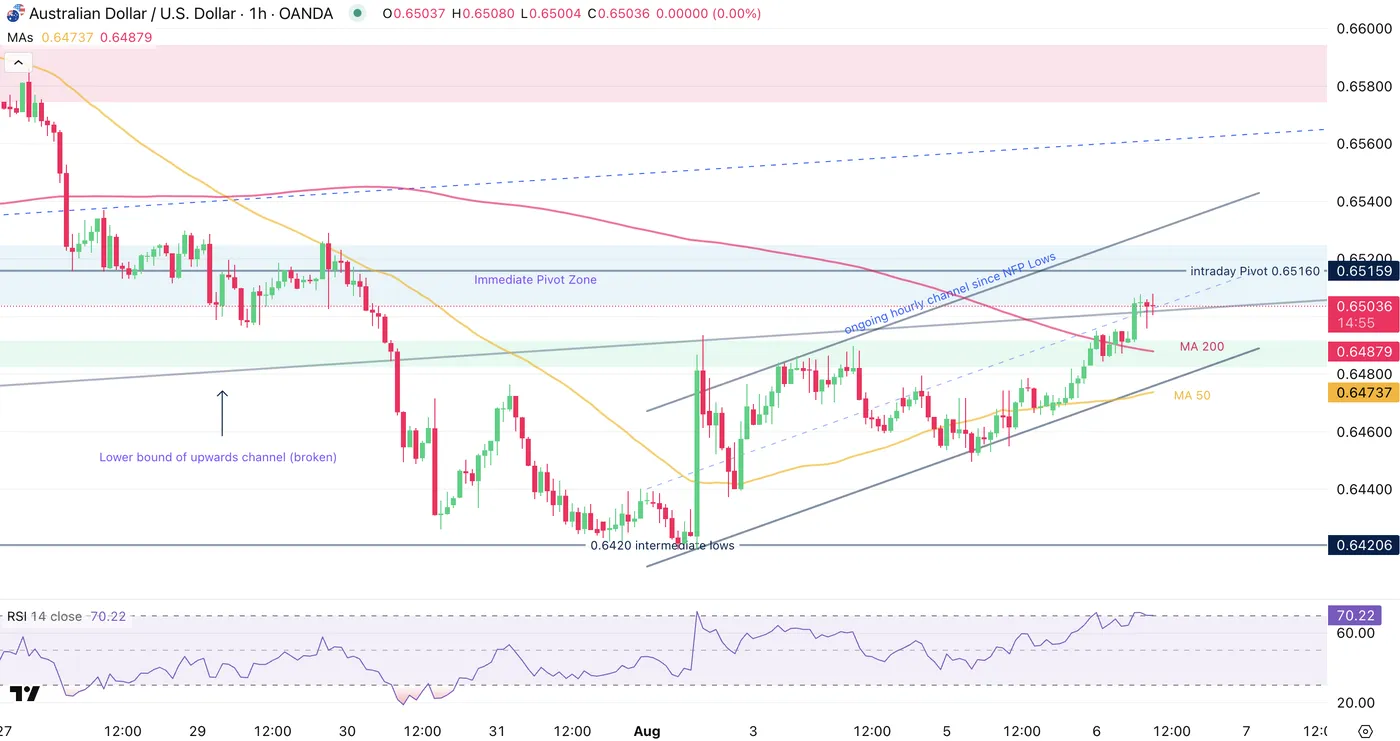
AUDUSD 1H Chart, August 6, 2025 – Source: TradingView
The Aussie has found some relief after the consequential NFP miss (US Jobs data review downwards) and this took up the pair to the ongoing 800 pip rally.
AUD/USD is evolving in an ongoing hourly upwards channel that Buyers will have to hold to counteract the effect of Supply confluence: The 0.65 psychological level, Key Moving averages and the lower bound of the Daily April Channel would be points of entry for sellers.
Failing for sellers to appear would re-confirm the more balanced outlook for the pair.
Levels to place on your charts:
Resistance Levels
- Imminent Pivot Zone 0.65 to 0.6520
- 0.6580 Resistance Zone (+/- 70 pips)
- 2025 highs 0.6625 Resistance Zone
Support Levels
- 0.6470 Confluence of Hourly Channel lows and 1H MA 50
- 0.6420 NFP lows
- Daily Support 0.63 to 0.64
Safe Trades!


