
According to the XBR/USD chart, this morning (19 August) Brent crude oil price is showing bearish momentum, moving towards its lowest level since early summer (set last week). The key bearish drivers in the market include:
→ OPEC+ policy aimed at increasing production;
→ expectations that negotiations to end the war in Ukraine could lead to the lifting of sanctions on Russian oil exports, which would further expand global supply.
Technical Analysis of the XBR/USD Chart
In our analysis on 5 August, we noted that:
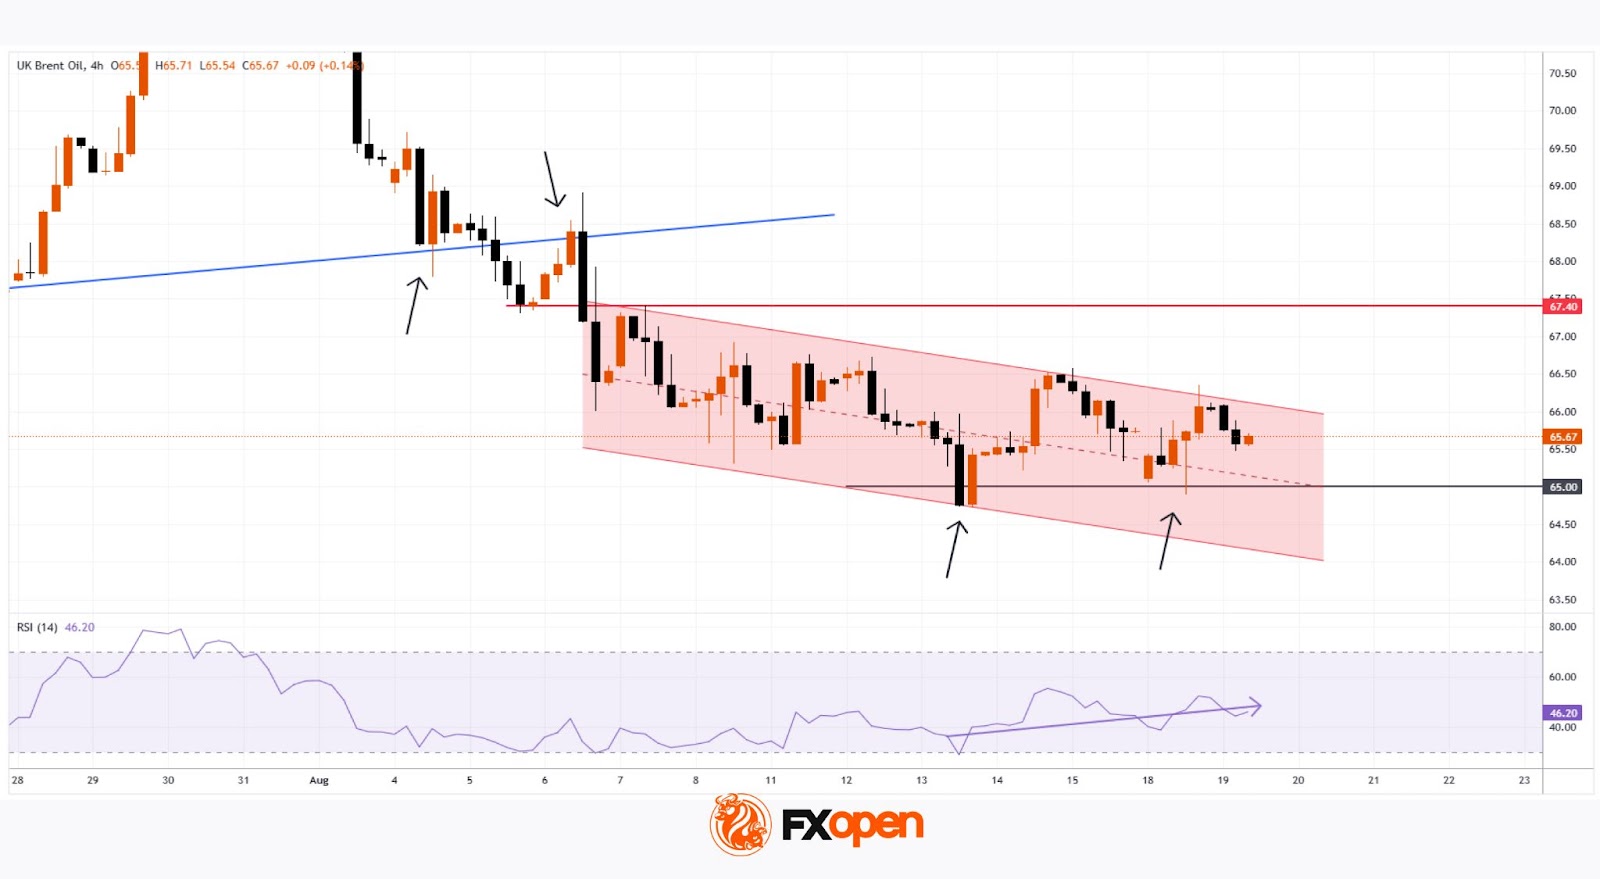
→ Brent crude had fallen to an important support level (marked in blue), which held throughout July;
→ a bearish breakout attempt below the blue support line was possible.
Indeed, in early August the price confirmed a bearish breakout of the blue line, accompanied by signs of rising volatility – the line subsequently reversed its role from support to resistance (as indicated by the arrows on the left-hand side of the chart).
Bears then consolidated their position, continuing to apply pressure and forming a downward channel (shown in red). The question now is whether Brent prices can continue their decline.
From a bullish perspective, there are grounds for demand to strengthen around the key support level at $65.00 (as indicated by the arrows on the right-hand side of the chart):
→ during an attempt to move lower, the chart formed a bullish harami reversal pattern;
→ this level acted as support following the bearish gap at this week’s market opening;
→ yesterday’s long lower shadow highlights aggressive buying activity.
From a bearish perspective, August’s downtrend remains intact – though it may be losing momentum. Note the RSI indicator, which is gradually leaning towards the 50 level (if bears were still firmly in control, it would remain closer to oversold territory).
This suggests that bulls may attempt to seize the initiative and challenge the upper boundary of the descending channel, seeking to offset at least part of Brent’s nearly 10% decline since late July. In this scenario, the $67.40 level – where bears previously demonstrated strong control – could become a critical test of demand resilience.
Tomorrow’s key releases could significantly influence price action: crude oil inventories (15:30 GMT+3) and the FOMC minutes (21:00 GMT+3).
Start trading commodity CFDs with tight spreads. Open your trading account now or learn more about trading commodity CFDs with FXOpen.
This article represents the opinion of the Companies operating under the FXOpen brand only. It is not to be construed as an offer, solicitation, or recommendation with respect to products and services provided by the Companies operating under the FXOpen brand, nor is it to be considered financial advice.


 Brent crude oil price is showing bearish momentum, moving towards its lowest level since early summer (set last week). The key bearish drivers in the market include:)