
Stocks have begun December trading on a muted note, though far from the bearish trajectory that defined much of November.
December is historically a month where investors anticipate gains—a phenomenon known as the “December Effect” or the “Santa Claus Rally.” This seasonal strength is typically driven by three core catalysts:
- Corporate Stock Buybacks: Companies rushing to complete buyback programs reduce the supply of outstanding shares, naturally pulling prices higher.
- Year-End Bonuses: As workers receive year-end payouts, fresh capital often flows into investment accounts, boosting demand.
- Psychological Momentum: A self-fulfilling prophecy where traders, anticipating a rise, buy in early, thereby driving the market higher.
However, in this beginning of December trading, a divergence is emerging.
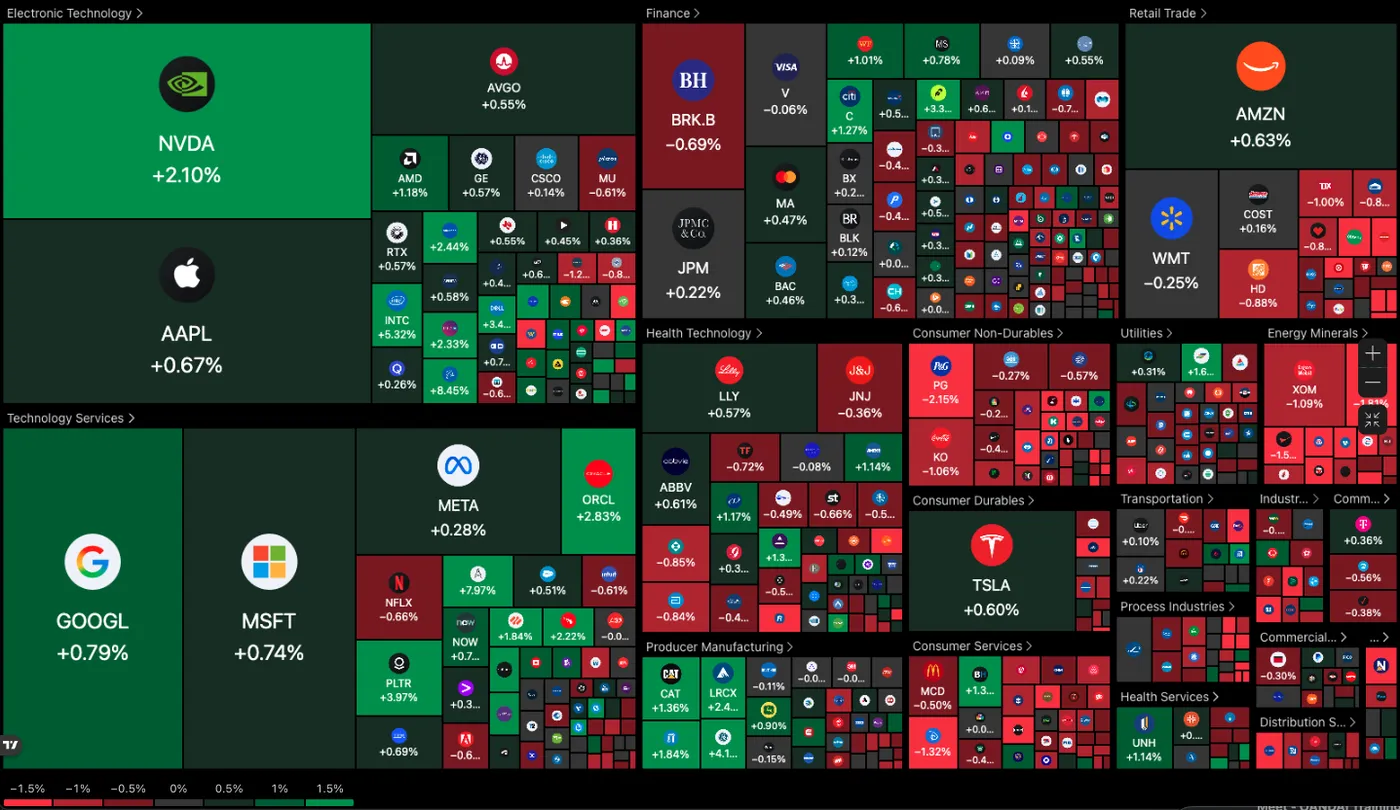
US Equity Heatmap (10:21) – December 2, 2025 – Source: TradingView
Despite Tech rebounding with resilient dip-buying, traditional sectors have struggled to maintain strong momentum – Look at how red the picture is in Consumer Cyclicals, Defensive, Utilities and Energy.
Some spirits are awakening as I am about to publish this piece
The culprit lies in the data: the ISM Manufacturing PMI came in lower yesterday at 48.2 (vs. 48.6 expected).
This miss is a stark sign that US industrial activity is still being hurt by the new Trump policies and angst relating to tariffs, with the sector hanging solidly in contraction territory (below 50) since March.
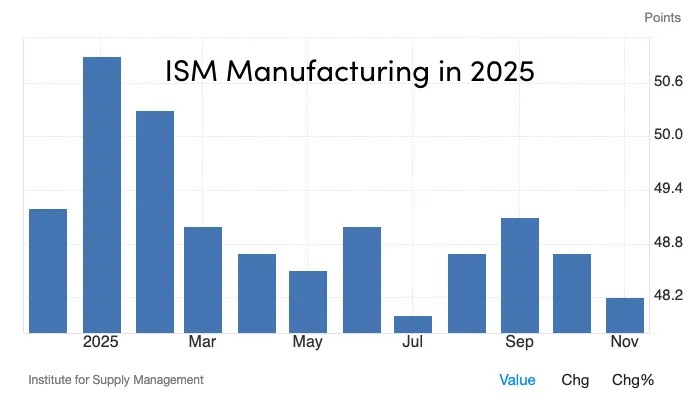
US Manufacturing PMI in 2025 – Source: TradingEconomics
While traders await more Santa Claus buying (which may arrive after the December 10 FOMC, if it comes) let’s get ready by taking a close look at the Dow Jones through a multi-timeframe technical analysis.
Dow Jones (DJIA) Multi-Timeframe Analysis
Daily Chart
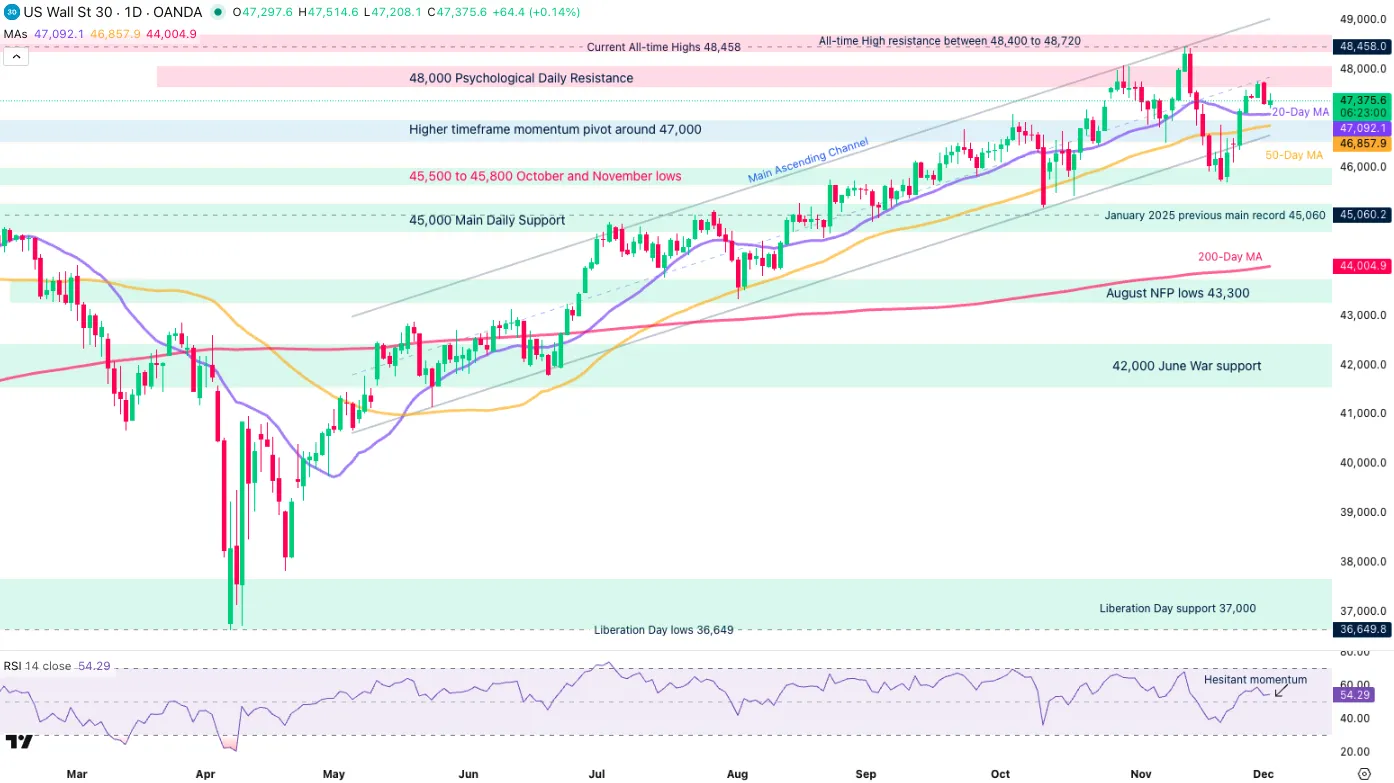
Dow Jones Daily Chart, December 2, 2025 – Source: TradingView
After a first red session for the Dow in December, bears are fighting to defend the 48,000 from trading.
The past month of correction has balanced momentum quite suddenly, taking the key 20 (47,090) and 50 Day (46,870) Moving Averages from upward sloping to their current flat level.
Still, any pullback lower could point to a test of these MAs which will have to act as support to relaunch more optimistic flows in Wall Street – After all, the long-run uptrend remains intact as we still evolve within the May Monthly upward channel.
RSI also supports the more balanced momentum outlook, hanging below 55 (45 to 55 shows neutral, directionless momentum).
Expect a range between 46,900 to 47,700 all the way to the December FOMC.
4H Chart and Technical levels
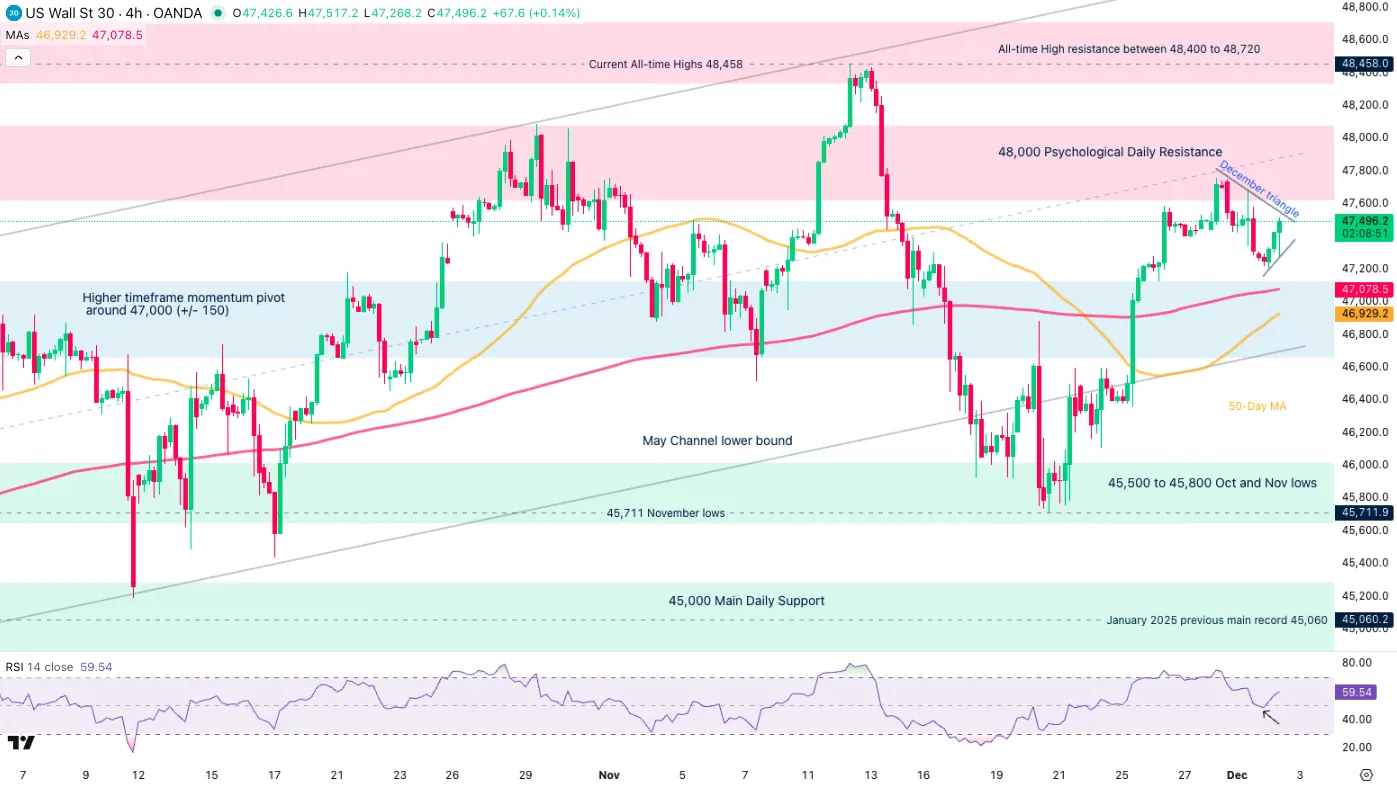
Dow Jones 4H Chart, December 2, 2025 – Source: TradingView
Some Christmas spirits are awakening with the current 4H Candle taking some traction and RSI momentum tilting higher.
Bulls will still have to breach the 47,746 highs from the Monthly open to invalidate the Rangebound conditions seen on the daily timeframe.
Dow Jones technical levels of interest:
Resistance Levels
- Current All-time Highs 48,458
- 48,000 Psychological Daily Resistance (+/- 200 points)
- Weekly high 47,747
- All-time High resistance between 48,400 to 48,720
Support Levels
- Session lows 47,200
- Higher timeframe momentum pivot around 47,000 (+/- 150)
- 45,500 to 45,800 Oct and Nov lows Support
- January 2025 All-time high 45,000 & Psychological zone (+/- 150)
1H Chart
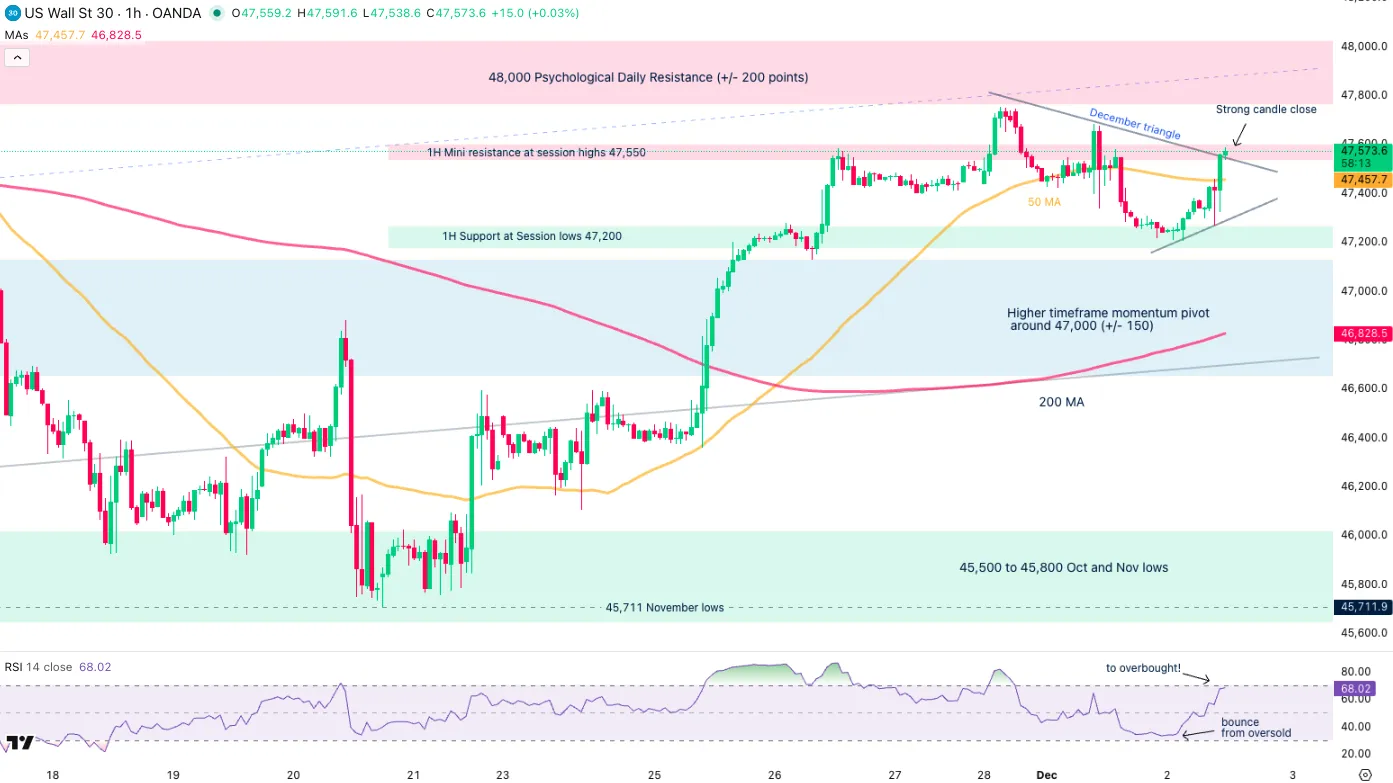
Dow Jones 1H Chart, December 2, 2025 – Source: TradingView
The current 1H Candle is a very strong one, but faces a test of the December triangle formation upper bound at a confluence with the 45,600 hourly resistance.
Breaking this points to at least a test of the Weekly highs, a 15M candle close above the level would suffice to take the intraday momentum in hand.
Failing to do so would invite the bears to defend the short-timeframe triangle formation.


 let's get ready by taking a close look at the Dow Jones through a multi-timeframe technical analysis.)