
The Debasement Trade continues to roar today.
Despite slowing inflows into Cryptocurrencies and Stocks sending mixed signals since Friday, Metals are shining bright.
As observed in our Overnight brief, Silver has exploded to yet another fresh record at $66, surpassing targets explored in our pre-FOMC analysis. There are some technical warnings arising however,
Platinum is also profiting massively from these inflows, finally breaking its 2011 highs of $1,915.
More rare than Gold, the White Metal is now standing just 15% away from its 2008 All-Time Highs ($2,300) and appears on track to test that historic level.
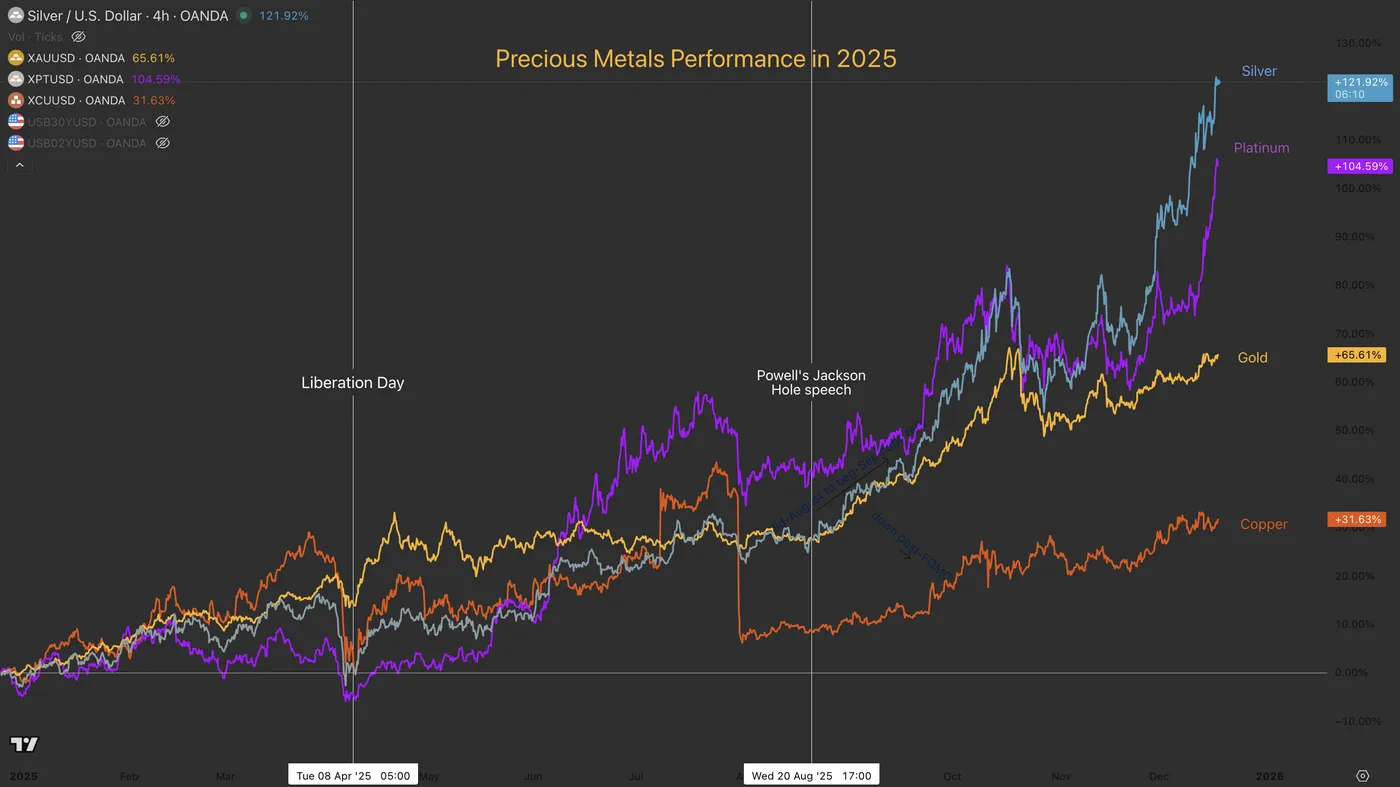
Metal Performance in 2025. December 17, 2025 – Source: TradingView. Spot the accelerations after Liberation Day and Powell’s Jackson Hole Speech.
Why are metals rallying again?
The answer lies in the aftermath of the recent Non-Farm Payrolls report.
While the Unemployment Rate ticked higher, overall employment levels still do not guarantee a Fed cut in January. This policy ambiguity, combined with lingering doubts regarding the future path of the economy, is bolstering demand for precious metals as primary safe havens amidst the uncertainty.
However, the picture may only clear up after tomorrow’s high-importance CPI report.
Let’s dive into a multi-timeframe analysis (Monthly and Intraday) of Silver and Platinum to spot what technical levels and signals are arising.
Silver (XAG/USD) Monthly Chart
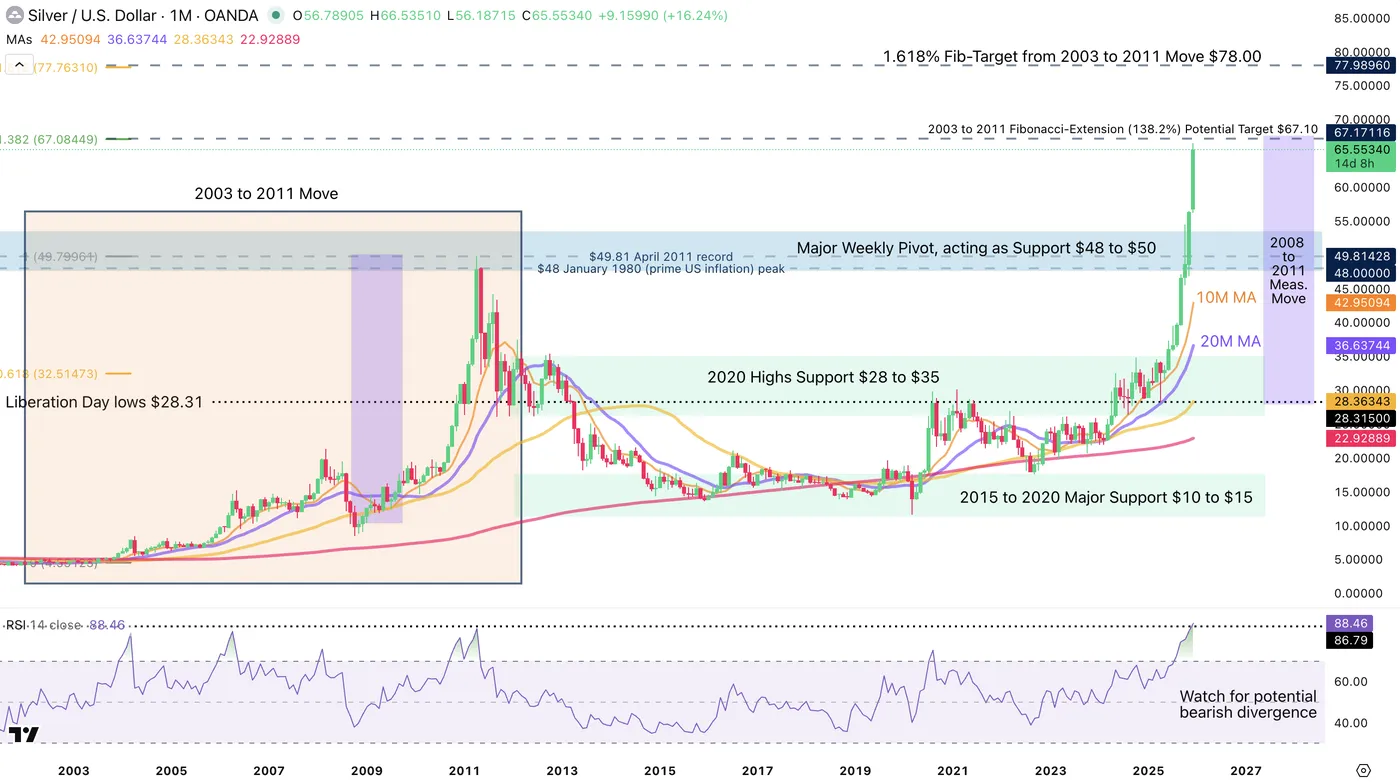
Silver (XAG/USD) Monthly Chart. December 17, 2025 – Source: TradingView
Silver is exploding to its record prices in quite a high fashion.
The Monthly chart offers a stellar view of how significant the move is.
Up 100% since June, what recently were historic peaks are now far-away.
The $48 to $53 zone acts as a major high timeframe pivot of the price action in the event of any retracement.
Moving below could trigger a huge bearish event, while holding above in a retest would allow for a significant dip-buying opportunity.
Keep an eye on Weekly RSI bearish divergence if a top forms anywhere near current levels.
A Fibonacci-Extension from the 2003 to 2011 could point to $67.10 potentially acting as major resistance, particularly with the current breakout reaching similar stretches as the 2008-2011 move (purple squares)
Silver (XAG/USD) 4H Chart and Technical Levels
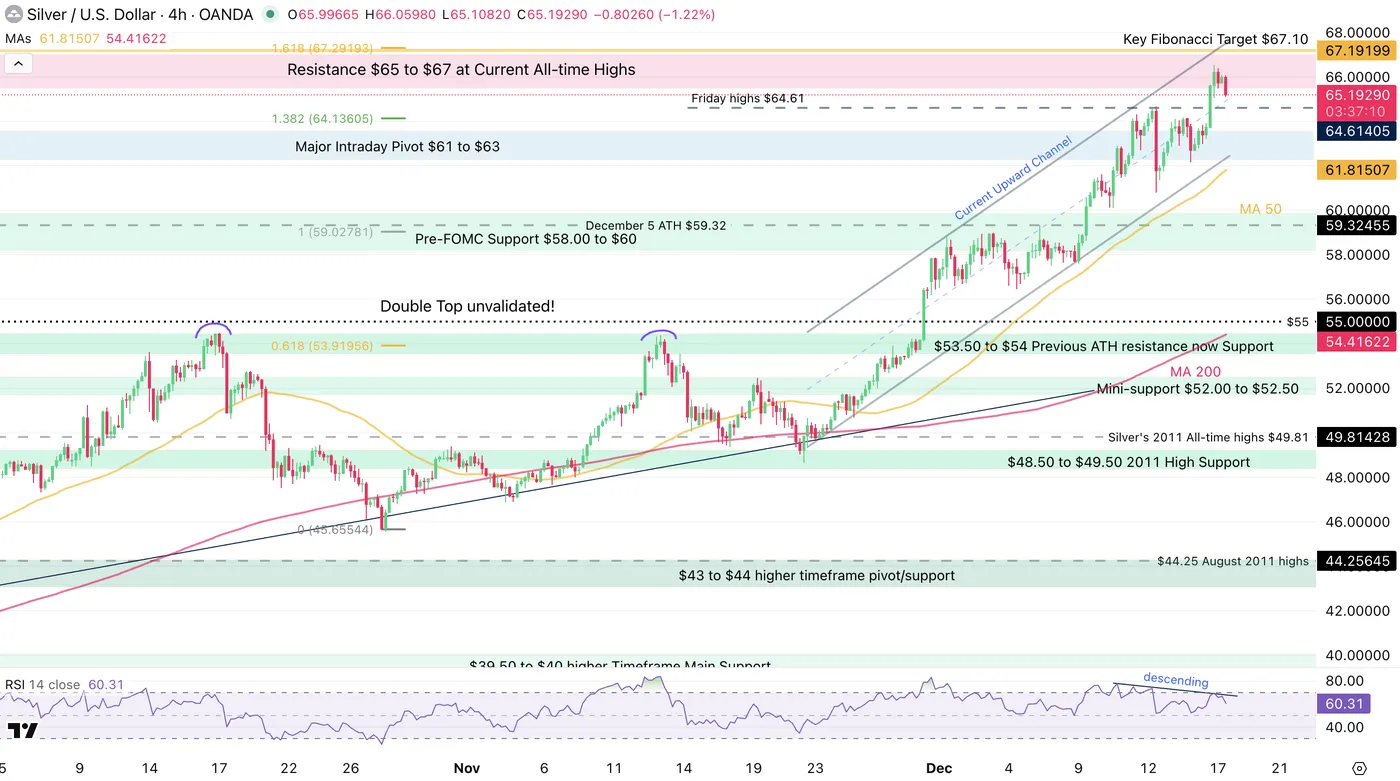
Silver (XAG/USD) 4H Chart. December 17, 2025 – Source: TradingView
Silver is still evolving within its intraday upward channel.
Keep an eye on how it reacts to its boundaries. Currently at its highs, some profit-taking (Selling) flows could arise.
Naturally, watch for a potential breakout to the upside or downside depending on tomorrow’s CPI!
Levels to watch for Silver (XAG/USD) trading:
Resistance Levels:
- Resistance $65 to $67 at Current All-time Highs
- Key Fibonacci Target $67.10
- 1.618% Potential Fib-Target from 2003 to 2011 Move $78.00
- $66.53 session highs
Support Levels:
- Major Intraday Pivot $61 to $63
- Pre-FOMC Support $58.00 to $60
- $53.50 to $54 Previous ATH resistance now Support
- Major Weekly Pivot, acting as Support $48 to $50
- $45 October Lows
Platinum (XPT/USD) Monthly Chart
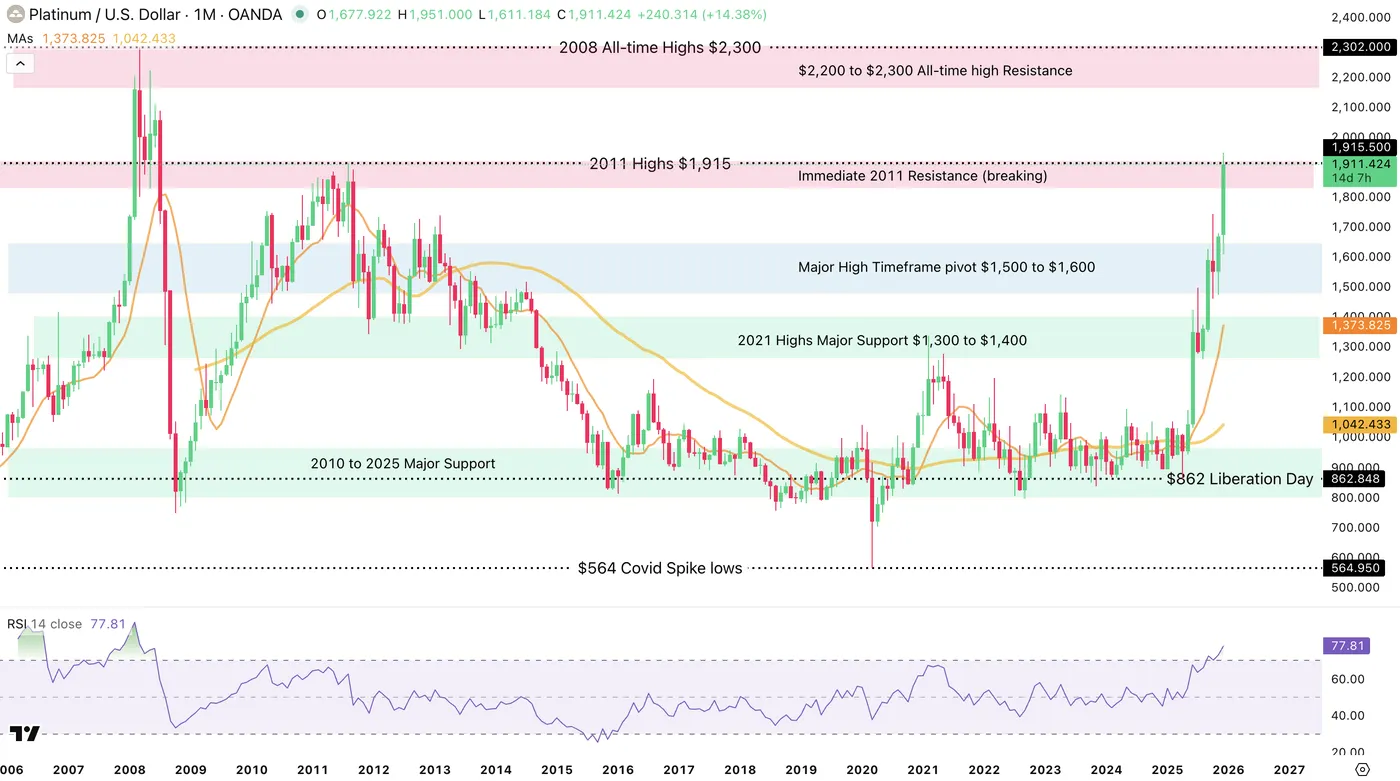
Platinum (XPT/USD) Monthly Chart. December 17, 2025 – Source: TradingView
Platinum is a late bloomer within the current Metal Supercycle, but it’s catching up to its peers quite fast.
Our previous analysis of the Metal pointed to the idea of Platinum potentially catching up to Gold. Necessary for many technological developments, its demand should keep increasing throughout the years – But what prevents it from reaching similar levels to Gold is Central Bank demand (A huge fundamental boost to all metals since 2025).
After stalling its ascent while Silver and Gold advanced, bulls are now breaking above its 2008 highs.
Inflows into the metal are still dependent on other metals such as Gold or Silver advancing further, but XPT/USD could offer a very interesting option for those who missed the rally in the yellow and grey precious metals.
From what it looks like, the current rally is occurring on these flows. To get more details of Platinum fundamentals, I strongly invite you to check out our End-November analysis.
Platinum (XPT/USD) 4H Chart and Technical Levels

Platinum (XPT/USD) 4H Chart. December 17, 2025 – Source: TradingView
XPT/USD has broken out to the upside from its 2025 ascending channel.
The ongoing move is a very strong one (look at how steep the current uptrend is.)
Some small profit-taking flows are occurring at overbought levels, indicative of a prompt retracement – The new 14 year highs are at $1,950 and breaking higher would see no resistance until $2,050 to $2,100.
For dip-buyers, keep a close look at how the metal reacts to the retest of the 2025 highs upper bound at $1,850.
The same occurred in Silver and led to a 100% move since.
Platinum Technical Levels to keep on your charts:
Resistance levels
- Immediate Resistance at 2011 Highs $1910 to $1,950 (breaking?)
- Session highs $1,950
- May 2008 Pivotal Resistance $2,050 to $2,100
- $2,300 2008 All-time highs
Support levels
- 2025 Channel upper bound $1,850 (Mini-Support)
- 2013 and Current year highs $1,700 to $1,750
- $1,620 to $1,650 FOMC Support
- Major High Timeframe pivot $1,500 to $1,600
Safe Trades!


