
Key Highlights
- Bitcoin failed to recover above $90,000 and $90,500.
- BTC/USD is trading below a bearish trend line with resistance at $90,000 on the 4-hour chart.
- Ethereum failed to settle above $3,050 and trimmed some gains.
- XRP price is struggling to settle above the $2.00 resistance.
Bitcoin Price Technical Analysis
Bitcoin price found support near $85,500 and started a recovery wave against the US Dollar. BTC climbed above $87,500 and $88,000 to enter a short-term positive zone.
Looking at the 4-hour chart, the price even surpassed $90,000 before it faced sellers near $90,550. The price started to decline below $89,000. There was a spike below the 50% Fib retracement level of the recovery wave from the $84,384 swing low to the $90,556 high.
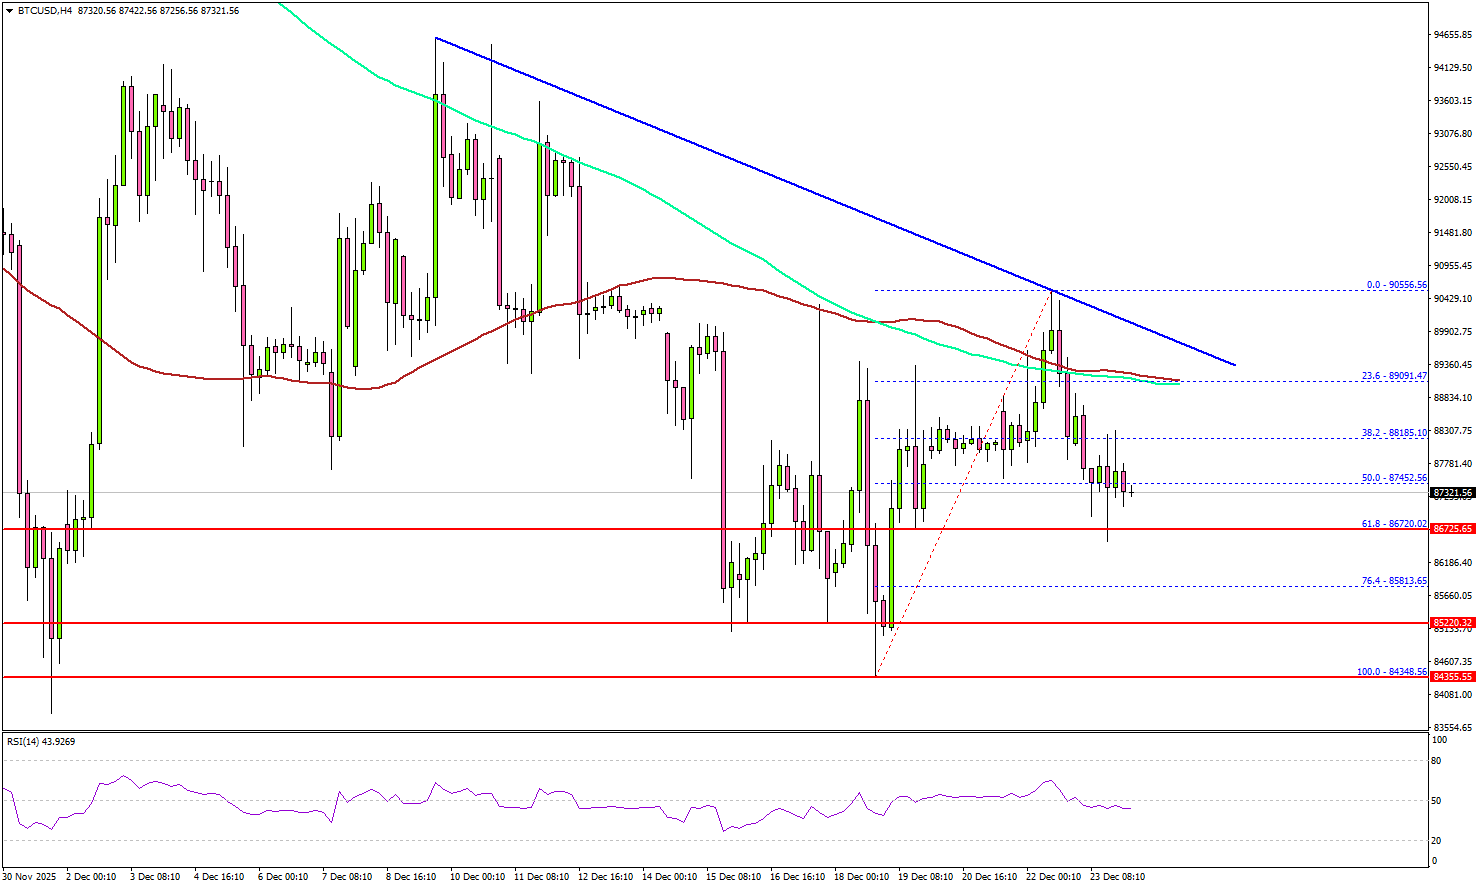
BTC is now trading below a bearish trend line with resistance at $90,000, the 100 simple moving average (red, 4-hour), and the 200 simple moving average (green, 4-hour).
Immediate support sits at $86,800. A downside break below $86,800 might start another decline. The next major support is $85,200. Any more losses might call for an extended decline toward the $83,500 support zone.
If there is another increase, the price could face resistance near the 100 simple moving average (red, 4-hour) at $89,000. The first key hurdle is near the trend line and $90,000.
A successful close above $90,000 might start another steady increase. In the stated case, the price may perhaps rise toward the $92,500 level. Any more gains might call for a test of $94,000.
Looking at Ethereum, the price failed to settle above $3,050 and recently dipped below $3,000 to enter a bearish zone.
Today’s Key Economic Releases
- US Initial Jobless Claims – Forecast 223K, versus 224K previous.


