
Key takeaways
- US dollar under pressure as “sell America” narrative builds: Escalating US foreign policy tensions with NATO/EU allies over Greenland have driven a second straight session of USD weakness, with AUD and NZD outperforming most majors.
- AUD/USD breaks higher with bullish momentum: The pair has cleared the 0.6720–0.6730 resistance zone, resuming its bullish impulsive move within a broader medium-term uptrend, with 0.6760 as the next upside trigger.
- Technical and macro signals reinforce the bullish bias: A bullish engulfing pattern, supportive momentum indicators, and a widening Australia–US 2-year yield spread all argue for further AUD/USD upside unless 0.6690 support fails.
The US dollar has dropped for the second consecutive session after the latest US hostile foreign policy towards its long-time allies, where US President Trump threatened the eight NATO/EU members, which include Germany, France, and the UK, that objected to the US’s strong push to purchase Greenland, a resource-rich Arctic territory under Denmark’s autonomous control.
The US dollar fared the worst against the NZD (-0.5%) and the AUD (-0.3%) among major currencies on a 1-day rolling basis, but managed to buck the trend against the Japanese yen, where the greenback recorded an intraday gain of 0.2% due to the upcoming snap election in Japan on February 8 that may prevent the Bank of Japan (BoJ) issue a hawkish monetary policy guidance on its rate setting meeting this Friday, January 23 (see Fig. 1).
US dollar performance against major currencies
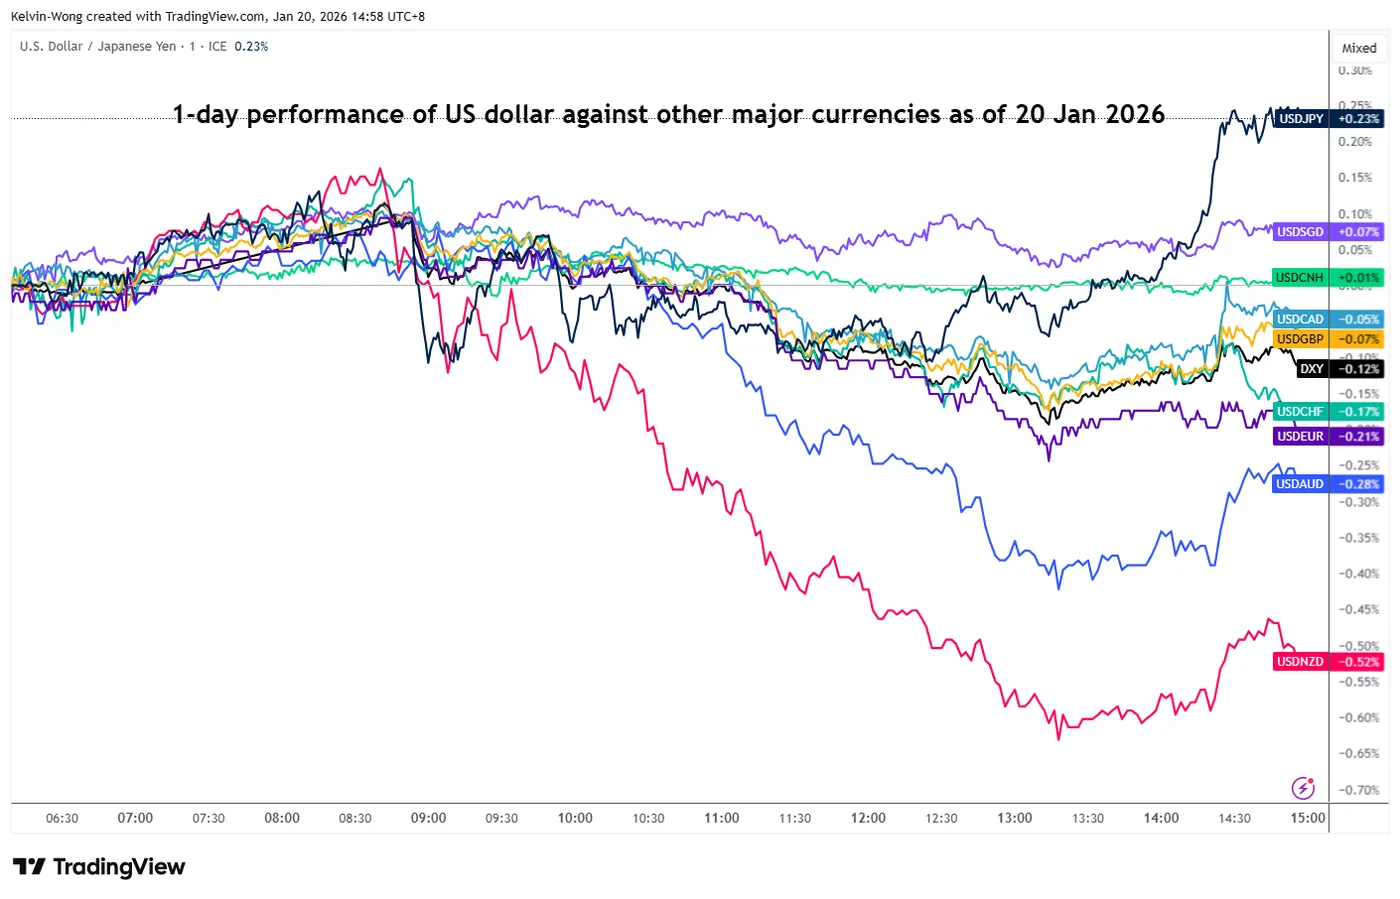
Fig. 1: 1-day rolling performance of the US dollar against major currencies as of 20 Jan 2026 (Source: TradingView)
Let us now focus on the short-term (1 to 3 days) technical trend and key levels to watch on the AUD/USD
AUD/USD: Bullish impulsive sequence resumes within medium-term uptrend
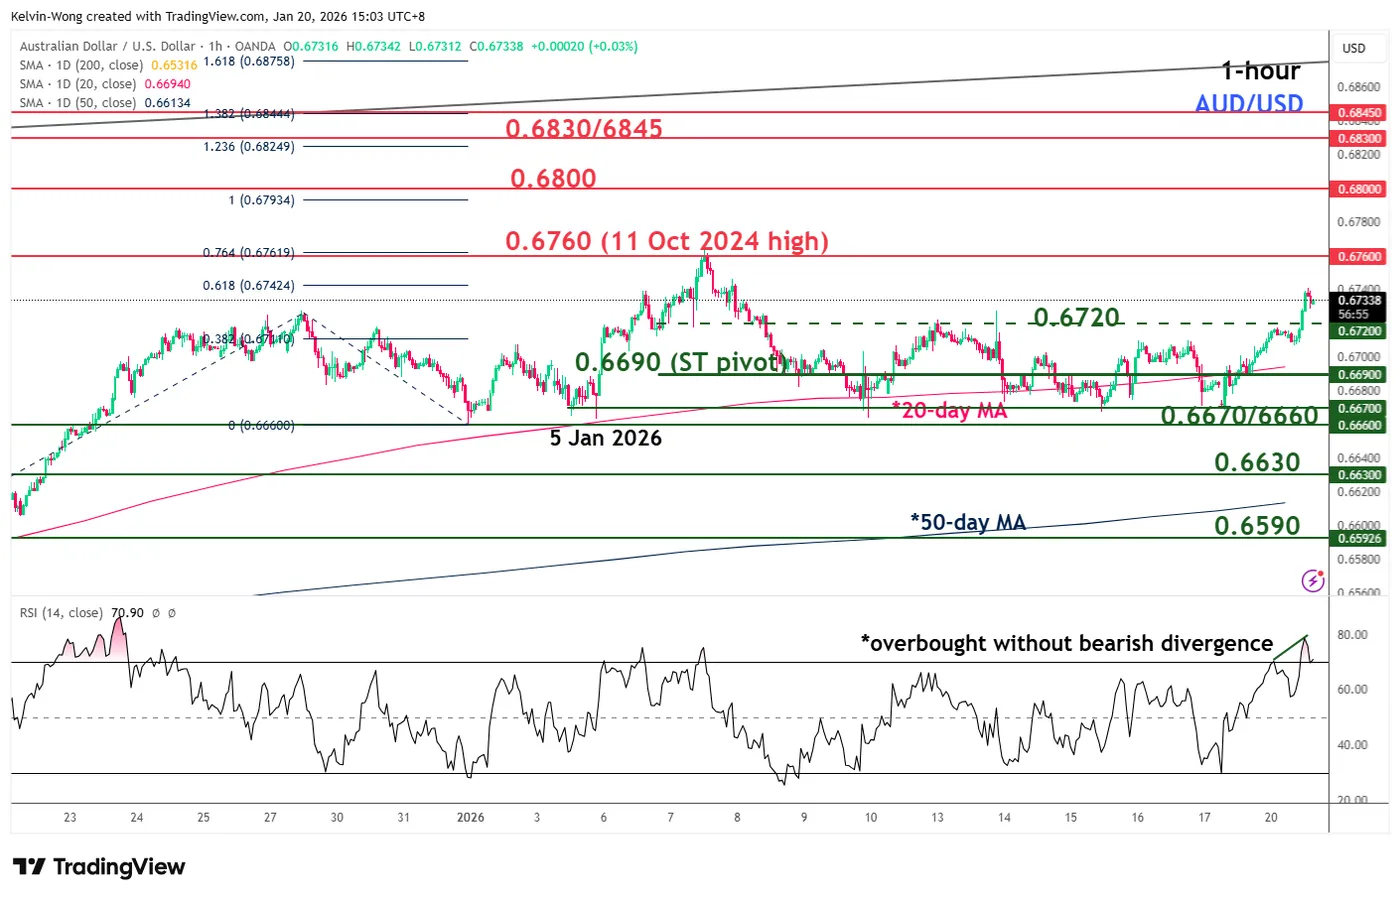
Fig. 2: AUD/USD minor trend as of 20 Jan 2026 (Source: TradingView)
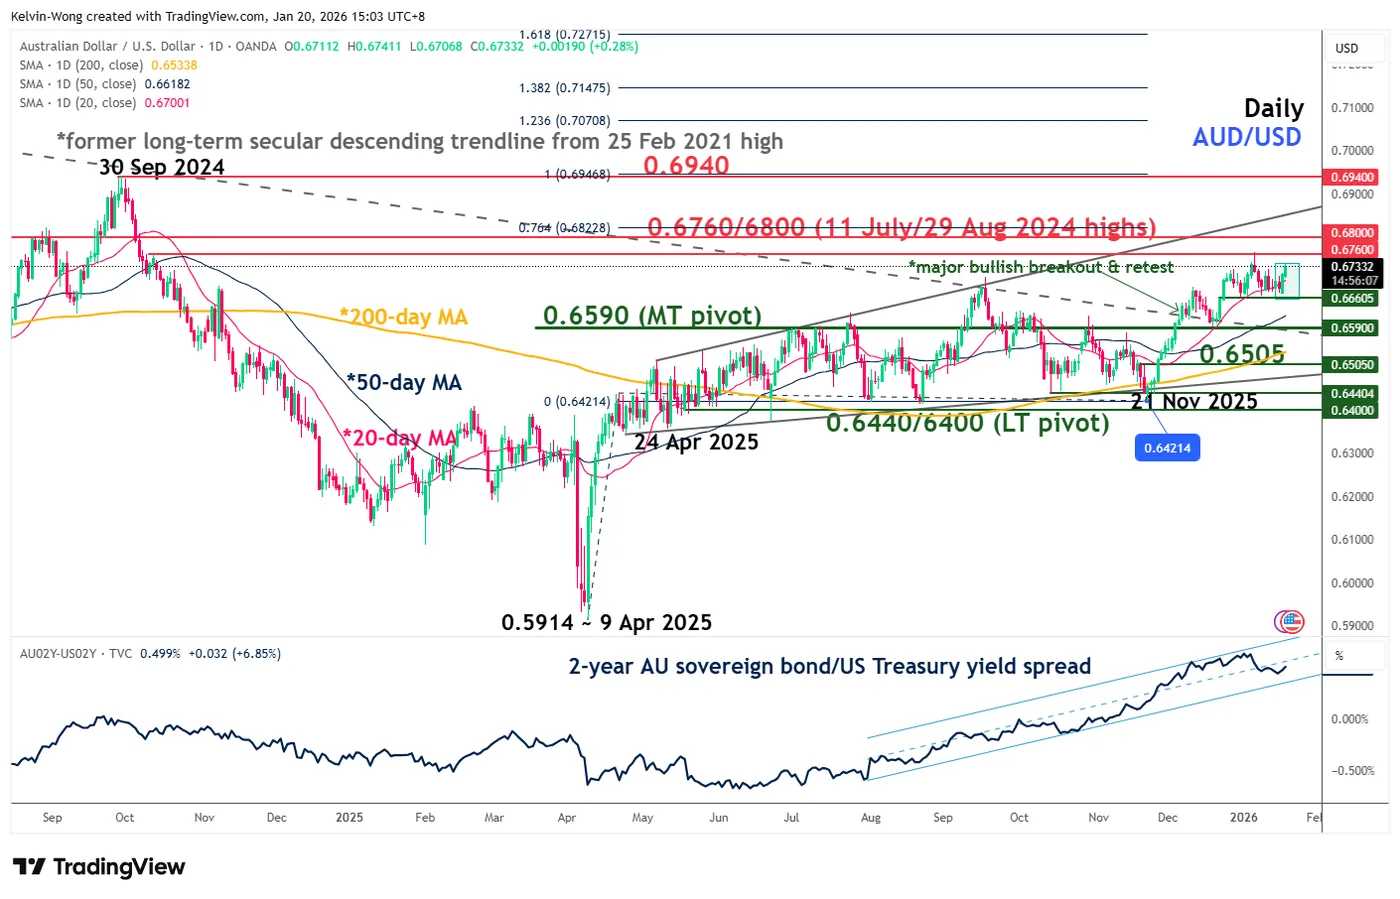
Fig. 3: AUD/USD medium-term trend as of 20 Jan 2026 (Source: TradingView)
Watch the 0.6690 short-term pivotal support (also the 20-day moving average). A clearance above 0.6760 is likely to see the next intermediate resistances come in at 0.6800 and 0.6830/6845 (see Fig. 2).
However, a break with an hourly close below 0.6690 invalidates the bullish breakout for another round of choppy minor corrective decline to retest the 0.6670/6600 minor range support. Failure to hold at 0.6660 may extend the decline to expose the next intermediate supports at 0.6630 and 0.6590 (also the close to the 50-day moving average).
Key elements to support the bullish bias on AUD/USD
- Today’s bullish breakout above 0.6720 has come after the formation of Monday, January 20’s daily “Bullish Engulfing” candlestick after a retest on the 20-day moving average (see Fig. 3).
- The hourly RSI momentum indicator has reached the overbought region, but without any bearish divergence condition.
- The monetary policy-sensitive yield spread of the 2-year Australian sovereign bond over the 2-year US Treasury note has rebounded to 0.50% from 0.43% printed on last Friday, January 16. The widening of the yield spread premium supports a further potential up move on the AUD/USD.


