
Key takeaways
Suspected FX intervention jolts USD/JPY: After briefly spiking above 159 following BoJ comments, USD/JPY plunged nearly 200 pips within minutes to ~157.30 with no data catalyst, strongly suggesting intervention or rate-checking by Japanese authorities.
Momentum signals warn of a trend shift: A bearish RSI divergence on the daily chart flags rising risk of a medium-term reversal after the uptrend since April 2025, with near-term downside pressure building.
Key levels define the next move: A break below 157.50 opens downside toward 157.00 and 156.12, while a sustained move above 159.75 would invalidate the bearish view and revive squeeze risks toward 160.25–161.10.
Since our last report, the USD/JPY dropped marginally to our highlighted first intermediate support at 157.50 (printed at an intraday low of 157.42 on 19 January 2026 before it traded sideways between 158.50 and 157.50 for the entire week.
During today’s Bank of Japan (BoJ) Governor Ueda’s post-monetary policy meeting press conference, the USD/JPY has staged an intra-session break above the 158.50 printed an intraday high of 159.23 at the 3.00 pm (Singapore time) hour mark as speculators tried to sell the Japanese yen on the backdrop that Ueda mentioned that BoJ may coordinate with the government on the JGB market to encourage stability in the JGB yields, which implied that BoJ may restart its bond purchases programme that can put downside pressure on the JPY.
A swift intra-session plunge of 1.2% in USD/JPY smells of intervention
Interestingly and swiftly, the USD/JPY plummeted by 191 pips (-1.2%) within the next five minutes from 159.22 to hit an intra-session low of 157.32 at the time of writing without any relevant economic data releases or news flow.
This current swift and erratic movement on the USD/JPY has a lingering smell of intervention or rate checking by Japanese banks under the instruction of the BoJ and or the Ministry of Finance because the recent rounds of verbal intervention by Finance Minister Katayama and the BoJ last intervened in the FX market to sell the USD and buy back the yen was on 12 July 2024 when the USD/JPY hit an intraday high of 159.45.
Let’s now look at the charts.
USD/JPY has formed a daily bearish divergence on its RSI
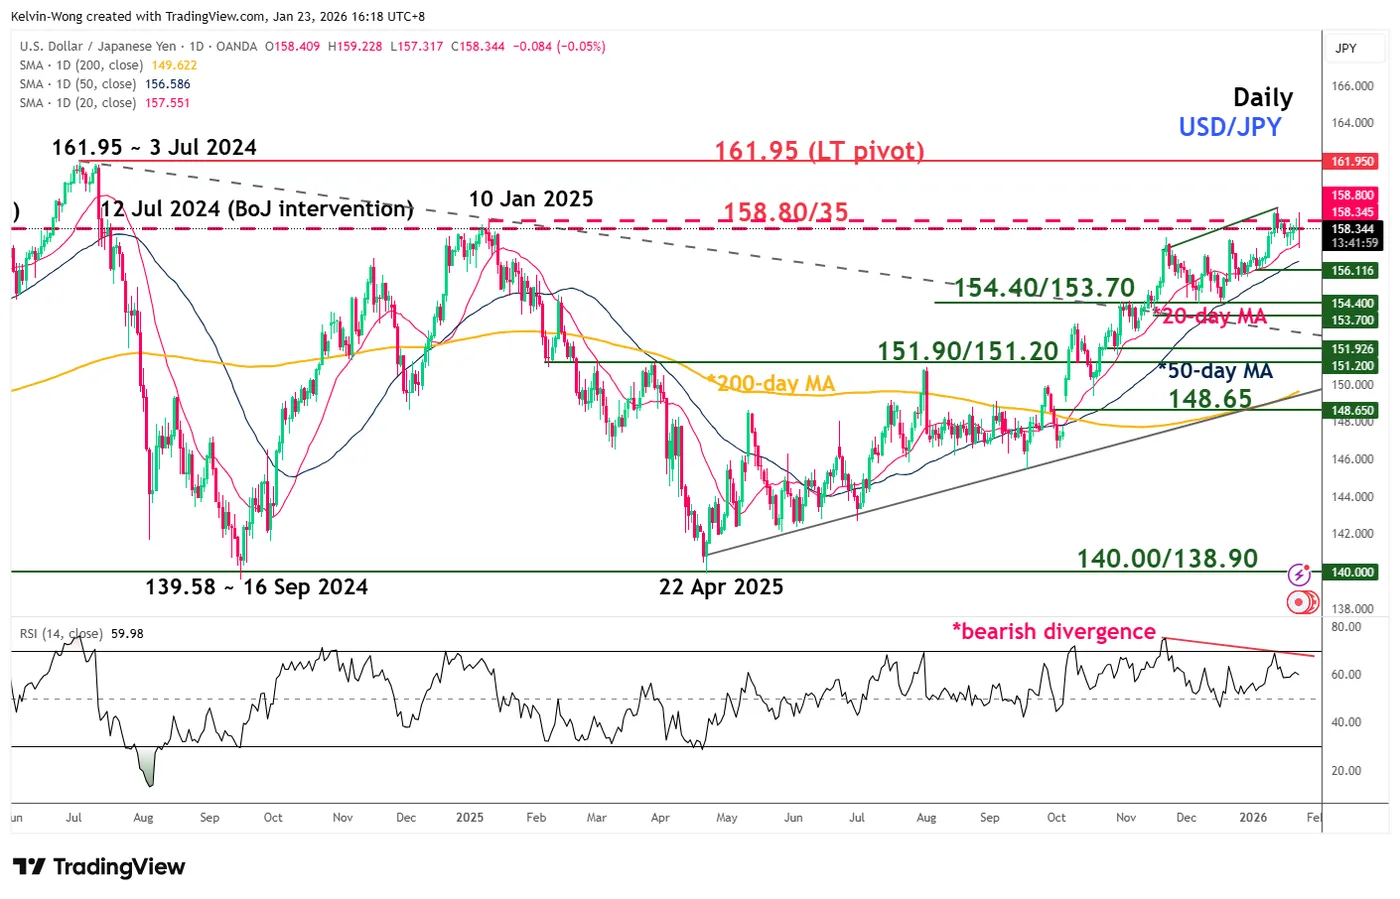
Fig. 1: USD/JPY medium-term & major trends as of 23 Jan 2026 (Source: TradingView)
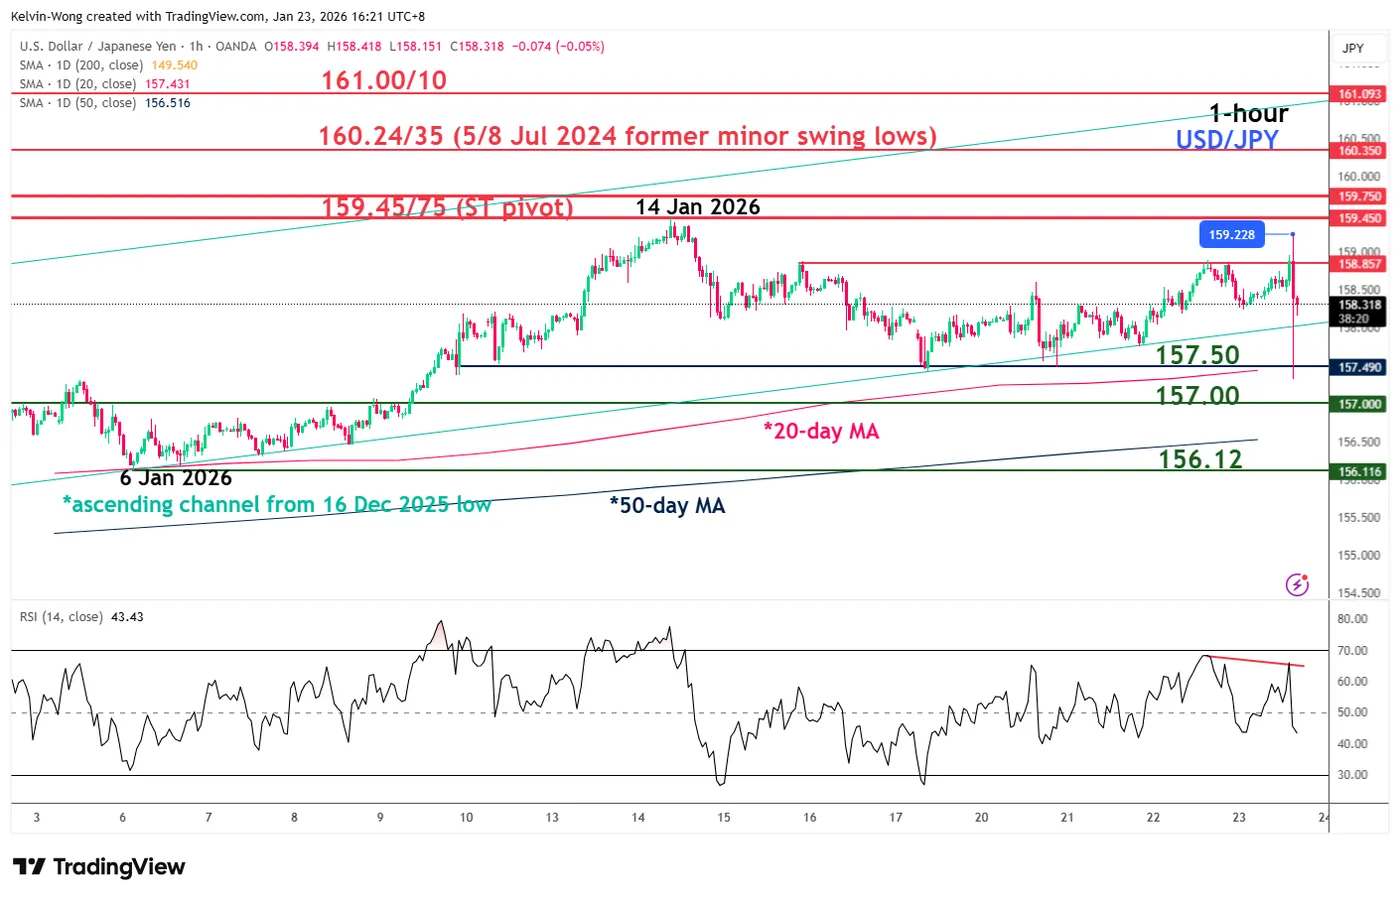
Fig. 2: USD/JPY minor trend as of 23 Jan 2026 (Source: TradingView)
The daily RSI momentum indicator of the USD/JPY has flashed out an impending bearish divergence condition at its overbought region, which suggests that the medium-term uptrend in place since 22 April 2025 low is at risk of staging a medium-term (multi-week) bearish reversal (see Fig. 1).
In the short-term (1 to 3 days), watch the 159.45/159.75 key short-term pivotal resistance, and a break below 157.50 (also the 20-day moving average) may trigger a potential push down to expose the next intermediate supports at 157.00 and 156.12 in the first step (see Fig. 2).
However, a clearance and an hourly close above 159.75 invalidates the bearish scenario for a potential squeeze up towards 160.24/160.35 and even 161.00/161.10 (upper limit of intervention risk zone).


