
- Bitcoin breaks lower and drags pessimistic sentiment in Cryptocurrencies
- With the current volatile environment, investors reduce risk-positioning
- Observing technical analysis for Bitcoin, Ethereum and Solana
Cryptocurrencies are struggling after rejecting early-year rebound attempts.
Risk sentiment remains weak even as equities hover near all-time highs: Investors are reducing exposure to risk-sensitive assets, mirroring the underperformance in semiconductor and tech sectors as high-beta capital rotates back into hardware.
Digital assets faced significant headwinds at the end of 2025, lagging behind most other asset classes – These negative flows still continue to weigh on the sector.
MicroStrategy (MSTR), a key figure in the previous bull run, is now under scrutiny as its Bitcoin holdings near the breakeven point, with an average cost basis of approximately $76,000.
As noted in our year-end analysis, the total Cryptocurrency Market Capitalization is breaking support after previously holding its long-term upward trendline, signaling potential for further downside – Keep an eye on the $2 Trillion mark!
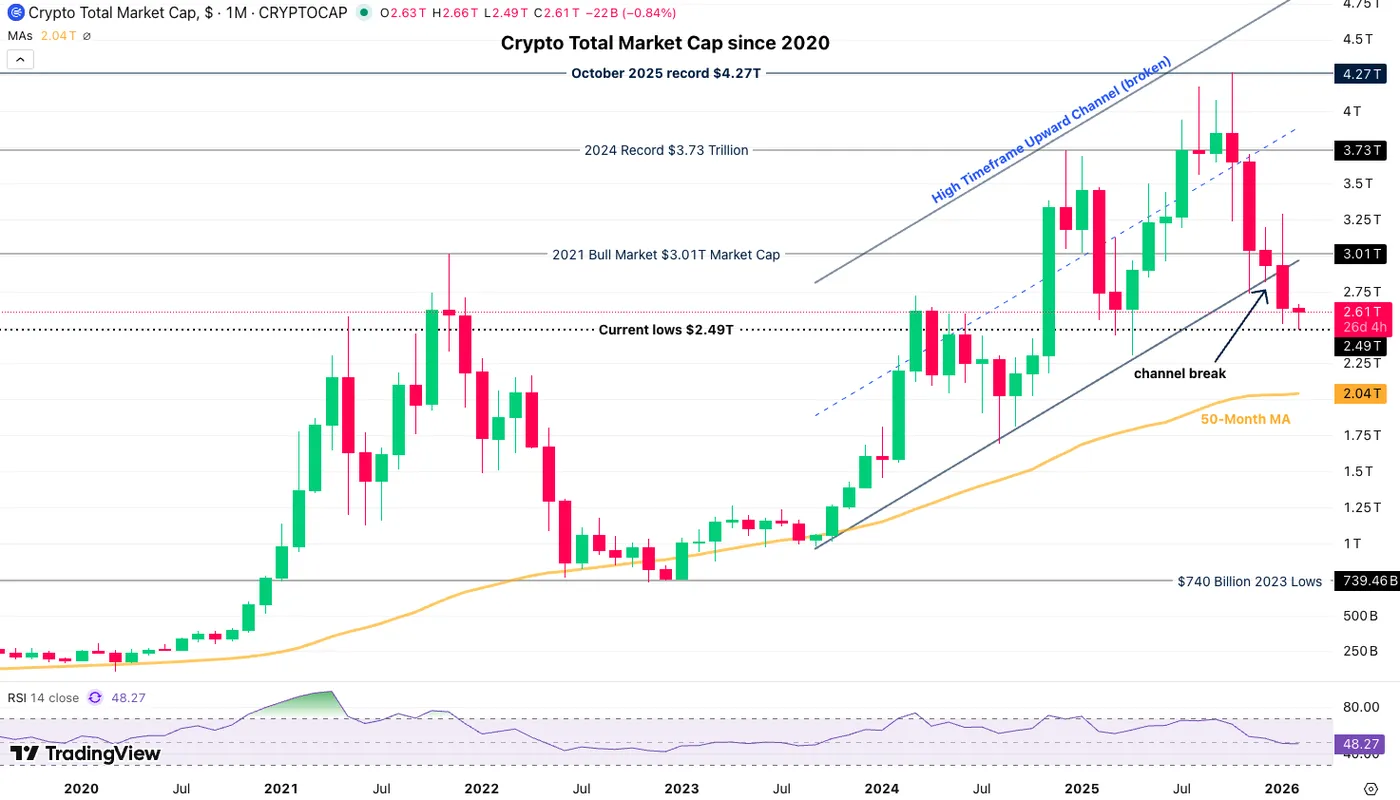
Crypto total Market Cap Monthly Chart – Source: TradingView
Cryptocurrencies are inherently volatile.
Historically, the best investment opportunities arise when interest and mentions are low, while peak popularity often signals a time to take profits.
Currently, the market remains active with traders attempting to buy dips, suggesting sentiment has not yet fully washed out.
Given the bearish short-term outlook, patience is advisable.
Letting prices and hype cool down while waiting for a more favorable macro setup may offer better entry points – Still, the large corrections already favor better entries compared to peak prices from mid-2025.
This is when starting DCA strategies could start to make sense.
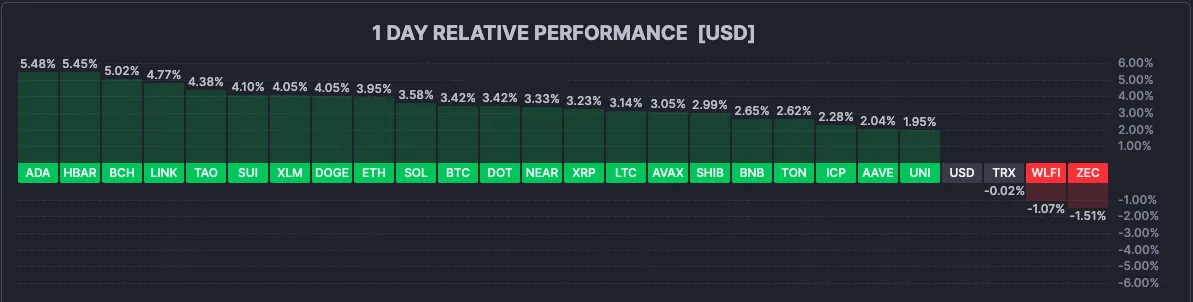
Current Session in Cryptos – February 2, 2026 (15:23). Source: FInviz
Following a disastrous weekend session, altcoins are seeing a timid recovery but remain well below last week’s levels. Most of the main names are green on the day and the biggest gains stand around 5%.
Let’s dive right into the Daily Charts and technical levels for Bitcoin (BTC), Ethereum (ETH) and Solana (SOL).
Bitcoin (BTC) 4H Chart and Technical Levels
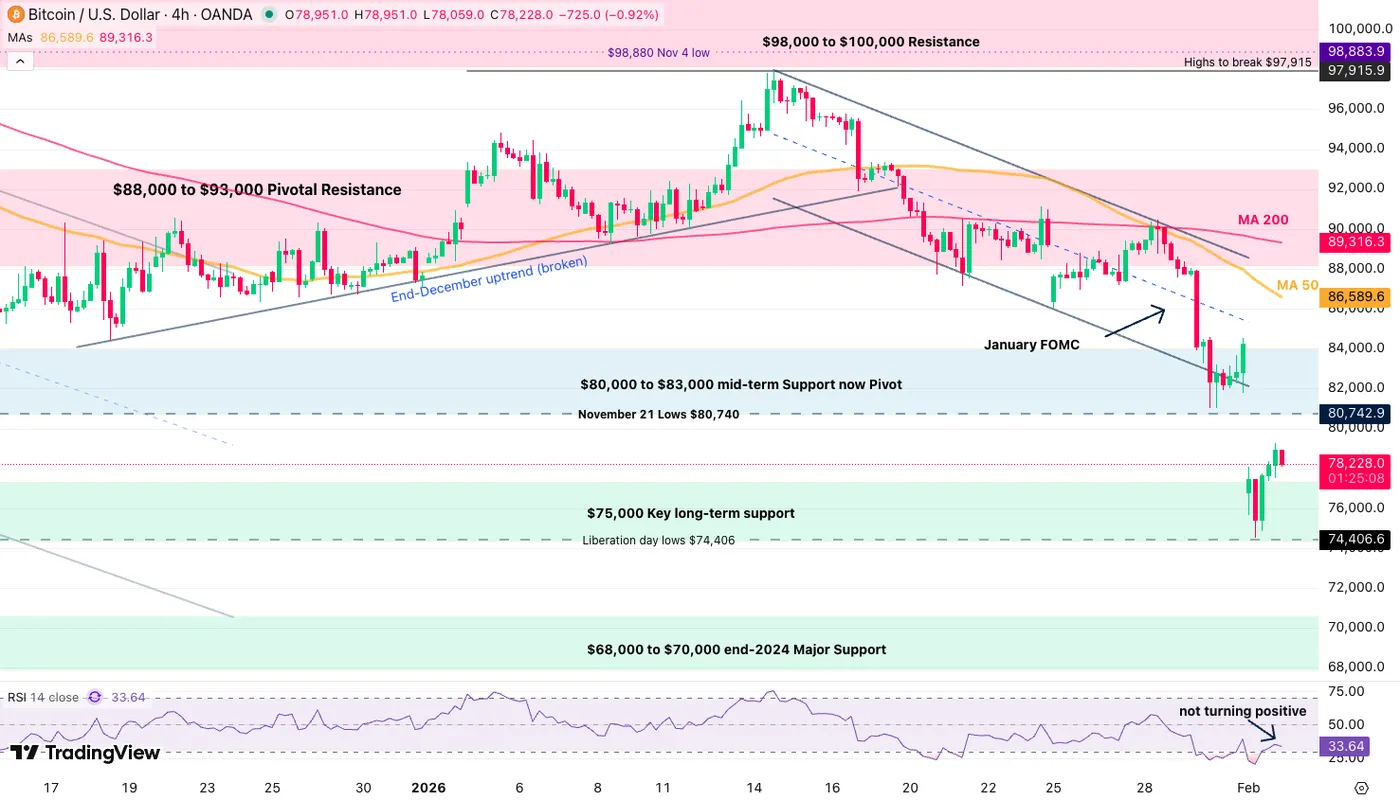
Bitcoin (BTC) 4H Chart, February 2, 2026 – Source: TradingView
Bitcoin freshly retested its Liberation Day lows ($74,500) and is rebounding timidly from that level.
With the painful action from the weekend, it is rough to say that dip-buying is looking like a favorable setup – At least for now.
A bullish push above $80,000 and daily close above the level relaunches positive prospects for Bitcoin and the rest of the Crypto Market.
Consolidating below the key psychological level could lead to further downside, with the next Main support at $63,000 (Minor support at $70,000).
Levels of interest for BTC trading:
Support Levels
- $75,000 Key long-term support (Liberation Day lows)
- $68,000 to $70,000 end-2024 Minor Support
- $$60,000 to $63,000 Main 2024 support
Resistance Levels
- $80,000 to $83,000 Major Pivot (November 21 Lows $80,740)
- $88,000 to $93,000 Pivotal Resistance
- $98,000 to $100,000 Resistance
- Resistance at previous ATH $106,000 to $108,000
- Current ATH Resistance $124,000 to $126,000
Ethereum (ETH) 4H Chart and Technical Levels
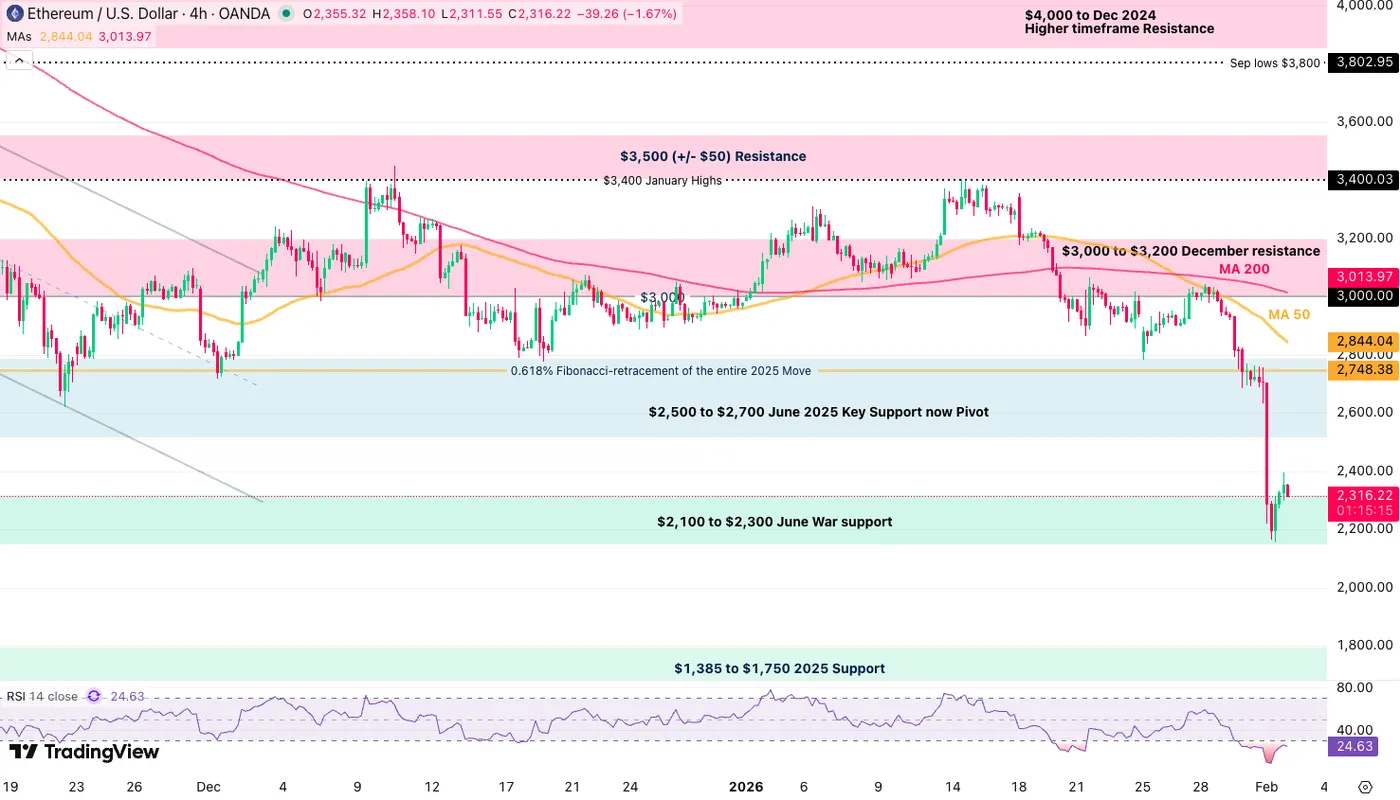
Ethereum (ETH) 4H Chart, February 2, 2026 – Source: TradingView
Ethereum gave back its early 2026 positive setup, having broken first its $3,000 handle before giving up all of its Mid-2025 explosion throughout last week.
Its overnight wick retested ETH’s pre-June War Support zone ($2,100 to $2,300) with the action remaining fragile at that level.
Traders will want to see a high volume and positive candle, preferably after a double bottom for the action to turn more positive – For now, expect consolidation near support.
Levels of interest for ETH trading:
Support Levels:
- $2,100 to $2,300 June War support ($2,150 overnight lows)
- $2,000 psychological support
- $1,385 to $1,750 2025 Major Support
- 2025 Lows $1,384
Resistance Levels:
- $2,500 to $2,700 June 2025 Key Pivot
- $3,000 to $3,200 December resistance
- $3,400 January Highs
- $3,500 (+/- $50) Key Resistance
- $4,000 Dec 2024 Top Main Resistance zone
- $4,950 Current new All-time highs
Solana (SOL) 4H Chart and Technical Levels
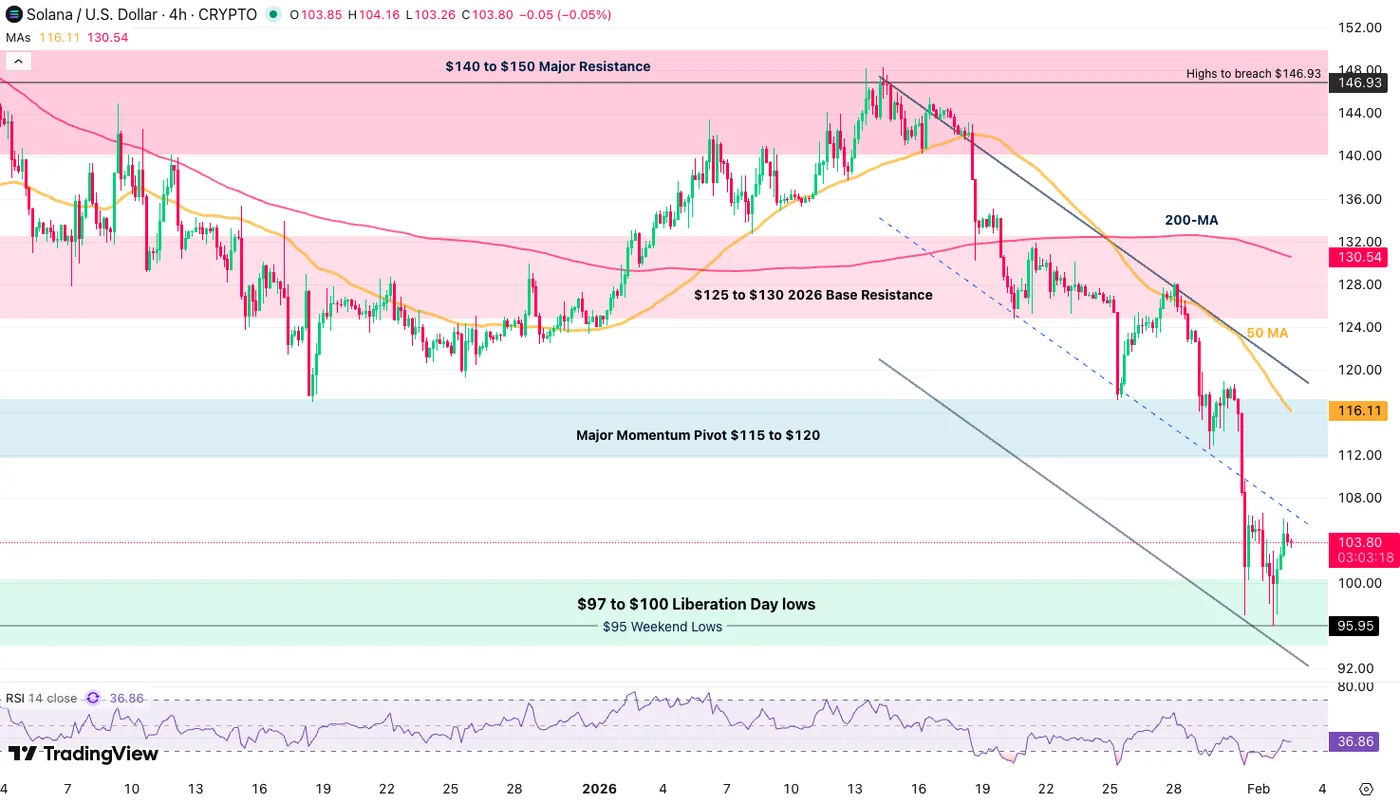
Solana (SOL) 4H Chart, February 2, 2026 – Source: TradingView
Solana got subject to quite some heavy selling, representing the rest of the Altcoin market in its struggles.
Now facing a very important test at its $100 Liberation Day support, traders will want to watch if bulls can retake control after the 57% retracement from its 2025 peak.
Repassing above $115 would turn the momentum from bearish to neutral-bullish on short-timeframe.
Levels to keep on your SOL Charts:
Support Levels:
- $97 to $100 Liberation Day lows
- $95.95 Weekend Lows
- $76 to $82 Major 2022 Pivot
Resistance Levels:
- Major Momentum Pivot $115 to $120
- $125 to $130 2026 Base Resistance
- $140 to $150 Major Resistance
- $253 Cycle highs
Safe Trades!


