
Key Highlights
- Bitcoin failed to recover above $80,000 and remains at risk of another decline.
- BTC/USD faces hurdles near $78,750 and $82,400 on the 4-hour chart.
- Ethereum also dipped below $2,300 and $2,250.
- Gold started another increase and traded above $5,000.
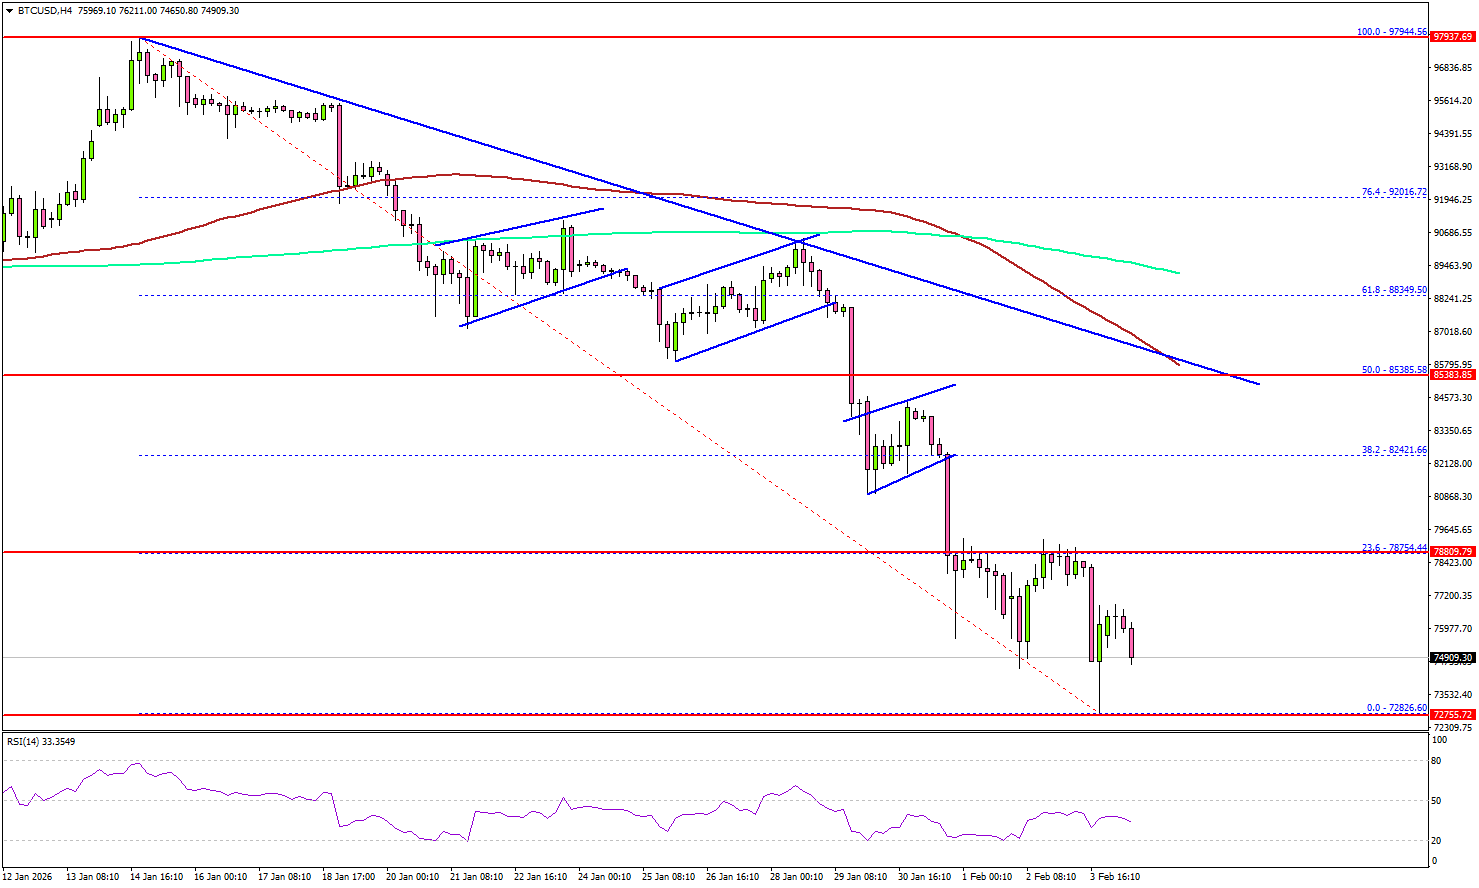
Bitcoin Price Technical Analysis
Bitcoin price attempted a recovery wave from $72,800 against the US Dollar. BTC failed to climb above $78,000 and remained in the red zone.
Looking at the 4-hour chart, the price dipped below $76,000 and remained well below the 23.6% Fib retracement level of the key decline from the $97,944 swing high to the $72,826 low. The price is also well below the 100 simple moving average (red, 4-hour) and the 200 simple moving average (green, 4-hour).
Immediate support sits at $73,200. The first key support could be $72,500. A downside break below $72,500 might start another decline. The next major support is $70,000, below which BTC could decline toward $68,000.
If there is a recovery wave, the price could face resistance at $77,500. The first key hurdle is $78,750. A close above $78,750 could send the price toward $82,400.
The main resistance could be $85,350 or the 50% Fib retracement level of the key decline from the $97,944 swing high to the $72,826 low. A close above $85,350 and then the 100 simple moving average (red, 4-hour) could start a steady increase. In the stated case, the price may perhaps rise toward the $90,000 level. Any more gains might call for a test of $95,000.
Looking at Ethereum, the price also reacted to the downside below $2,300. The bears might now aim for a drop below $2,120.
Today’s Key Economic Releases
- BoE Interest Rate Decision – Forecast 3.75%, versus 3.75% previous.
- ECB Interest Rate Decision – Forecast 2%, versus 2% previous.
- US Initial Jobless Claims – Forecast 212K, versus 209K previous.


