
- The US dollar and oil prices experienced intense volatility due to Middle East tensions, initially spiking after strikes on Iran but cooling after optimistic remarks from President Trump.
- The upcoming US CPI print, which is expected to show headline inflation holding steady at 2.4% may be overshadowed.
- US Dollar bulls eye acceptance above the 99.57 handle before the psychological 100.00 handle comes into play.
The US dollar found support late trade on Tuesday after it spent the majority of the day on the backfoot as hopes for a ceasefire in the Middle East grew.
The greenback retreated from its peak after a period of intense volatility sparked by joint US-Israeli strikes on Iran. While those strikes initially sent oil prices to their highest levels since 2022 and drove a surge in the greenback, the market cooled significantly following optimistic remarks from President Donald Trump.
On Monday, the President suggested that the conflict might conclude much sooner than originally anticipated, providing a much-needed reprieve for global markets.
However, this de-escalation came with a firm caveat: Trump warned that he would ramp up military action if Tehran attempted to disrupt oil flow through the Strait of Hormuz.
Despite the lingering threat, his comments were enough to soothe investor anxiety, leading to a sharp reduction in dollar buying.
By Tuesday, the shift in sentiment caused oil prices to plunge approximately 15%, reversing much of the previous session’s dramatic climb.
However, late in Tuesday’s session it appears that market angst had returned as Iranian leaders struck a defiant tone. As a result, haven demand returned which provided the US dollar support while Oil prices rose around 8% for the daily lows around the $75.93/barrel mark.
The move in the US Dollar Index leaves the greenback at a crossroads heading into tomorrow’s US CPI print.
US CPI data ahead
Now of course, the latest increase in oil prices will not be in tomorrow’s CPI release, with first signs likely to come in the March inflation release next month.
Looking back at the inflation release last month, it was a positive one for rate cuts. YoY inflation in the US dropped to its lowest level since May 2025, 2.4%.
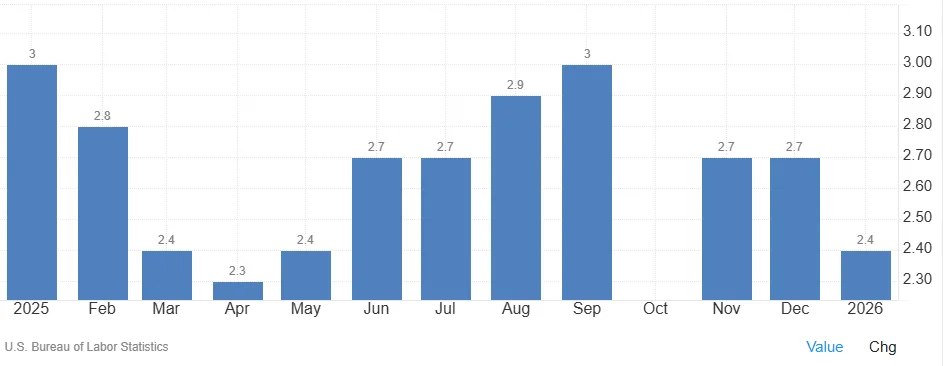
Source: TradingEconomics
Another drop this month though is unlikely to be met with the same optimism as the inflation release may seem somewhat out of date given the current month’s developments.
Markets will be watching to see what the print is as it may still have some impact on rate cut expectations, even if that proves temporary it could lead to a spike in volatility.
Markets are currently anticipating that US headline inflation YoY will hold steady at 2.4%, with core inflation expected to remain resilient at 2.5%. Because the Federal Reserve has entered its mandatory “quiet period” leading up to the March 18th policy meeting, officials are restricted from providing public commentary on how they intend to navigate the current geopolitical crisis.
This silence leaves investors speculating on whether the Fed and its global counterparts will view the recent spike in energy costs as a transitory shock to be “looked through,” or as a fundamental threat to long-term price stability that requires a more aggressive policy response.
The central question facing policymakers is whether these supply-side pressures will trigger a “second round” of price hikes across the broader economy. If central banks conclude that the conflict’s impact on oil is temporary, they may maintain their current interest rate trajectories; however, if they perceive a genuine risk of inflation becoming entrenched, a shift toward higher-for-longer rates may be necessary to anchor market expectations.
The next week should be key as we have the CPI, PCE data releases ahead of the Fed meeting. The question is, will the conflict still be ongoing at that point and what will the Oil price be?
US Dollar Index – Technical picture as CPI looms
From a technical standpoint, the daily candle has tested a key support area at 98.72 before dropping further to test the 100-day MA at 98.56.
Since then, the index has seen the daily candle change course dramatically, on course to close as a hammer candle.
Now while candlestick patterns are a good analysis tool, during periods like the one we are in now where a tweet by President Trump can change the entire market sentiment I would urge caution.
Monday’s daily candle close being a prime example. A massive shooting star candlestick which is looking likely to be followed by a hammer candle. This is a sign of the current indecision and impact the constantly changing narratives are having on markets.
For bulls, a clean daily candle close above the 99.57 handle remains elusive. If bulls are to challenge the 100.00 psychological level, acceptance above this handle will be key in the near-term.
Looking at the downside and support rests at the 98.56 handle where the 100-day MA rests before the 200-day MA at 98.33 comes into focus. Below that markets will begin to look at the 97.70 handle.
US Dollar Index Daily Chart, March 10, 2026
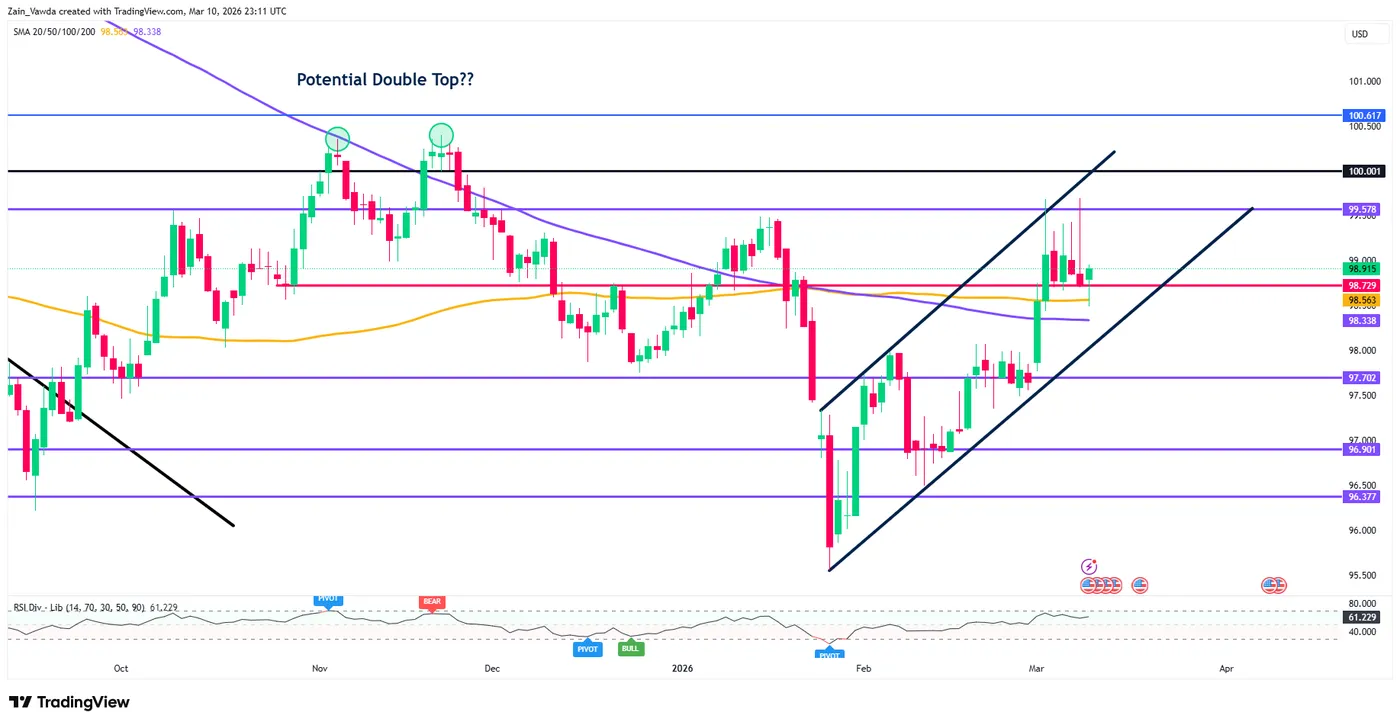
Source: Tradingview


