
It’s only Tuesday and we can already talk about an insane week!
After yesterday’s chaos in the Oil Market, commodities still have a few surprises in store. Today seemed to mark a new beginning in the current war-flows, with Crude crawling back to $76.50 around the mid-session, a 35% move lower!
The ongoing profit-taking got stretched by the numerous dip-buying attempts and a falling volatility, but this didn’t last long.
Metals had been enjoying a strong session, helped by the smoother inflation expectations as stagflationary pressure eased – Combining higher yields and a strong US Dollar, the recent War flows hadn’t helped the highly positioned metals to rise.
The fact that the conflict also failed to gather proper risk-off Market flows insisted on these trends.
Nonetheless, as Oil fell back below $90, Precious metals quickly found a renewed bid, with Gold back above $5,200, Silver tipping the $90 level, and Platinum up more than 3%, a first since early February.
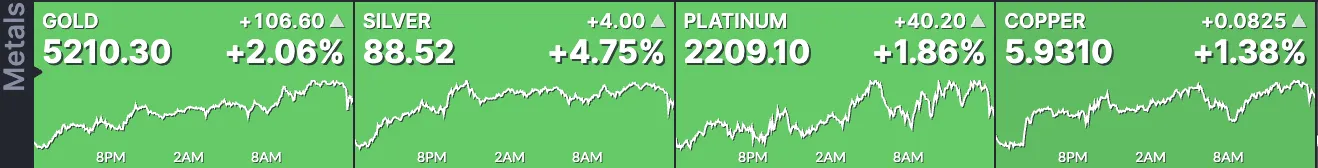
Current Session in Metals (15:05 ET) – Courtesy of Finviz. March 10, 2026
The issue with current moves, is that they tend to be erratic.
US Intel revealed that Iran was moving to place water mines in the Strait of Hormuz, which could prove to be a nail in the coffin for an already non-existent traffic (despite some form of progress in recent days).
The news quickly saw Oil prices rebounding back towards $84 and the action now bouncing from there!

WTI Oil 15M Chart. March 10, 2026. Source: TradingView
This led to a daily top in Equities and Cryptos, but more particularly in the subject of today’s analysis: Metals.
Let’s dive into intraday chart and levels for both Silver (XAG/USD) and Gold (XAU/USD) to see if the recent news really market a session top or if a more widespread bounce was to come.
Gold 4H Chart and Intraday Levels

Gold 4H Chart. March 10, 2026. Source: TradingView
These days, Markets aren’t all about technical analysis (which still helps to find decent levels for decision-making, like entry and exits). The best way to navigate Markets are by looking at correlated and inversely correlated assets.
By looking at Oil movements, one was able to catch bottoms in Equities and Metals – A catalyst detailed in our past week US Dollar analysis.
So what about now? Since the Oil has marked its daily bottom, metals haven’t been able to bounce, leading to the formation of a triangle formation.
- Breaking the 4H 50-Period MA would point to a quick test of the lower trendline around $5,050
- Any major break above the session highs ($5,238) would point to continue upside.
- This could lead to a retest of the $5,400 March highs
Levels of interest for Gold trading:
Support Levels:
- $5,180 4H 50-Period MA imminent support
- $5,050 to $5,100 Major support
- $4,850 to $4,900 Support (Mid-Feb Lows)
- Pivotal Support and December record $4,400 to $4,500 (Bearish below)
- Channel lows $4,200
Resistance Levels:
- Session highs ($5,238) and $5,250 Pivot Zone (+/- $25)
- $5,400 Wartime Resistance
- Current All-time Highs Resistance – $5,500 to $5,600
Silver (XAG/USD) 4H Chart and Intraday Levels
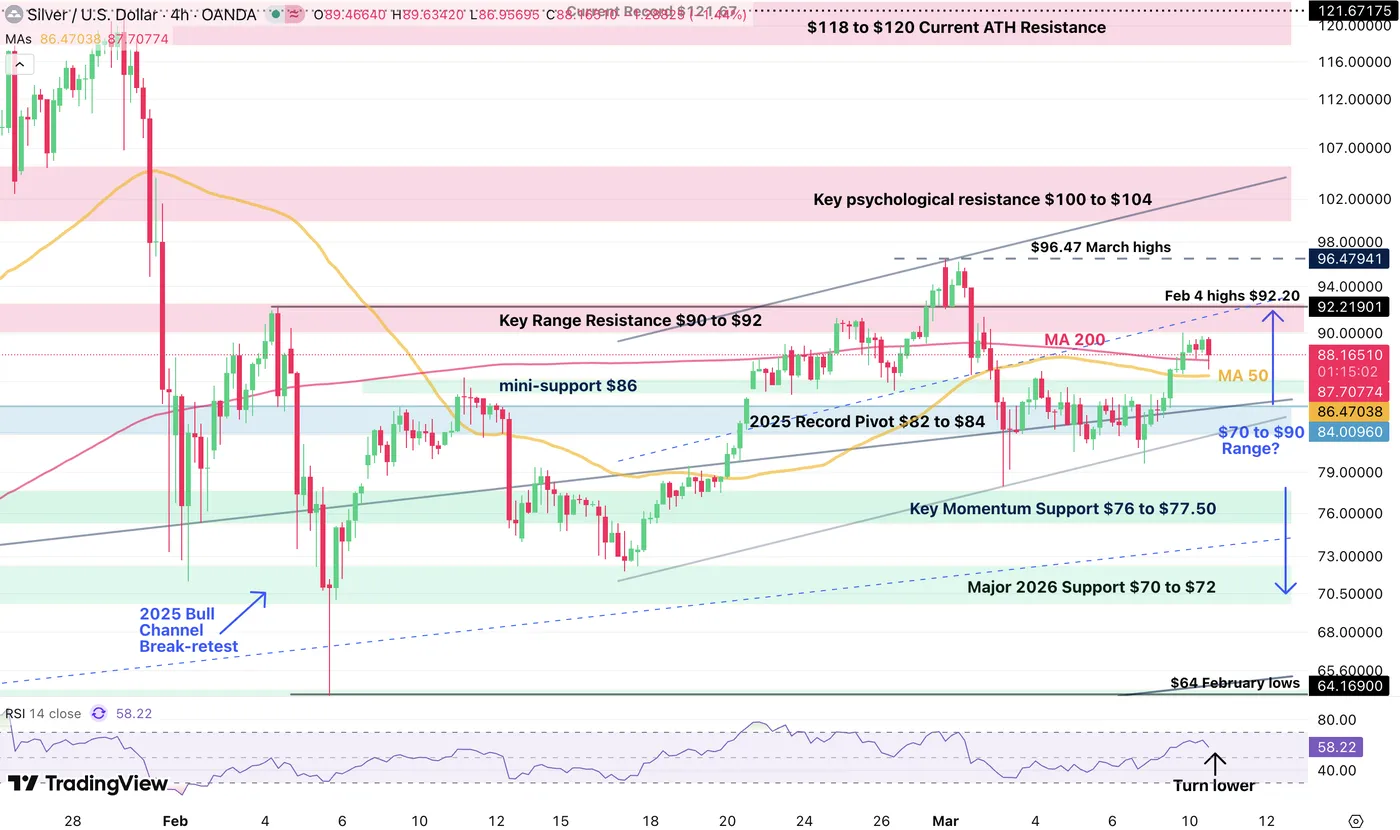
Silver 4H Chart. March 10, 2026. Source: TradingView
Silver also managed a decent push higher but is finding pressure as Oil maintains its rebound.
The key level to watch is $90:
- Having failed to break the level in today’s action, odds are higher for a correction back towards at least $86
- Below this, $82 will be the next key Support on deck.
- For bulls, breaking above with a 1H close would point to higher chances of a breakout
Levels of interest for Silver trading:
Support Levels:
- Mini-support $86
- 2025 Record Pivot (Acting as key support) $82 to $84
- February Momentum Support $76 to $77.50
- Major 2026 Support $70 to $72
Resistance Levels:
- Key Range Resistance $90 to $92
- $96.47 March highs
- Key psychological resistance $100 to $104


 and Gold (XAU/USD) to see if the recent news really market a session top or if a more widespread bounce was to come.)