
Oil slipped back below $100 today as signs emerged that the Strait of Hormuz remains navigable, easing fears of a full disruption to global energy supply. Dollar weakened broadly as traders scaled back the most extreme oil shock scenarios tied to the US-Israel conflict with Iran. Overall market sentiment also improved with major European indexes trading mildly higher, along with US futures.
Comments from US Treasury Secretary Scott Bessent helped trigger the shift in sentiment. Speaking to CNBC, Bessent said Iranian ships had already been leaving the Strait of Hormuz. He suggested the movement reflects a decision to allow oil flows to continue, stating that “we’ve let that happen to supply the rest of the world.”
For markets, the key takeaway is that Iran has not mined the Strait. A mined waterway would make the passage impassable for all vessels and would take significant time to clear, potentially causing a prolonged global energy crisis. The continued movement of tankers therefore signals that the worst-case scenario has not materialized.
Iranian Foreign Minister Abbas Araghchi also confirmed that the Strait remains open from Tehran’s perspective. Speaking at a press conference, he said the route is only closed to vessels belonging to the US, Israel and their allies, while other shipping traffic can still pass.
At the same time, governments are preparing to release strategic oil reserves to stabilize markets. The International Energy Agency said a coordinated release among its 32 member countries will soon begin in response to the supply concerns triggered by the conflict.
Japan has already started to release reserves, including 15 days of private-sector stocks and 30 days of government-held supplies. The US plans to contribute 172.2 million barrels, with oil expected to reach markets toward the end of March. European contributions are scheduled to follow the same timeline.
These additional supplies should act as a temporary bridge for global markets, limiting the immediate upside risk to crude prices while policymakers monitor developments in the Middle East.
In currency markets, Dollar is currently the weakest major currency on the day, followed by Loonie and Yen. Kiwi leads gains, with Aussie and Euro also strengthening, while Sterling and Swiss Franc are near the middle of the performance rankings.
In Europe, at the time of writing, FTSE is up 0.66%. DAX is up 0.63%. CAC is up 0.29%. UK 10-year yield is down -0.078 at 4.693. Germany 10-year yield is down -0.035 at 2.950. Earlier in Asia, Nikkei fell -0.13%. Hong Kong HSI rose 1.45%. China Shanghai SSE fell -0.26%. Singapore Strait Times rose 0.55%. Japan 10-year JGB Yield rose 0.035 to 2.280.
Canada CPI slows to 1.8% in February, inflation pressure eases before oil shock
Canada’s inflation slowed more than expected in February, with headline CPI easing to 1.8% yoy while core measures including CPI median, trimmed and common all softened. The slowdown was driven partly by declines in energy prices such as gasoline and natural gas, suggesting underlying price pressures are gradually moderating.
China industrial production, retail sales, investment beat expectations in Jan–Feb
China’s economic activity showed a stronger-than-expected start to 2026, with industrial production, retail sales and fixed-asset investment all beating forecasts. However, the property sector remains a key drag on the broader recovery.
New Zealand BNZ services falls back Into contraction, weak demand hits
New Zealand’s services sector slipped back into contraction in February, with the BusinessNZ Performance of Services Index dropping to 48.0. Weak demand, high living costs and elevated interest rates continue to weigh on activity.
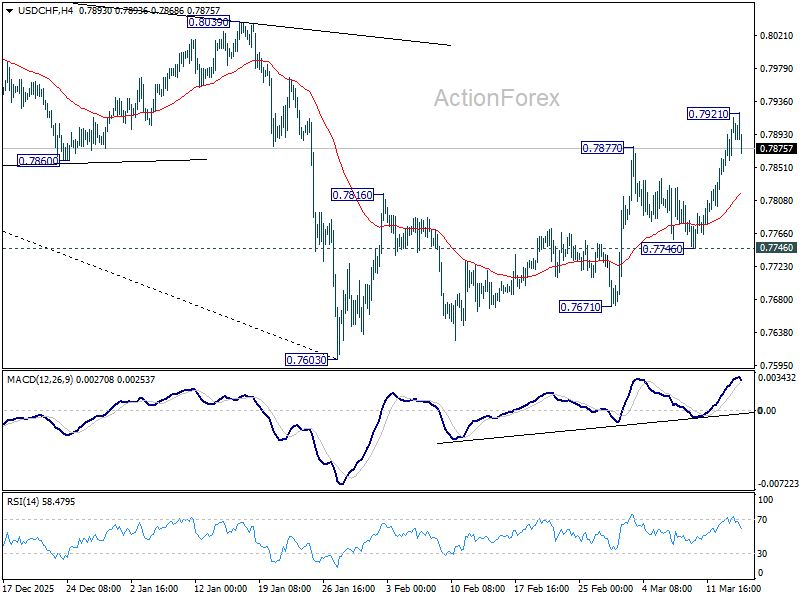
USD/CHF Mid-Day Outlook
Daily Pivots: (S1) 0.7866; (P) 0.7893; (R1) 0.7939; More….
A temporary top is in place at 0.7921 in USD/CHF and intraday bias is turned neutral first. Some consolidations would be seen but further rally is in favor as long as 0.7746 support holds. Rise from 0.7603 is seen as correcting whole down trend from 0.9200. Break of 0.7921 will target 38.2% retracement of 0.9200 to 0.7603 at 0.8213.
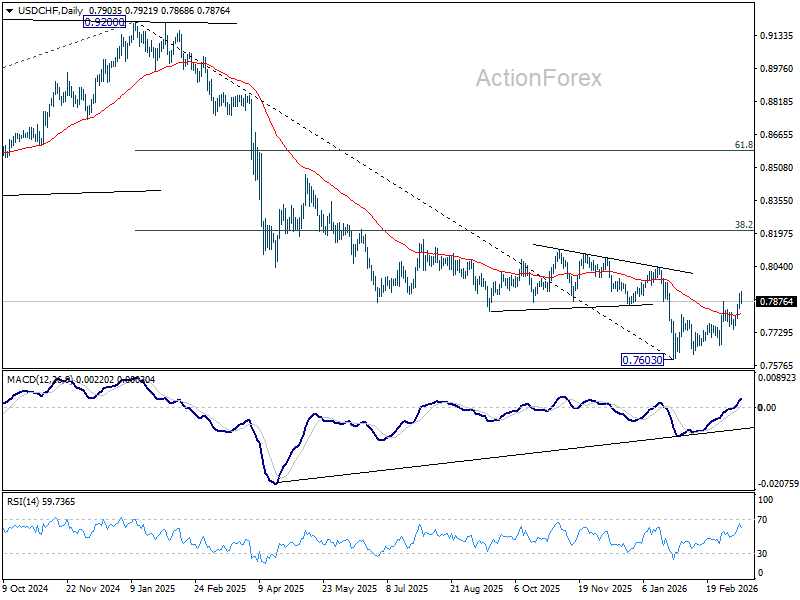
In the bigger picture, a medium term bottom should be in place at 0.7603 on bullish convergence condition in D MACD. Rebound from there is seen as correcting the fall from 0.9200 only. However, decisive break of 55 W EMA (now at 0.8091) will suggest that it’s probably correcting the larger scale down trend from 1.0146 (2022 high). On the other hand, rejection by the 55 W EMA will setup down trend resumption to 100% projection of 1.0146 (2022 high) to 0.8332 from 0.9200 at 0.7382 at a later stage.


