
S&P 500: ⬇️ Sell
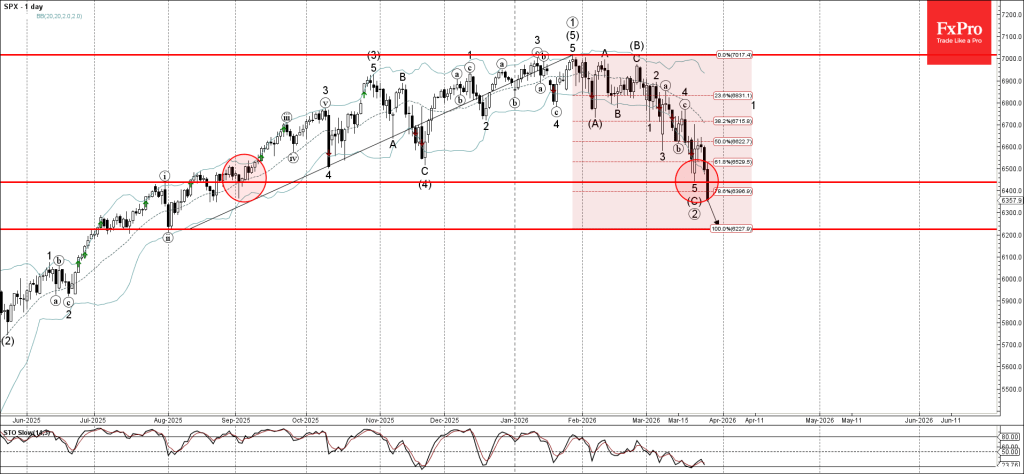
- S&P 500 broke strong support level 6440.00
- Likely to fall to support level 6225.00
S&P 500 index recently broke below the strong support level 6440.00 (which stopped the previous impulse wave 5 in March) and the 61.8% Fibonacci correction of the upward impulse from August.
The breakout of the support level 6440.00 should add to the bearish pressure on this index.
S&P 500 index can be expected to fall further to the next support level 6225.00 (former strong support from July and August of 2025).


 and the 61.8% Fibonacci correction of the upward impulse from August.)