
- Oil tumbles as traders are getting more convinced that the conflict is heading towards its end
- The Brent-WTI spread erases its entire War premium, hinting at softer conditions in a stressed Market
- Exploring an in-depth Technical Analysis of the commodity
Traders are now slowly preparing for an end to the US-Iran conflict after 5-weeks of ceaseless, methodical attacks from the US-Israel coalition on IRGC military targets.
The conflict has caused significant damage and volatility in global Markets, dampening equities and overall risk assets and even hurting traditional safe havens like Metals and bonds amid a rise in inflation expectations.
Precious Metals like Gold actually began to trade as if they were typical risk assets during the war, as flagged in a HSBC piece – We are indeed in a new age for Markets!
As always in the Middle East, Crude Oil is right in the center stage, having bounced about 50% since February 27, the Friday that preceded the commencement of the conflict.
As the war began, the Brent-WTI spread, a historical indicator of energy commodity Market stress, had spiked to $18.65, levels unseen since February 2019 (excluding the extreme COVID spikes).
This spread is now rushing back towards its yearly and pre-war lows.
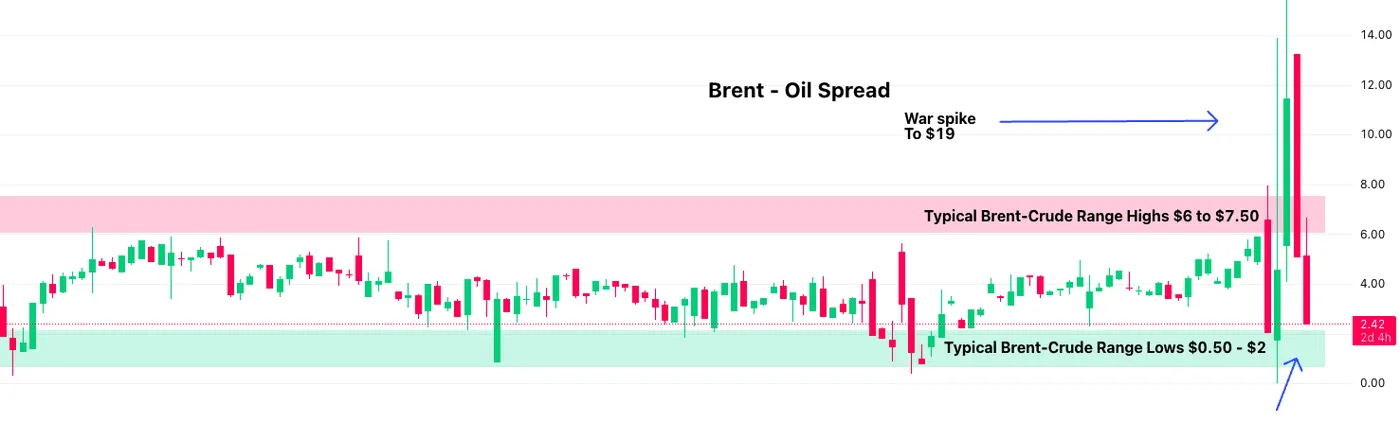
Brent-WTI Spread – Source: TradingView. March 31, 2026
This indicates a large easing in narrative, at least, which also could compromise Trump’s threat to let European and Gulf nations take care of the Strait of Hormuz passage after the military operation.
In any case, the spread easing in such a manner could further ease tensions in the Energy Market, as the two enemy-counterparties confirm they are engaged in more serious talks.
China and Pakistan have formulated their own 5-point Peace Plan for a smoother, peaceful process ahead. That same plan wasn’t even criticized by President Trump in his daily address – given how verbal the President typically is, this was a first- and Markets took this as a sign of significant progress, boosting Equity Indexes by 2.50% each in the afternoon session.
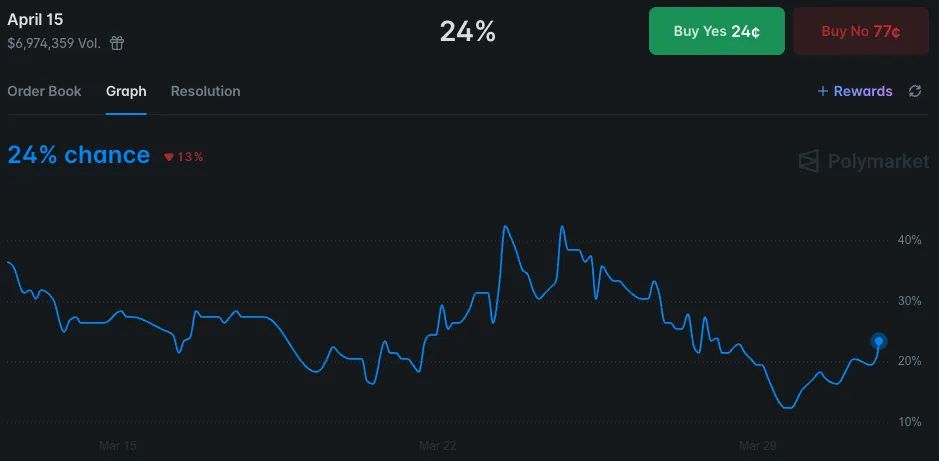
Odds for a US-Iran Ceasefire by April 15 – Source: Polymarket. March 31, 2026
For now, Polymarket odds for a ceasefire by April 15 are still only around 25%. Still, a lack of a ceasefire doesn’t prevent a truce – how volatile that truce will be and under what conditions will dictate whether more consistent upside is warranted in risk assets.
Upcoming headlines and developments will have to be contrasted heavily by Participants, particularly as expectations from here will be elevated, and today’s session moves might be exaggerated by the Month-End flows.
As the situation becomes clearer as the week continues, let’s dive into a multi-timeframe analysis of WTI (US) Oil to identify levels of interest and put the odds in the trader’s favor to capitalize on the situation.
US Oil Multi-Timeframe Analysis
WTI Daily Chart
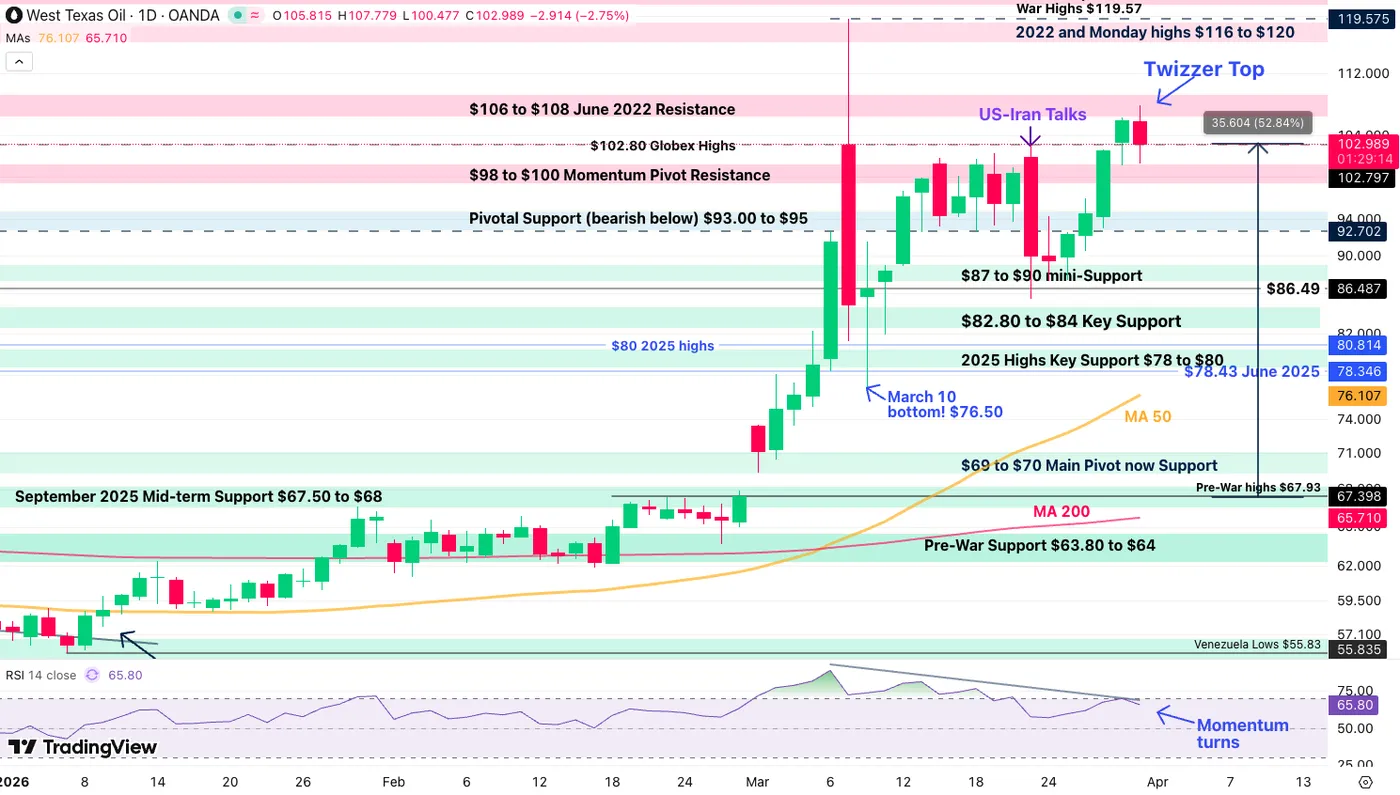
WTI Oil Daily Chart – March 31, 2026. Source: TradingView
WTI’s steep rise in previous sessions has seen a significant stop with the turn in narrative.
Testing $107.80 in the overnight trading, the key resistance was then rejected, but the price action isn’t so clear yet.
Tumbling to $100 and reverting higher, traders will want to see a clear rejection to the downside to assume a clearer path ahead.
The past two daily candlesticks have formed a Tweezer top, which coincides with a turn in RSI plus a bearish RSI pattern, all pointing to some downside.
But timing will be important to avoid getting tricked by a sudden change in atmosphere – Waiting for a clear break below today’s lows could be a better way to avoid getting stuck short.
WTI 4H Chart and Technical Levels
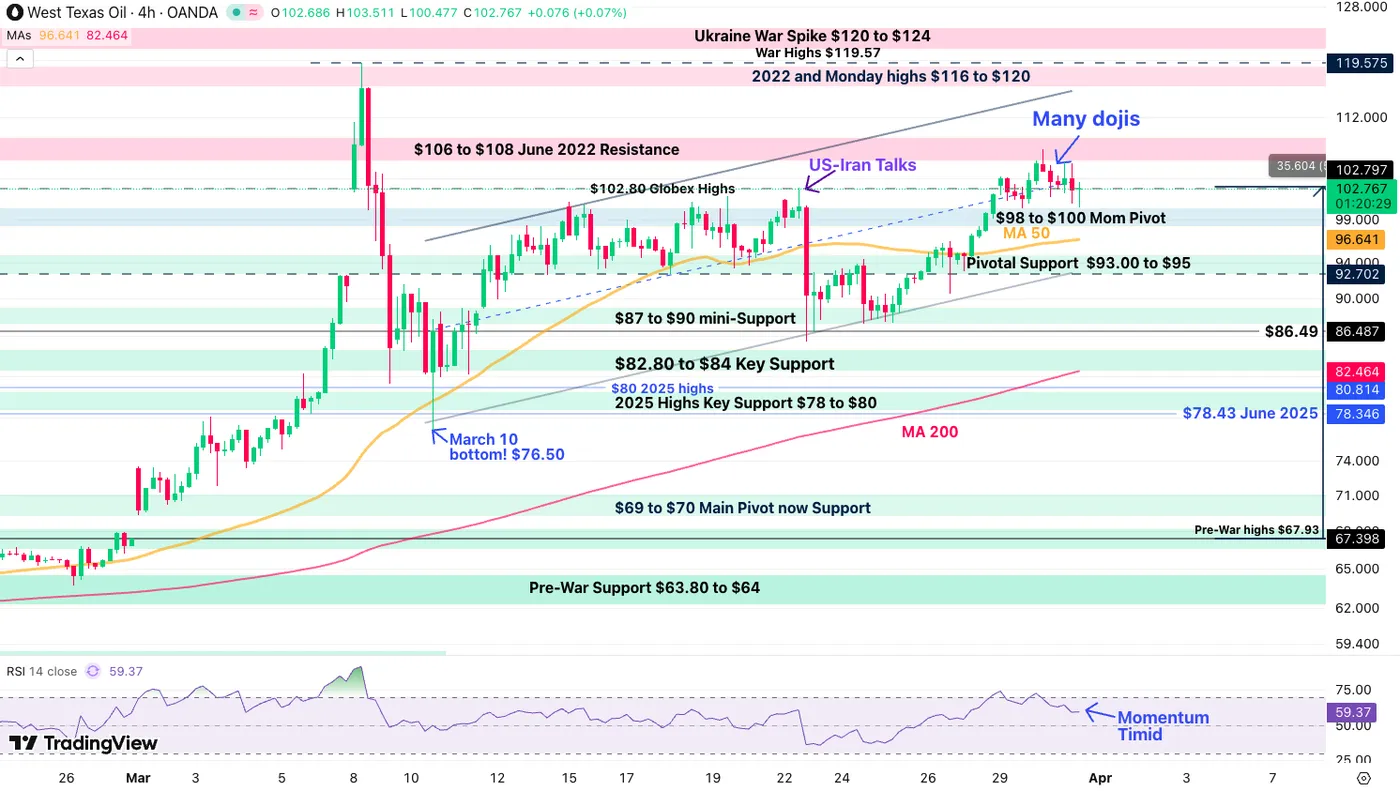
WTI Oil 4H Chart – March 31, 2026. Source: TradingView
As seen in the intraday charts, recent candles are more pointing towards a very hesitant price action that a decidedly bearish reversal – In such setups, waiting for breakouts with Stop orders could prove a more efficient strategy.
- For bears, watch for a clean break below $100, with extra confirmation below $96.64 (4H 50 MA) and $92.70 for an final conflict support break.
- Bulls will want to see an extension and close above $108 to head back towards $116.
WTI Technical Levels:
Resistance Levels
- $106 to $108 June 2022 Resistance (morning highs)
- $110 psychological level
- 2022 and Monday highs $116 to $120
- Ukraine War Spike $120 to $124
Support Levels
- $98 to $100 Momentum Pivot
- $96.64 4H 50-MA
- Pivotal Support $93.00 to $95
- $87 to $90 mini-Support
- $82.80 to $84 Key Support
- War flows Pivot $65.00 to $66.00
1H Chart and action levels
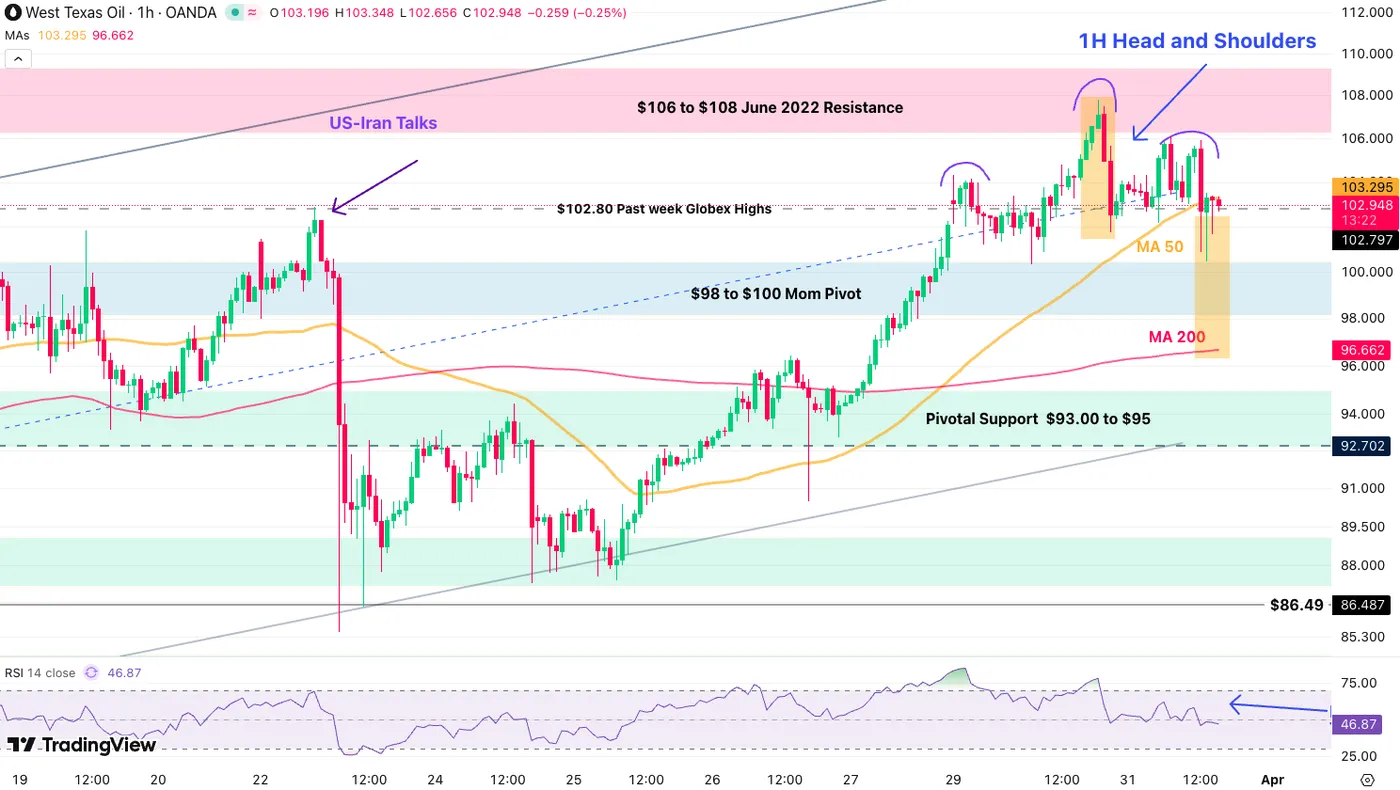
WTI Oil 1H Chart – March 31, 2026. Source: TradingView
The short-timeframe is more prone to fakeouts, particularly as headlines can quickly change the narrative, but for the most eager and impatient traders, a 1H Head and Shoulders pattern in arising, pointing towards $96.66 (200-Hour MA).
A rally back above $106 would void the technical pattern.
Safe Trades and keep your eyes on the news!


