
- Silver (XAG/USD) has broken above a multi-month bearish trendline.
- The short-term target for bulls is the psychological $80.00 level, with $75.00 confirmed as key support.
- Overbought momentum indicators on multiple timeframes suggest caution and patience for a pullback to support may be warranted.
Daily Timeframe: Confronting a Multi-Month Bearish Trendline
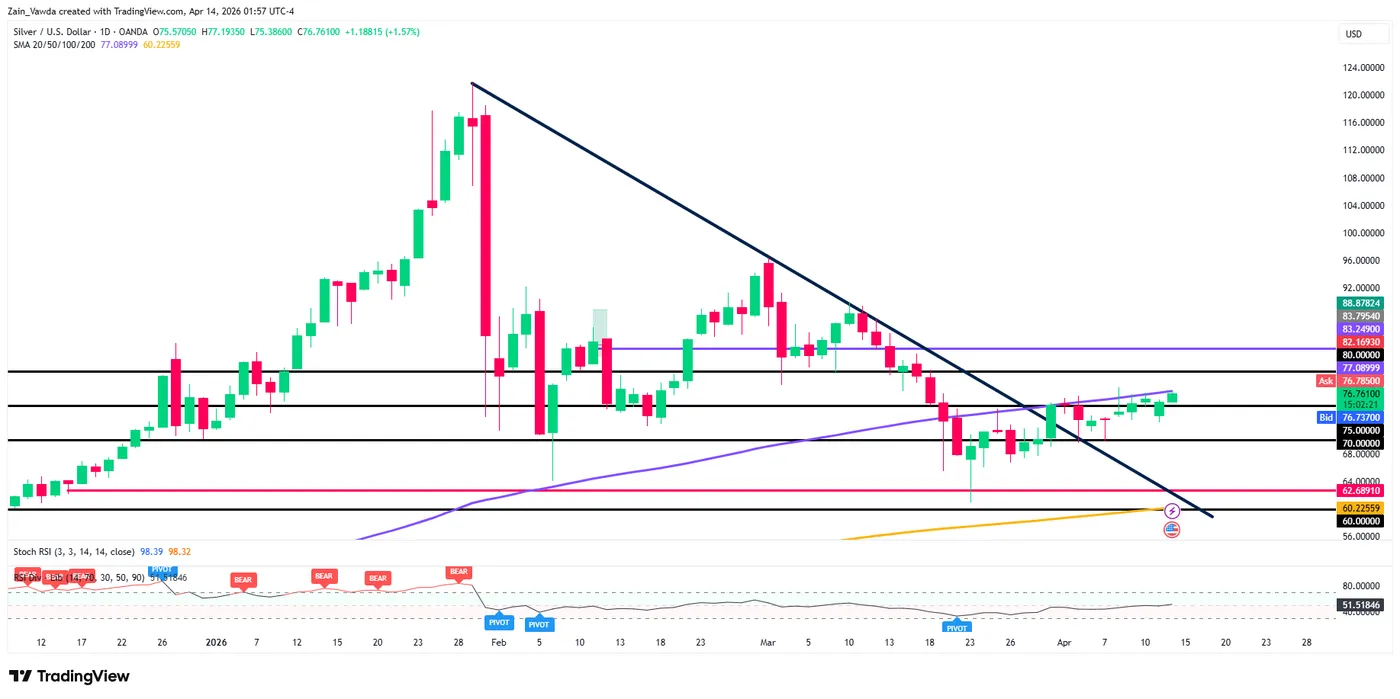
The daily chart for Silver (XAG/USD) presents a fascinating technical battleground. After a period of significant volatility earlier in 2026, the price action has stabilized into a recovery phase that is now testing a major structural hurdle.
The Trendline Constraint: The primary focus on the daily is the long-term descending trendline (navy blue) originating from the highs of late January. Price is currently attempting a sustained breakout above this line, which has historically acted as a ceiling for upside momentum.
Moving Average Confluence: Silver is currently trading above its 200-day MA (yellow). However, the 100-day MA (purple) remains above current prices, with a daily candle close above a sign that the long-term bull trend remains very much intact.
Support and Resistance: The psychological level of $75.00 has shifted from resistance to support. To the upside, the next major target for bulls is the 80.00 handle, followed by the technical resistance zone at 82.16.
Momentum: The RSI is currently just above the 50 neutral level, suggesting that the bullish momentum may be returning.
Silver (XAG/USD) Daily Chart, April 14, 2026
Source: TradingView.com (click to enlarge)
H4 Timeframe: Bullish Momentum Gains Traction
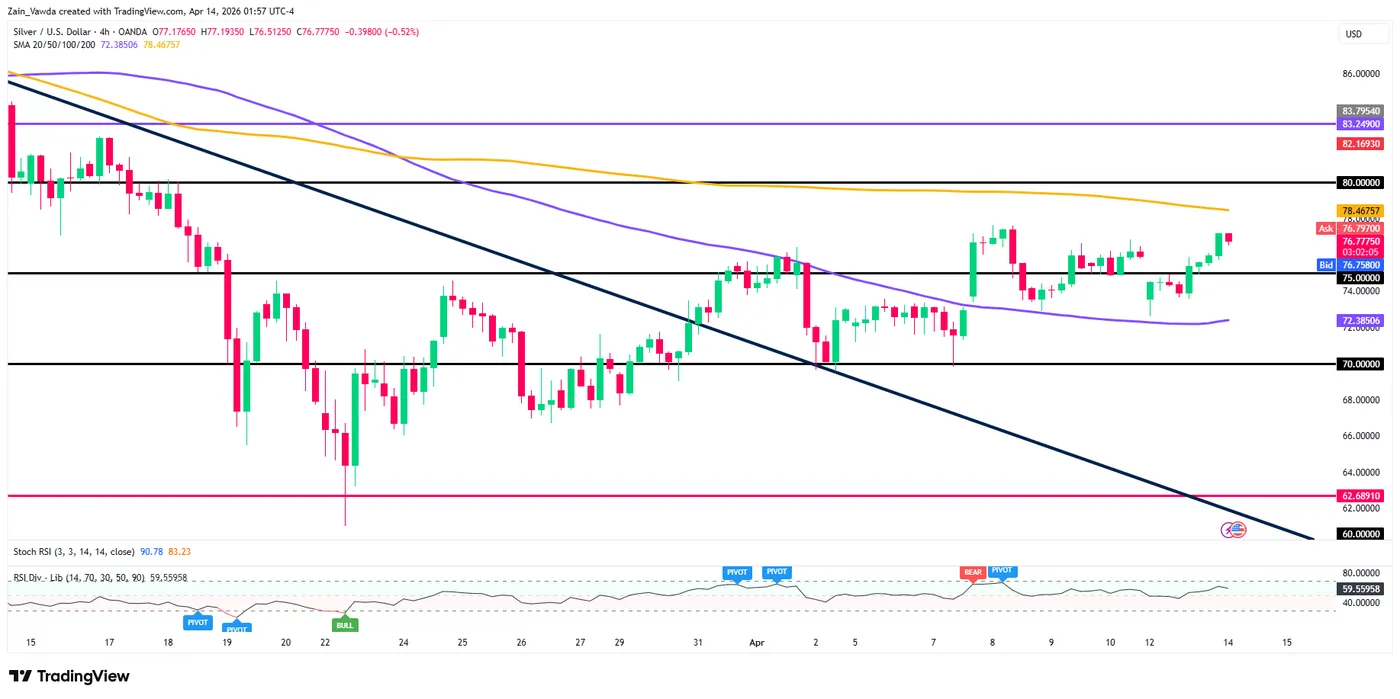
Moving down to the H4 chart, the bullish narrative becomes more pronounced. We are seeing a classic stair-stepping pattern of higher highs and higher lows.
Breakout Confirmation: The H4 chart shows a decisive break above the 75.00 horizontal level. This area is now bolstered by the fact that price continues to hold above immeidate dynamic support provided by the 100-day MA.
SMA Alignment: The MAs on the H4 are beginning to tilt to the upside with the 200-day MA just resting above current prices. A break above this 200-day MA at 78.46 will reinforce the bullish narrative and bring 80.00 level and beyond into focus.
Indicator Outlook: The RSI on the H4 is holding steady near 59.55, indicating that there is still plenty of room for price appreciation before reaching extreme overbought conditions on this timeframe.
Silver (XAG/USD) Four-Hour Chart, April 14, 2026
Source: TradingView.com (click to enlarge)
H1 Timeframe: Tactical Upside Grind
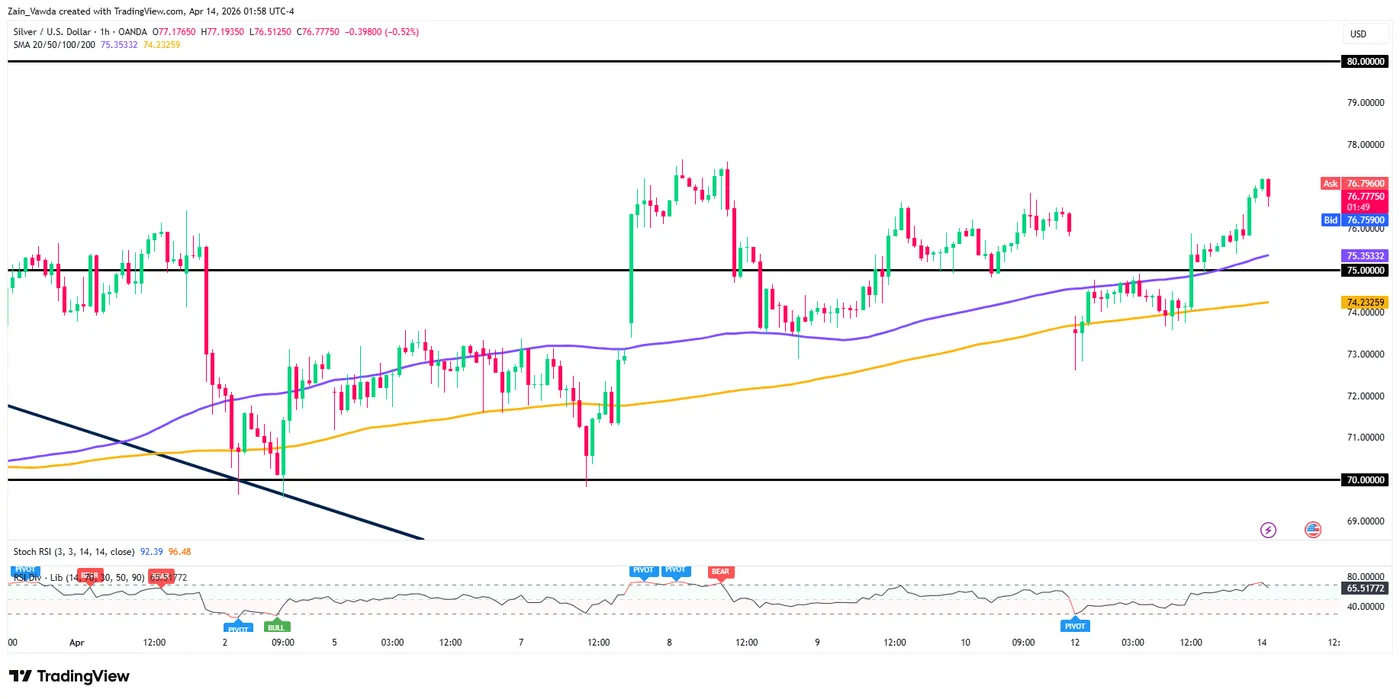
The H1 chart highlights a very clean intraday trend. The metal has spent the last several sessions grinding higher, guided by its short-term moving averages.
Immediate Support: The 75.35 level (100-day MA) is the immediate line in the sand for intraday traders. As long as price holds above this level, the “buy the dip” mentality remains the dominant play.
Price Targets: The immediate target is the 78.00 psychological level, with a clear path toward the $80.00 resistance if the current momentum persists.
Divergence Watch: While the price is making higher highs, the RSI is starting to show signs of exhaustion. This may lead to a minor retracement back toward the 75.00 – 75.50 zone before the next leg higher.
Silver (XAG/USD) One-Hour Chart, April 14, 2026
Source: TradingView.com (click to enlarge)
Silver is currently in a “Show Me” phase. The breakout above the daily descending trendline is a significant technical milestone, but it requires a daily close above 77.00 to confirm that the bears have truly lost control.
The Bullish Play: Bulls will be looking for a successful retest of the 75.00 area. If price can hold this level on a pullback, the next logical objective is the 80.00 psychological resistance. A break there opens the door for a move toward the 82.00 – 83.00 region.
The Bearish Play: For the bears to regain the upper hand, they need to force a “fakeout” scenario where price dives back below the descending trendline and the 75.00 support. A move back below 74.00 would invalidate the current bullish setup and suggest a return to the 70.00 support zone.
Key takeaway: The path of least resistance is currently to the upside, but with oscillators reaching overbought levels on multiple timeframes, patience for a “value entry” near support may be rewarded over chasing the current breakout.


 presents a fascinating technical battleground. After a period of significant volatility earlier in 2026, the price action has stabilized into a recovery phase that is now testing a major structural hurdle.)