
- The daily chart confirms a major structural breakout, shifting the macro bias for GBP/USD from “sell the rallies” to “buy the dips”.
- The primary structural target for the current rally is the major resistance zone at 1.3696
- “Cable” is consolidating near the 1.3600 handle, with intraday bulls defending the critical psychological pivot at 1.3500.
- The Bullish Scenario requires a sustained hourly close above 1.3584 to target 1.3650, while a break below 1.3500 would signal a deeper corrective phase.
GBP/USD has enjoyed a stellar run of late, capitalizing on a weakening US Dollar and a shift in global risk sentiment. However, as we move into the tail end of the week, “Cable” is finding the air a bit thin near the 1.3600 handle, setting the stage for a battle between trend followers and mean-reversion traders.
Daily Chart: Structural Breakout Confirmed
The daily timeframe provides the most compelling evidence of a medium-term trend shift. After months of being capped by a persistent descending trendline (dark navy), GBP/USD staged a clean breakout in early April.
Crucially, the pair has successfully reclaimed its 100-day MA (blue) at 1.3444 and its 200-day MA (black) at 1.3413. This “double reclaim” of the major moving averages suggests that the macro bias has shifted from “sell the rallies” to “buy the dips.” Currently, the pair is eyeing the next major structural hurdle at 1.3696, which represents a significant historical resistance zone.
The Daily RSI is at 62.7, indicating healthy bullish momentum with plenty of runway before hitting the overbought 70.0 threshold.
GBP/USD Daily Chart, April 16, 2026
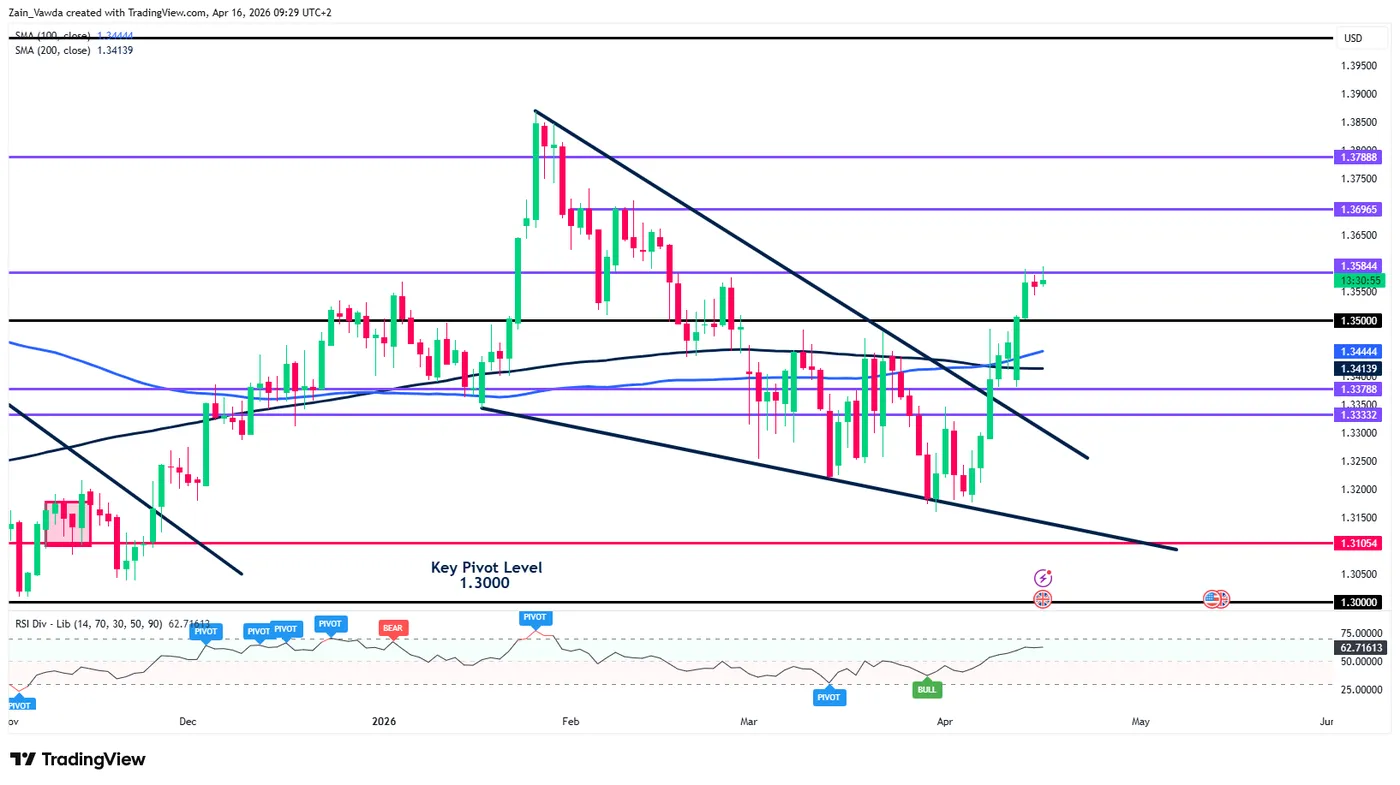
Source: TradingView
H4 Chart: Bulls Defend the 1.3500 Handle
Moving down to the H4 chart, the impulsive nature of the current rally is clear. The pair surged through the 1.3500 psychological level, which had previously acted as a formidable ceiling.
What is particularly encouraging for bulls is the “retest and depart” behavior seen around the 1.3500 mark. The H4 RSI (currently at 65.7) recently flagged a “BEAR” pivot, leading to a minor cooling-off period.
However, as long as the price remains comfortably above the 1.3378 structural support and the ascending moving averages, the intraday path of least resistance remains to the upside.
GBP/USD Four-Hour Chart, April 16, 2026
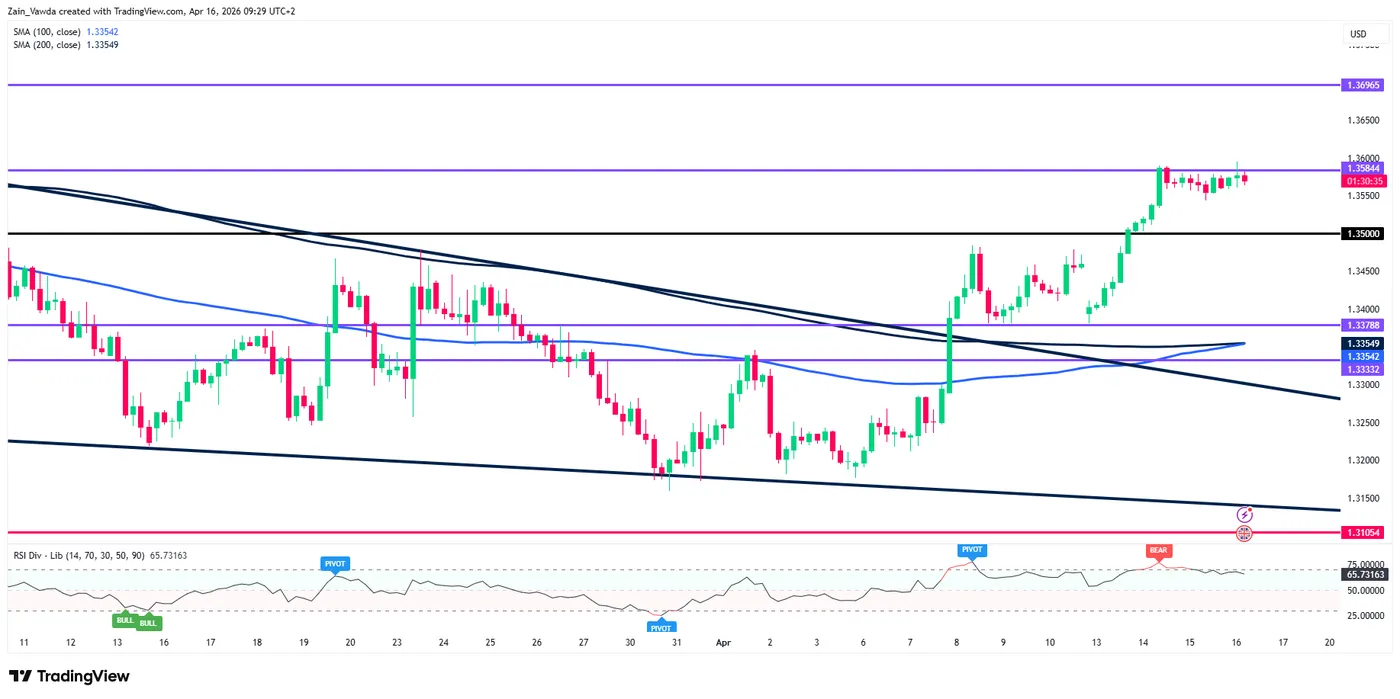
Source: TradingView
H1 Chart: Session Scenarios & Intraday Levels
The hourly chart shows Cable currently consolidating in a tight range between 1.3560 and 1.3585. The 100-MA (blue) on this timeframe is providing immediate dynamic support at 1.3509.
The Bullish Scenario
For the rally to extend in the upcoming session, we need to see a sustained hourly close above the 1.3584 resistance level (the purple line). A successful breach here would likely see a quick test of the 1.3600 psychological barrier, with the door then opening for a move toward 1.3650. Bulls should look for high-volume candles on the breakout to confirm the move isn’t a “bull trap.”
The Bearish Scenario
The bearish case rests on the potential for a “double top” or exhaustion near 1.3585. If the pair fails to clear this hurdle and slips below 1.3540, we could see a deeper retracement toward the 1.3500 pivot. This area aligns with the 100-period SMA on the H1, making it a critical “line in the sand” for intraday bulls. A break below 1.3500 would signal a broader corrective phase toward 1.3422.
Key Levels to Watch:
- Resistance: 1.3584, 1.3600, 1.3696
- Support: 1.3500, 1.3444 (Daily 100-MA), 1.3378
GBP/USD One-Hour Chart, April 16, 2026
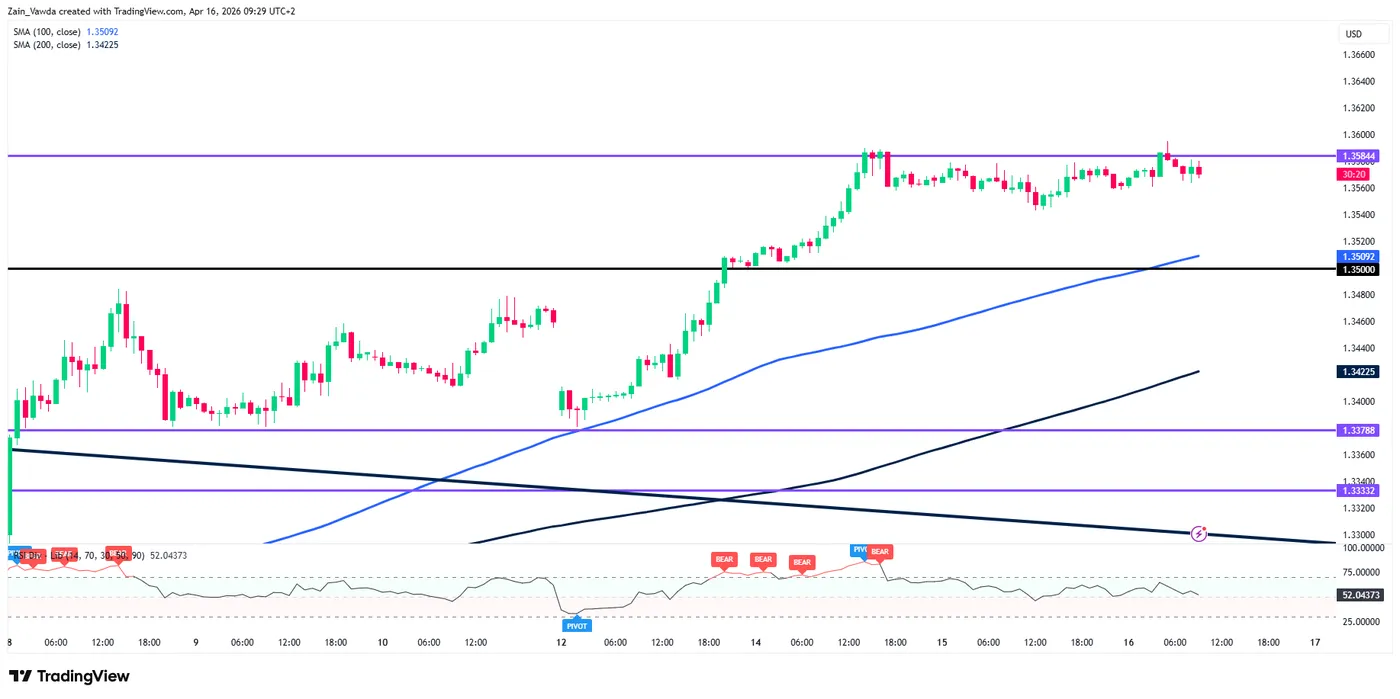
Source: TradingView
GBP/USD is clearly the “pro-cyclical” choice at the moment, benefitting from the broader USD retreat. While short-term overextension is a risk, the daily structural breakout suggests that any near-term weakness should be viewed as an opportunity for bulls to reload.


