
USD/JPY was once again the main target for US Dollar bulls amid the ongoing major US-Iran War, which began on February 27 (with a positive twist in the past week and a half).
Energy commodity prices have more than doubled since the imposition of ceaseless supply restrictions from Iran’s capture of the Strait of Hormuz. WTI and Brent Crude prices have at some point risen by more than 100% and are remaining about 35% higher than they were just at the beginning of February.
A significant portion of Asian crude oil imports depends on this region. As a result, prices for both physical crude and refined products have soared.
This was seen as a particular strain on the Eastern continent, and the clearest evidence is in the change in Jet Fuel prices.
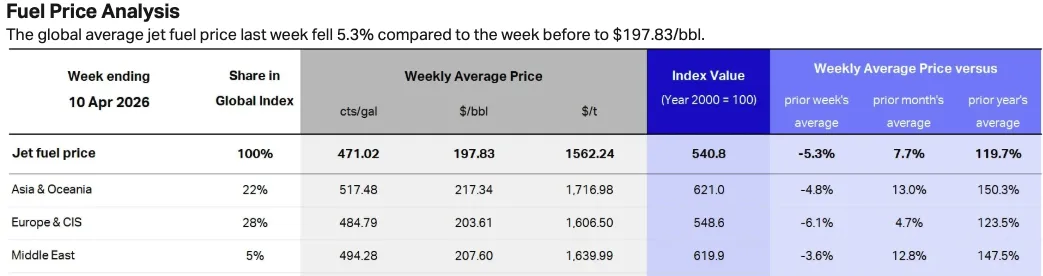
Jet Fuel Prices Averages in Asia and Europe – Source: IATA. April 17, 2026
For such a populous region, particularly dependent on fossil fuels for electricity production and manufacturing, this has proven quite damaging.
Luckily for Japan, it has held the largest proven strategic oil reserves in the world, but this hasn’t helped Forex hawks severely punish the JPY against the dominant US Dollar.
Victim of its own confused Monetary Policy, with largely expected rate hikes progressively fading out due to slower inflation reports and contradicting policymakers, the Land of the Rising Sun was the target of a large FX repricing.
Luckily for the Yen, the conflict is now priced to end soon.
The Strait of Hormuz was announced reopened this morning, with statements from both the US and Iran, and the Administration pushing for it to move forward with the negotiations.
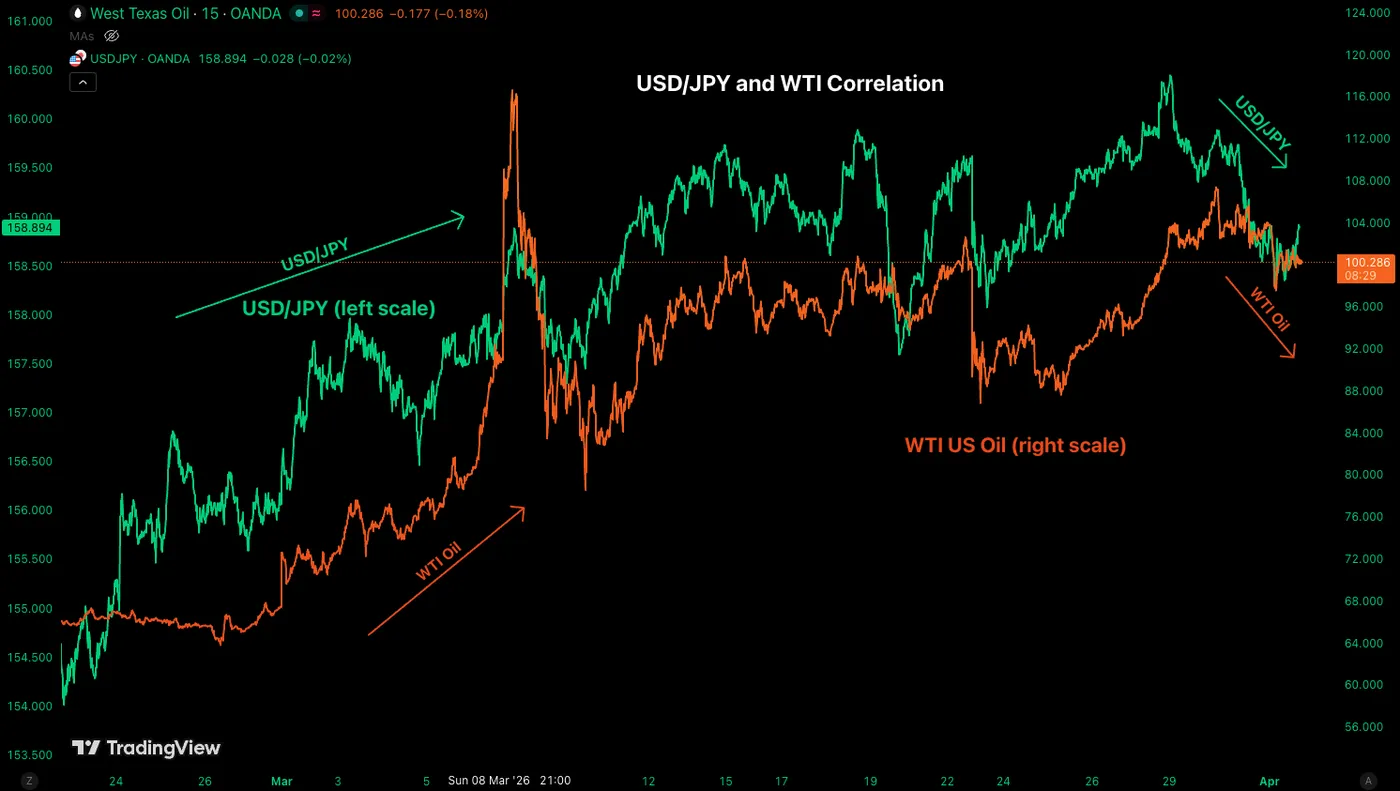
USD/JPY and WTI Correlation. April 17, 2026 – Source: TradingView
USD/JPY has now entered a corrective phase, which could extend if the conflict were to end.
With a Head and Shoulders pattern forming, it will be important to see whether this move indeed has legs, pointing to longer-term bearish positioning in the pair.
Let’s dive right into a multi-timeframe analysis for the Gopher – more commonly named, USD/JPY.
USD/JPY Multi-Timeframe Analysis
Daily Chart
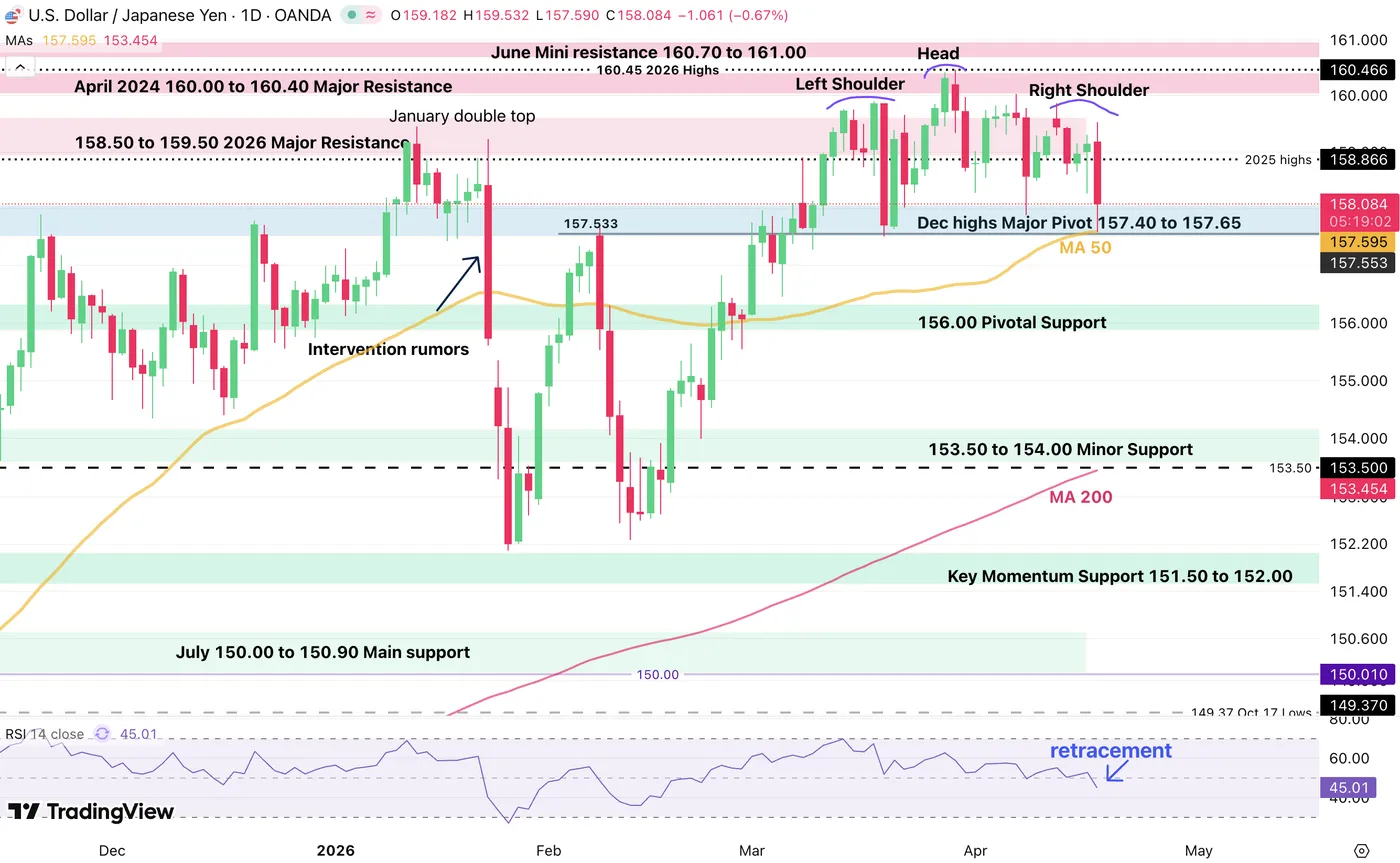
USD/JPY Daily Chart. April 17, 2026 – Source: TradingView
USD/JPY is now entering a potentially significant corrective phase, pushing towards a break of the range established since March 10.
Testing and wicking at the 50-Day Moving Average (157.60), mean-reversion buying has faded the morning move, but the Daily RSI, now falling in bearish territory, is pointing to a move that could have just begun.
Let’s take a closer look.
4H Chart and Technical Levels
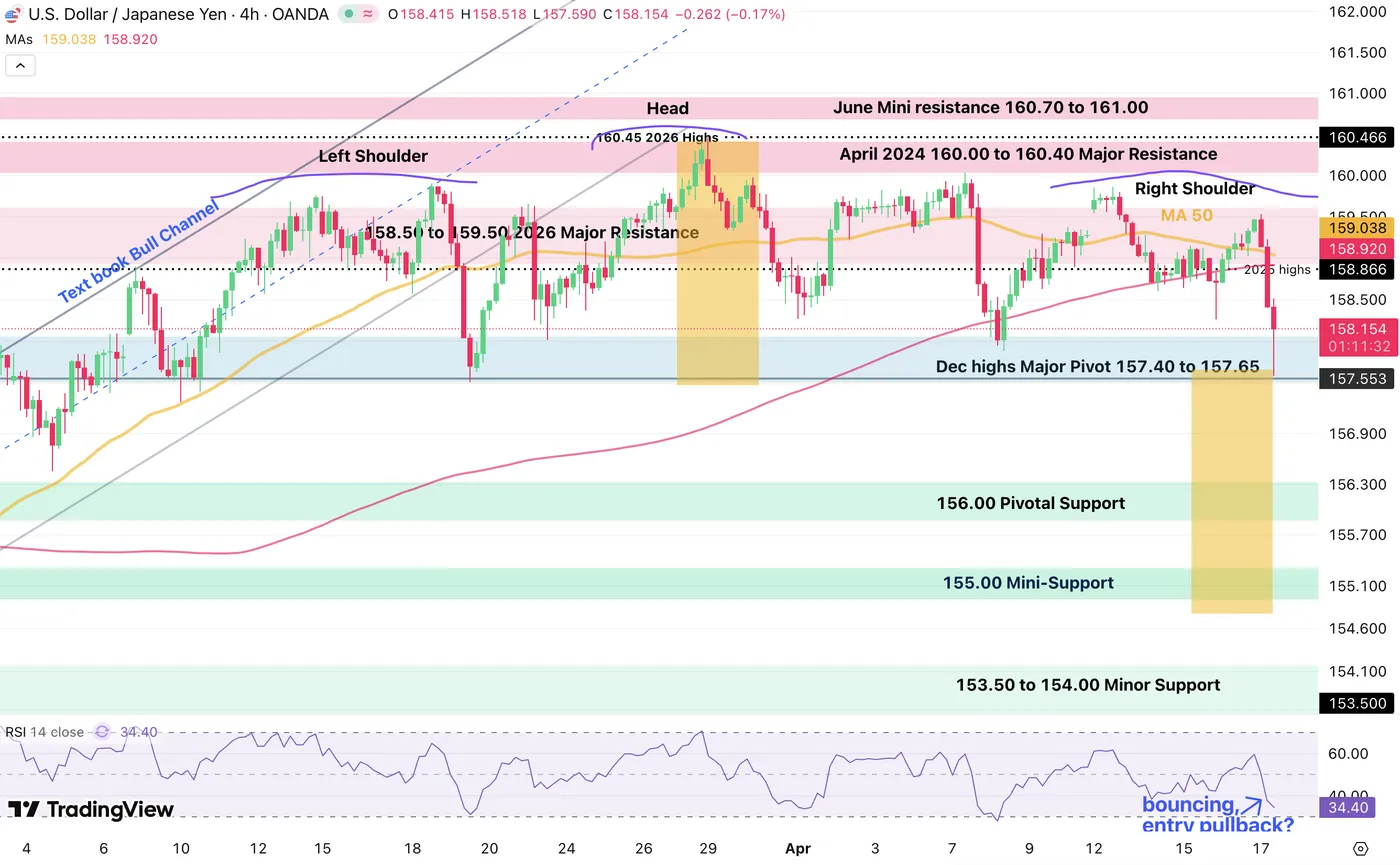
USD/JPY 4H Chart. April 17, 2026 – Source: TradingView
The action shows a bit more details on the morning volatile action, with buyers re-entering at the precise 157.533 lows reached on March 19.
With the RSI quickly falling, the action is now close to oversold which could prompt interesting mean-reversion to offer pullback entry opportunities.
A break of the morning lows could extend to the 155.00 Mini-Support, target of the Head & Shoulders measured move.
Resistance levels
- 158.50 to 159.50 2026 Major Resistance (pullback interest)
- 4H 200-period MA 158.920
- April 2024 160.00 to 160.40 Major Resistance
- June Mini resistance 160.70 to 161.00
Support levels
- 157.533 lows reached on March 19 (bearish below)
- December highs Major Pivot 157.40 to 157.85
- 156.485 4H 200-period MA
- 156.00 Pivotal Support
- 155.00 Mini-Support
Safe Trades and wishing you a pleasant week-end ahead!


.)