
Key takeaways
- Risk-on rebound fuels copper rally: Copper surged ~17% from its March low, driven by improved sentiment after the US–Iran ceasefire, recovering most war-related losses and stabilizing near pre-conflict levels.
- Fundamentals are still supportive: Global manufacturing activity remains in expansion (PMI diffusion ~72%), providing a solid demand backdrop for copper, with upcoming flash PMI data as a key near-term catalyst.
- Bullish flag signals potential breakout: A consolidation pattern suggests continuation higher if 6.0680 breaks, targeting 6.1755–6.2910; failure below 5.8790 risks a deeper pullback toward moving average support zones.
Copper (XCU/USD) has also benefited from a revival of risk-on appetite in the past seven trading sessions due to the temporary two-week ceasefire agreement between the US and Iran since 8 April 2026 to negate the risk of stagflation driven by fears of a prolonged global oil supply disruption.
Dr Copper has benefited from recent risk-on behaviour
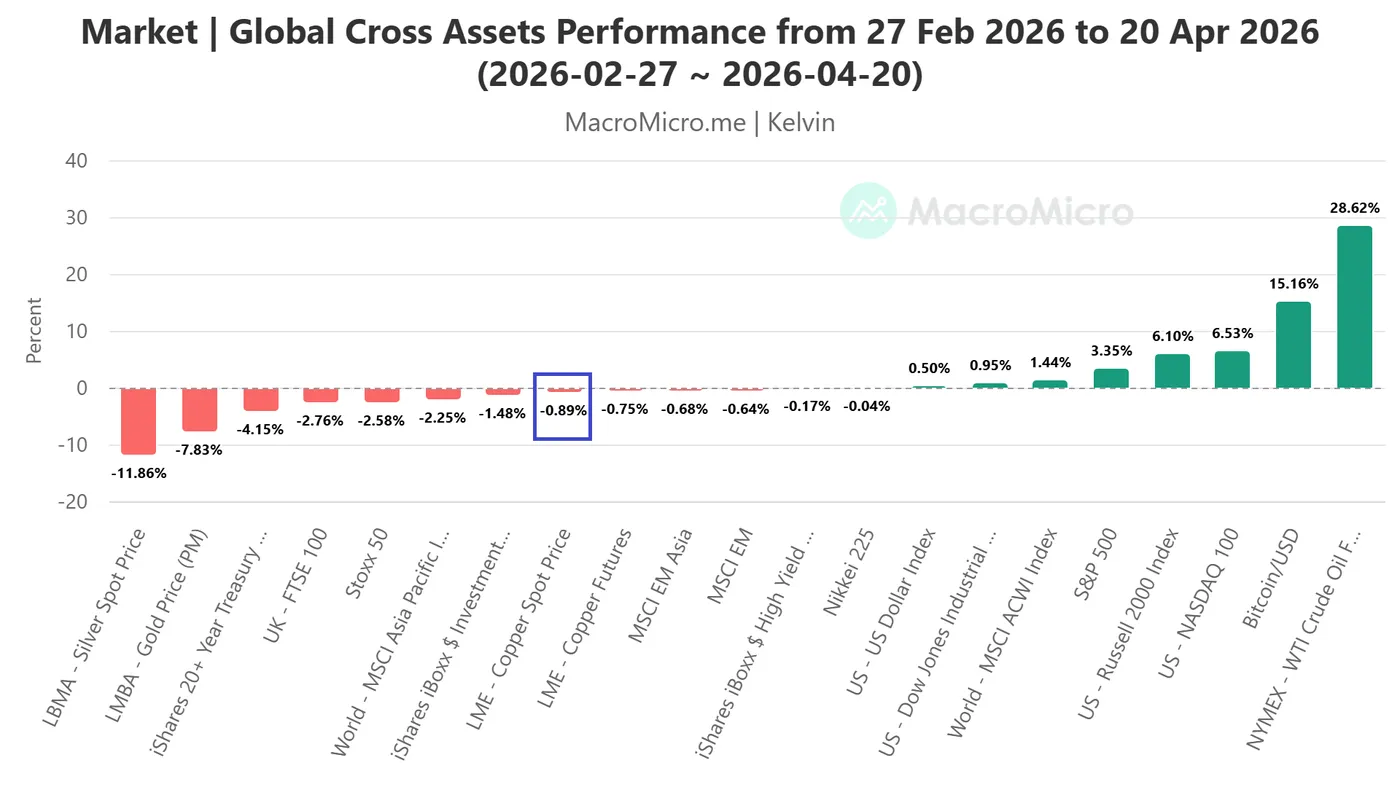
Fig. 1: Global Cross Assets Performance from 27 Feb 2026 to 20 Apr 2026 (Source: MacroMicro).
Copper has rallied by 17% from the 23 March 2026 low of 5.1889 to print a two-month high of 6.1037 on 15 April 2026 as market participants look forward to a peace deal resolution between the US and Iran, erasing its early loss of 14% from the onset of the US-Iran war. Based on the 27 February 2026 pre-war baseline till Monday, 20 Apr 2026, LME spot copper has traded almost unchanged at -0.75% (see Fig. 1).
In the past three days, a game of poker has emerged as both sides are trying to build a “stronger hand” ahead of the second round of peace talks to take place in Pakistan, either on Tuesday or Wednesday, as stated by US President Trump via a media interview.
The US has continued to enact a naval blockade on Iranian-registered oil tankers in the Strait of Hormuz, and Iran has continued to force a closure in the strait to prevent international vessels from transporting and obtaining oil supplies in the GCC region.
Global manufacturing PMI is the second driver to watch
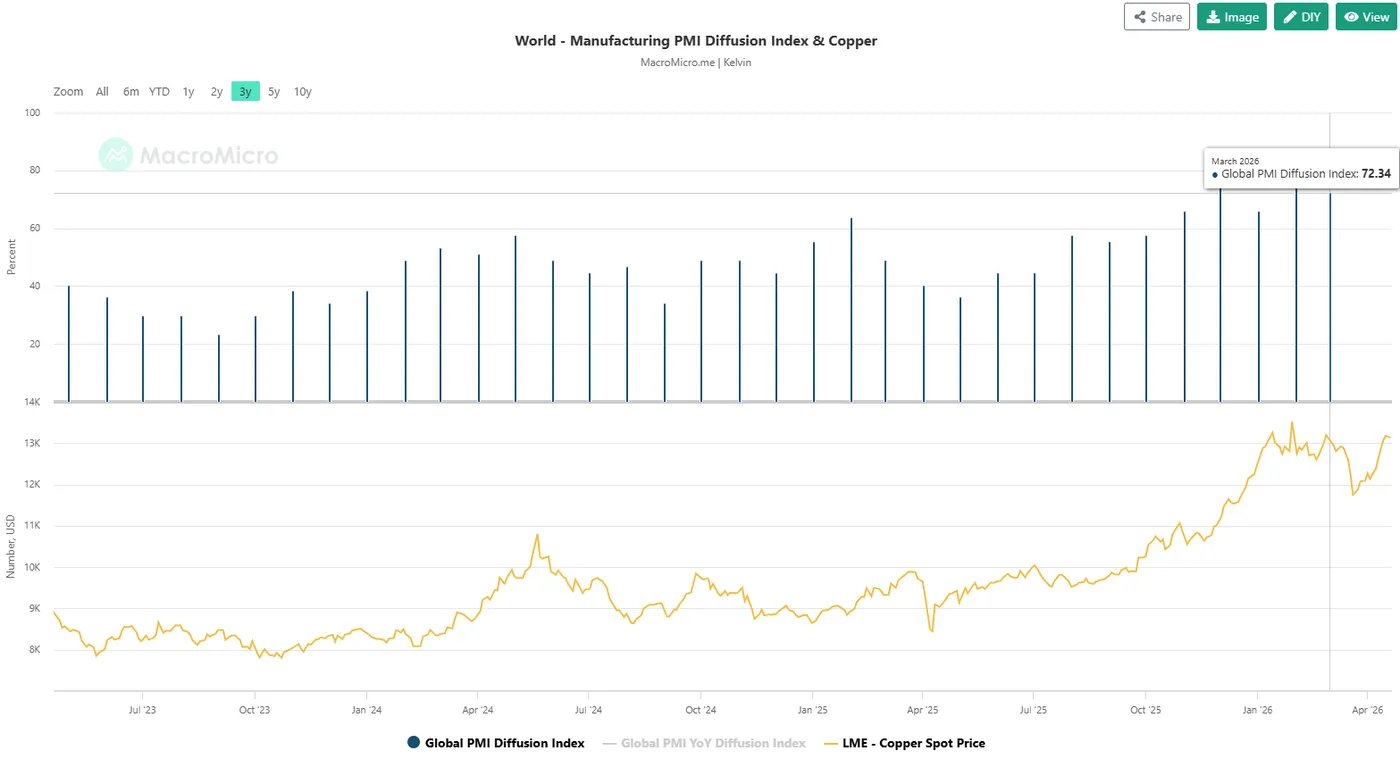
Fig. 2: Global Manufacturing PMI Diffusion Index as of March 2026 (Source: MacroMicro).
The longer-term price movement of copper is highly sensitive to manufacturing activities, as it is a vital component in the global manufacturing supply chains and industrial usage. Higher manufacturing activities tend to translate to a higher demand for copper, in turn, creating a positive feedback loop into the price of copper.
Manufacturing Purchasing Managers’ Index data compiled by S&P Global can be used as a leading indicator to gauge manufacturing activities.
Despite the rising risk of stagflation in the past six weeks since the start of the US-Iran war on 28 February 2026, on the aggregate, global manufacturing activities were still growing at a modest pace in March 2026.
The PMI Diffusion Index measures the proportion of countries whose manufacturing PMI is above or equal to 50 (an indication of expansion in activities), where it stood at 72.3% in March 2026, just down slightly from 74.5% in April 2026 (see Fig. 2).
Hence, there are still more than 50% of global economies’ manufacturing sectors in expansion modes, in turn, providing long-term bullish support for copper prices.
On Thursday, 23 April 2026, S&P Global will release flash PMI data for a slew of developed economies (Australia, Japan, the Eurozone, the UK, and the US). Therefore, a continuation of the expansion pace seen in these economies’ manufacturing PMIs is likely to maintain the ongoing short-term bullish trend of copper (XCU/USD).
Let’s now focus on the short-term trajectory (1 to 3 days) of copper (XCU/USD) and its supporting elements from a technical analysis perspective.
Copper (XCU/USD) – Potential upside trigger at 6.0680
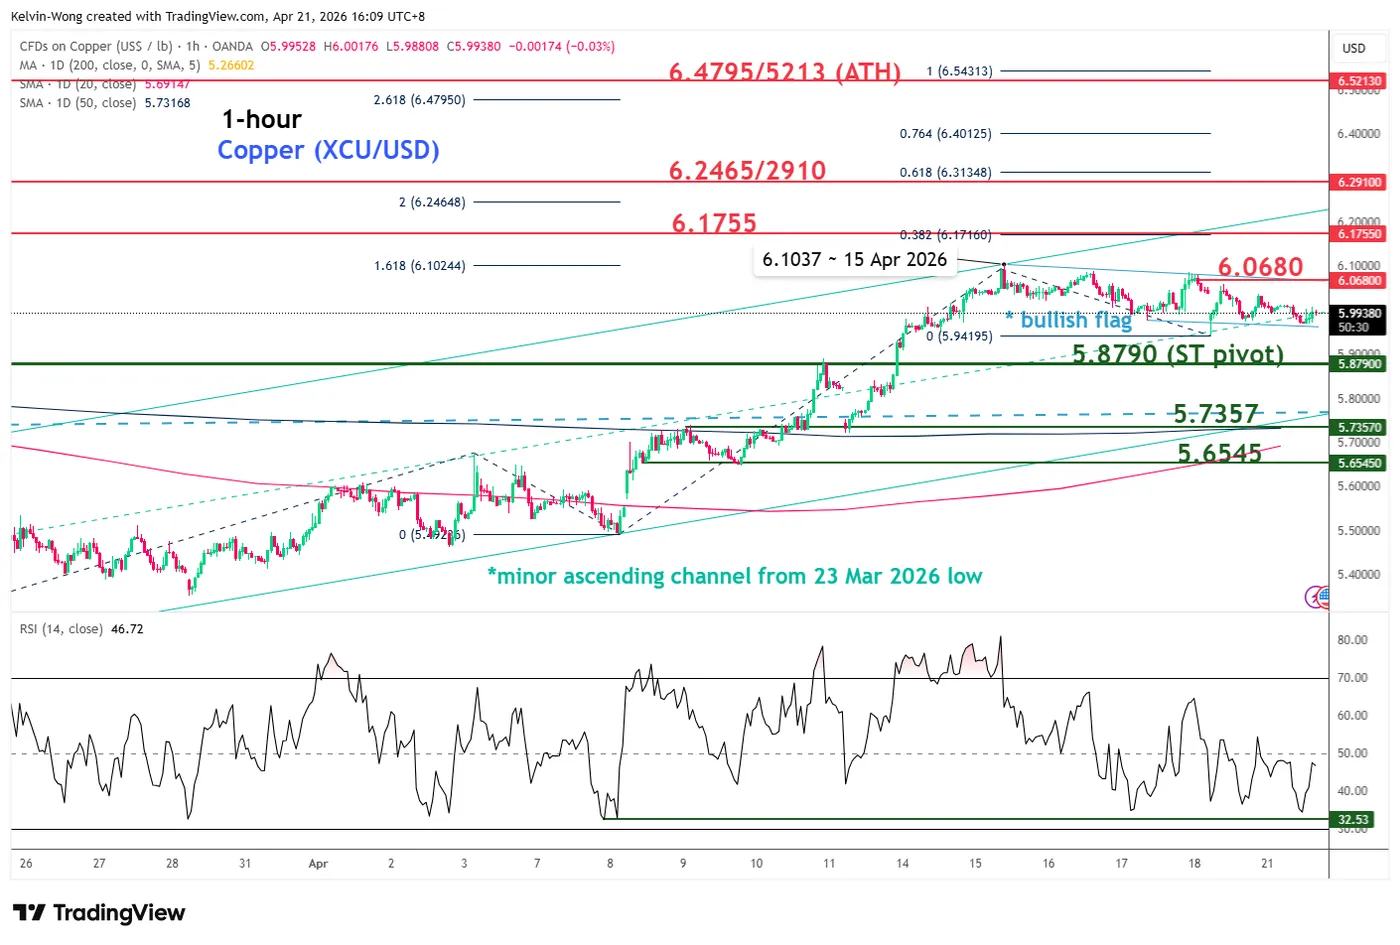
Fig. 3: Copper (XCU/USD) minor trend as of 21 Apr 2026 (Source: TradingView).
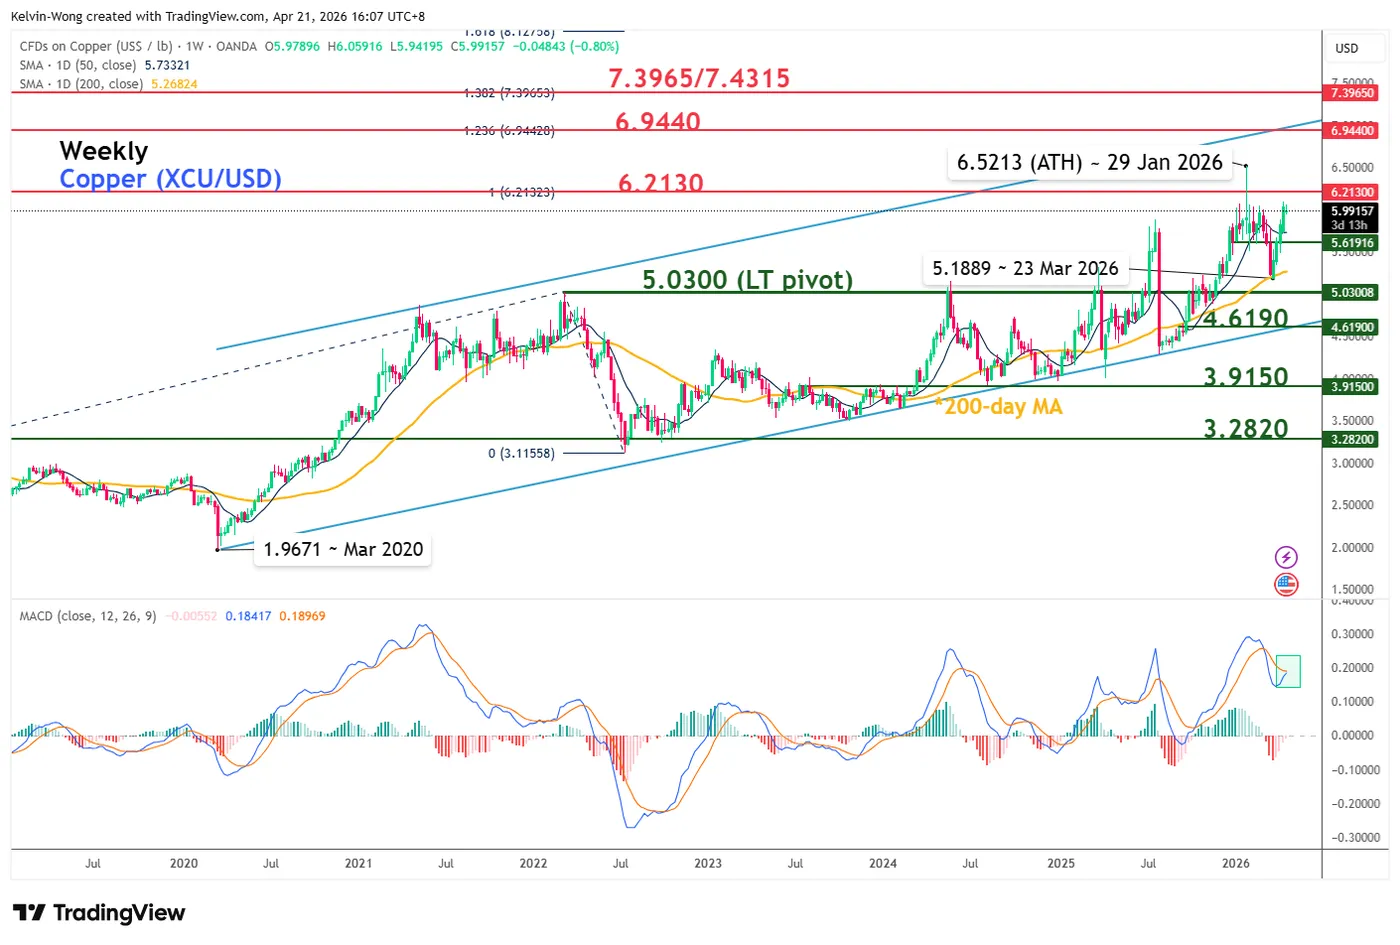
Fig. 4: Copper (XCU/USD) long-term secular trend as of 21 Apr 2026 (Source: TradingView).
Copper (XCU/USD) has shaped a minor corrective pull-back of 2.65% from its recent two-month high of 6.1037 printed on 15 April 2026.
Watch the 5.8790 key short-term pivotal support, and a clearance of 6.0680 (upper boundary of the bullish flag) triggers the start of another potential bullish impulsive up move sequence (see Fig. 3).
The next intermediate resistances stand at 6.1755 and 6.2465/6.2910 (also a Fibonacci extension).
On the other hand, a break and an hourly close below 5.8790 invalidates the bullish tone for another round of minor corrective decline to expose the next intermediate support zone of 5.7357/5.6545 (also the 20-day and 50-day moving averages).
Key elements to support the near-term bullish bias on copper (XCU/USD)
- The recent corrective pull-back from the 15 April 2026 high of 6.1037 has taken the form of a bullish consolidation chart pattern called “bullish flag,” with its upper boundary acting as near-term resistance at 6.0680.
- The price action of copper (XCU/USD) has continued oscillating within a minor ascending channel in place since the 23 March 2026 low and still has room to move towards the upper boundary of the channel at around 6.1755/6.2910.
- The hourly RSI momentum indicator has managed to stage a rebound close to its support at the 32 level.


