
The ceasefire has been extended—but so has the uncertainty. Markets initially braced for escalation after US–Iran talks were cancelled, but sentiment quickly stabilized when US President Donald Trump announced an indefinite extension of the ceasefire. The move removed immediate downside risks, but did not resolve the underlying conflict.
Oil is reflecting that middle ground. Brent is pressing near the $100 mark but has not broken through decisively. That suggests traders are factoring in ongoing disruption in the Strait of Hormuz without committing to a full escalation scenario. Equities are echoing the same message. Asian markets, with the exception of Hong Kong, are largely treading water.
There are a few important points to note about the current situation. Firstly, the extension is not unconditional. Trump made clear the pause depends on Iran submitting a “unified proposal”. This conditional framework means the risk of escalation has not disappeared—it has simply been deferred.
Secondly, a central uncertainty is whether and when talks will resume. While the ceasefire extension buys time, it does not guarantee progress. Any next step depends on teh “fractured” Iran leadership presenting a coherent negotiating position—something that remains far from certain.
Since the death of Supreme Leader Ayatollah Ali Khamenei in late February, decision-making authority has become fragmented. A collective leadership structure has emerged, but divisions between pragmatists and hardliners appear to be slowing the formation of a unified stance.
This fragmentation has direct implications for diplomacy. While Iran’s civilian leadership may signal openness to talks, the IRGC continues to operate independently, particularly in the Strait of Hormuz. This disconnect makes it difficult for external parties to interpret Iran’s true negotiating position.
For markets, the implications are clear. The ceasefire has reduced immediate risks, but it has also extended the period of uncertainty. Traders are not unwinding positions, but they are also not adding new exposure, waiting instead for confirmation of the next move.
Until then, the dominant theme remains unchanged: no escalation, but no clarity. And in that environment, markets are likely to stay cautious, reactive, and highly sensitive to headlines.
In the currency markets, Kiwi remains the strongest one for the week so far, followed by Loonie, and then Swiss Franc. Yen is the worst, followed by Euro, and then Dollar. Sterling and Aussie are positioning in the middle of the pack.
In Asia, at the time of writing, Nikkei is up 0.18%. Hong Kong HSI is down -1.33%. China Shanghai SSE is up 0.29%. Singapore Strait Times is down -0.45%. Japan 10-year JGB yield is up 0.016 at 2.402. Overnight, DOW fell -0.59%. S&P 500 fell -0.63%. NASDAQ fell -0.59%. 10-year yield rose 0.04 to 4.29.
Gold and Silver Recover as US Extends Iran Ceasefire, But Technical Weakness Emerges
Ceasefire relief helped stabilize Gold and Silver—but technical cracks are forming. The next move depends on whether support levels hold. Read More.
Japan’s Exports Rise 11.7% in March, Trade Surplus Misses
Japan posted another solid month for exports, led by semiconductors and China demand. But the trade surplus still missed expectations as imports jumped on energy costs and a weaker Yen. Read More.
Australia Westpac Leading Index Turns Negative, Signals Below-Trend Growth Ahead.
Australia’s growth signal has turned negative. The Westpac Leading Index now points to below-trend growth, but rising energy costs and inflation risks keep RBA rate hikes firmly on the table. Read More.
EUR/AUD Daily Outlook
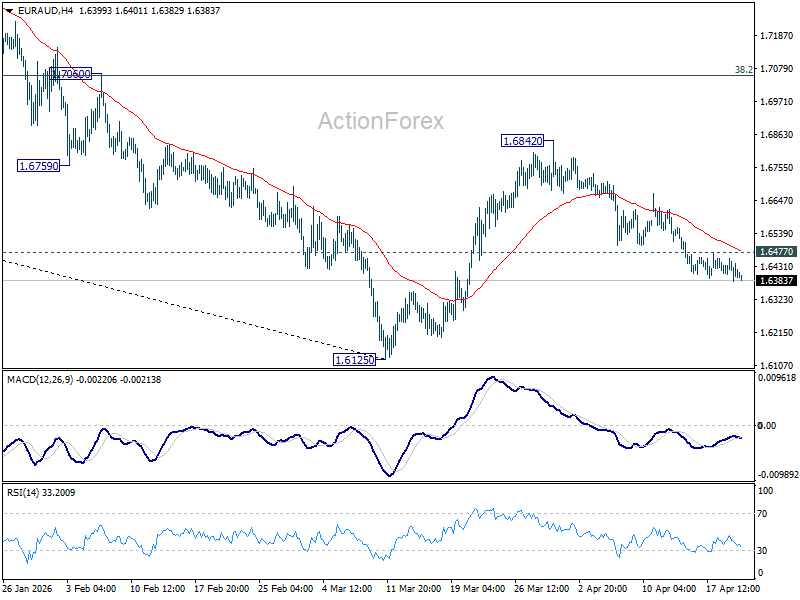
Daily Pivots: (S1) 1.6383; (P) 1.6422; (R1) 1.6459; More…
Intraday bias in EUR/AUD stays on the downside as fall from 1.6842 is extending. Deeper decline should be seen to retest 1.6125 low. Firm break there will resume whole down trend from 1.8554 to 1.5913 fibonacci level next. On the upside, above 1.6477 minor resistance will turn intraday bias neutral first.
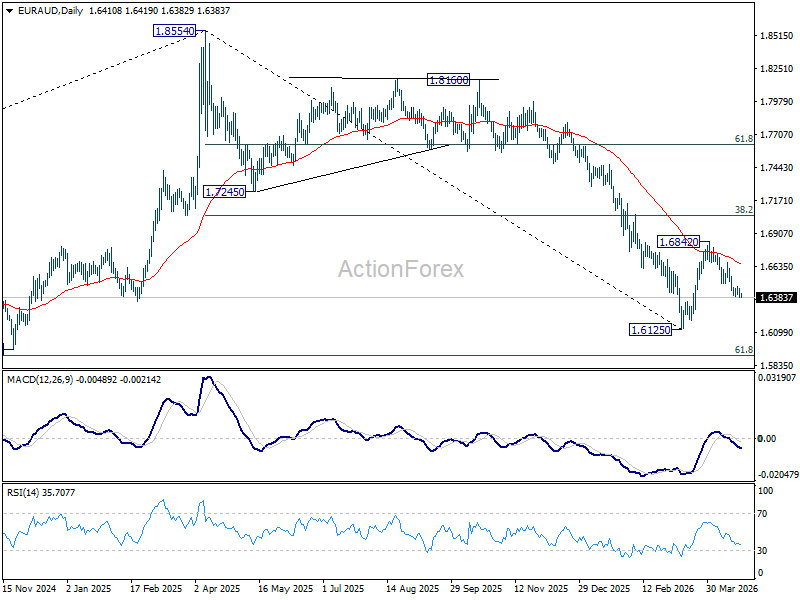
In the bigger picture, fall from 1.8554 (2025 high) is in progress and deeper decline should be seen to 61.8% retracement of 1.4281 to 1.8554 at 1.5913, which is slightly below 1.5963 structural support. Decisive break there will pave the way back to 1.4281 (2022 low). For now, risk will stay on the downside as long as 55 W EMA (now at 1.7131) holds, even in case of strong rebound.


