
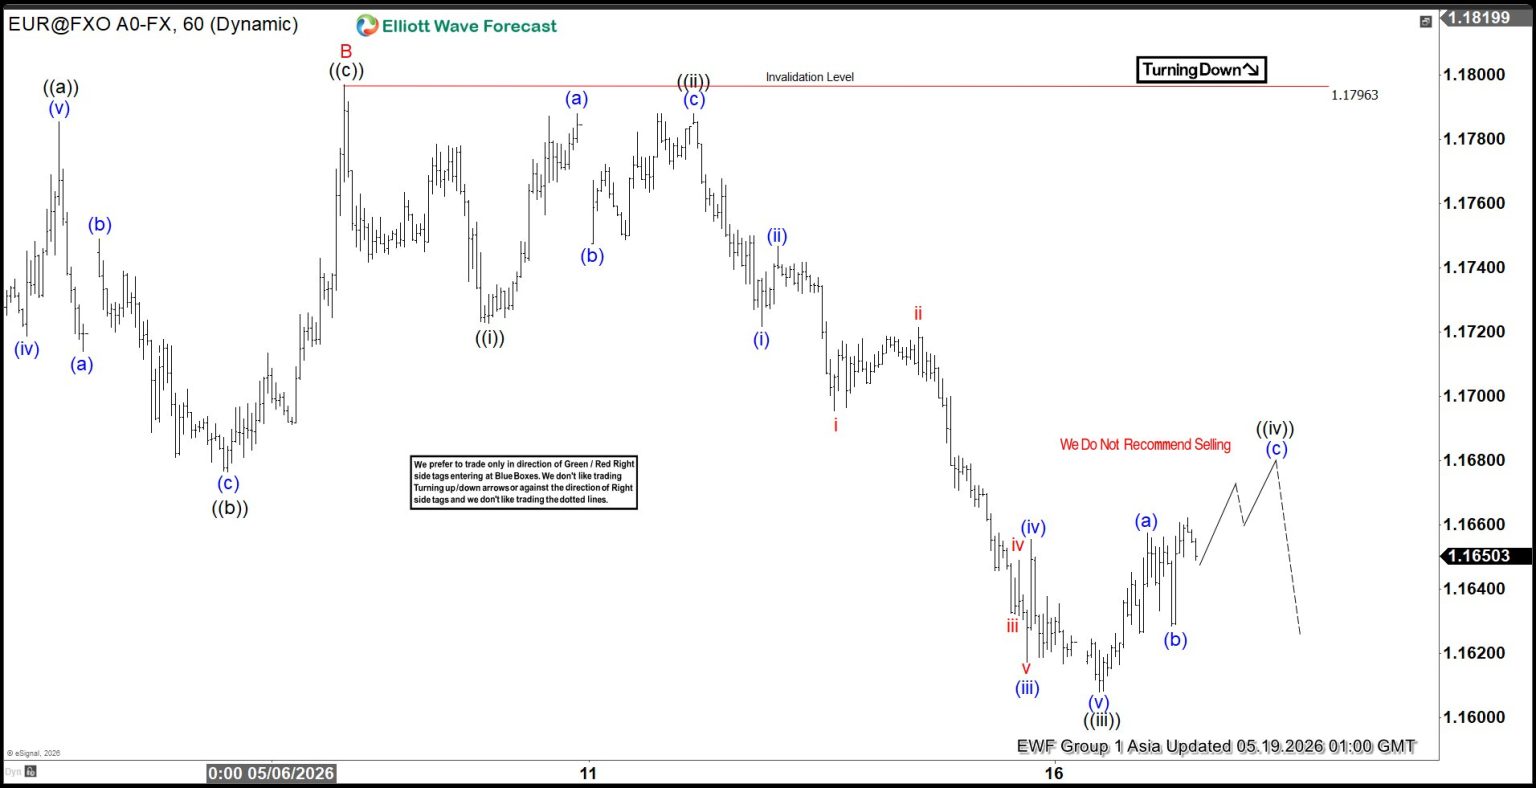
EURUSD is unfolding a corrective zigzag structure from the April 17, 2026 high. First, wave A ended at 1.1655, establishing the initial leg of the decline. Then, wave B rallied to 1.1796, as shown on the one‑hour chart. From that point onward, wave C began to progress lower, subdividing into five smaller waves. This subdivision aligns with Elliott Wave guidelines and confirms the corrective nature of the move.
Specifically, wave ((i)) concluded at 1.1722, after which wave ((ii)) rallied to 1.1788. Subsequently, the pair resumed its decline in wave ((iii)), which extended toward 1.1608. Now, wave ((iv)) is advancing as a rally. Importantly, resistance should appear in the 1.168–1.171 zone, where sellers may re‑emerge.
Moreover, as long as the pivot at 1.18 holds, rallies are likely to fail in either three or seven swings. Consequently, the bearish sequence should continue. The potential target for wave C can be projected using the Fibonacci extension of wave A. In particular, the 100%–161.8% extension range provides a reliable measurement. This calculation identifies 1.148–1.16 as the target zone. At that level, buyers are anticipated to appear. As a result, the market could attempt a new high above the April 17 peak or develop a larger three‑wave rally.
EURUSD 60-Minute Elliott Wave Chart
EURUSD Elliott Wave Video:
You are currently viewing a placeholder content from Default. To access the actual content, click the button below. Please note that doing so will share data with third-party providers.


