
The US Dollar is back on a strong path higher since last week, already looking to erase some of its April softness.
Kevin Warsh was confirmed as the next Federal Reserve Chairman after a lengthy, unpredictable political process and financial markets are already experiencing significant changes.
The Warsh trade is slowly being priced in, reinforcing the idea of a more austere monetary policy. Ongoing supply chain disruptions caused by conflict and rising oil prices make near-term rate cuts unlikely, signalling a major shift from what investors were awaiting throughout the past year.
At the heart of this market shift is the idea of a smaller Federal Reserve balance sheet, suggesting a level of monetary restraint not seen since before the Great Financial Crisis.
Unlike typical quantitative tightening, this approach may aim to reduce the central bank’s balance sheet far more aggressively.
Since Warsh is President Trump’s nominee, traders are still unsure if he will pursue such an independent and hawkish policy, but his past views suggest he might.
As a result, investors are anxious to hear Warsh’s first public comments, with his swearing-in set for this Friday.
Even before he speaks, expectations of a reduction in liquidity are boosting the US Dollar, which is rising sharply against other currencies.
The dollar’s strength reflects how foreign exchange markets are adjusting to wider yield gaps and the prospect of a potentially tighter monetary policy.
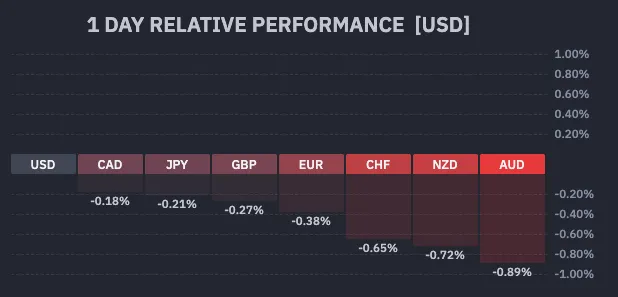
Current session’s FX performance. Source: Finviz, May 19, 2026.
We will look at the Dollar Index, EUR/USD, and GBP/USD to spot how the Warsh trade has already impacted the FX market and where to look next.
Dollar Index 4H Chart
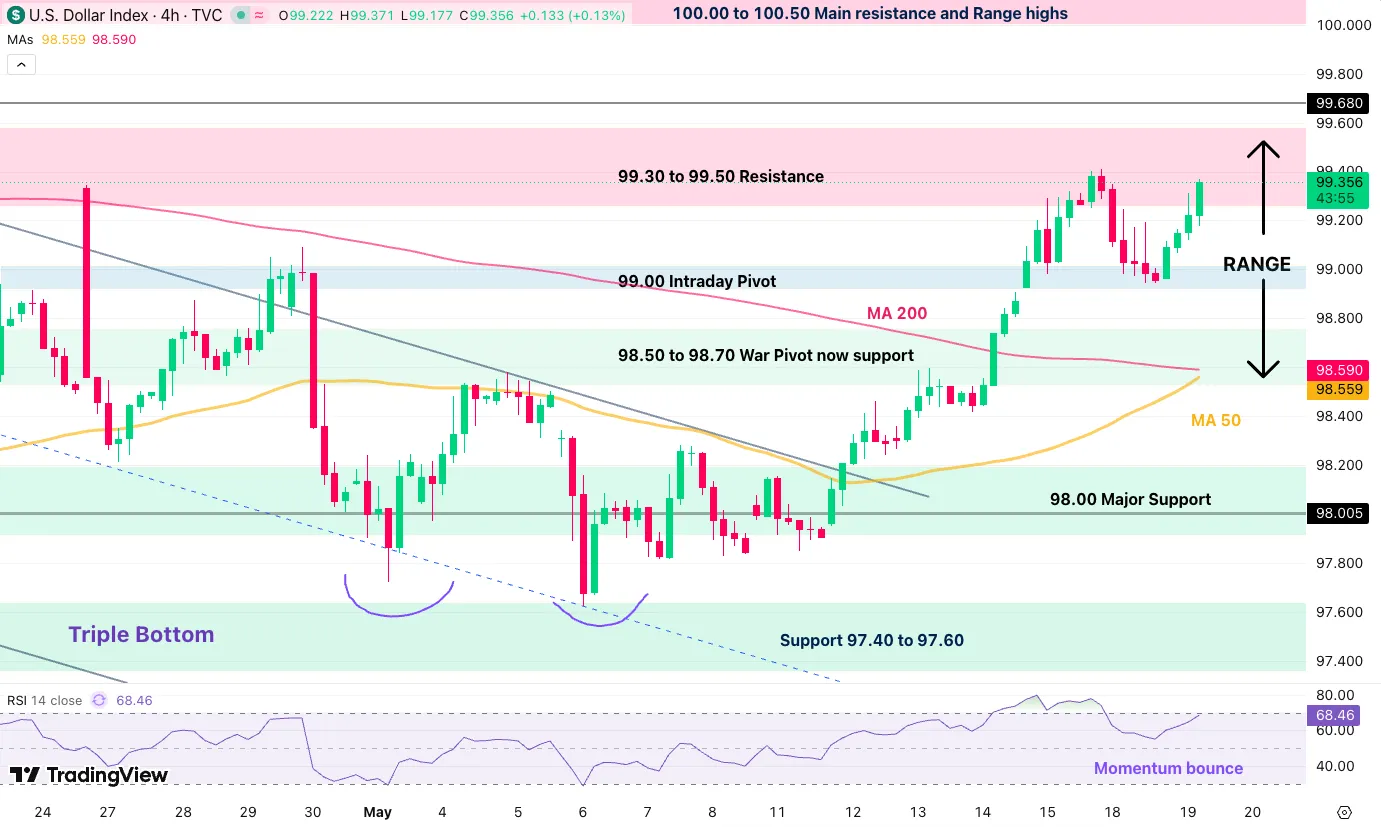
Dollar Index 4H chart. Source: TradingView, May 19, 2026.
The US Dollar bulls are attacking the key 99.50 resistance area, which served as a top to last week’s initial explosion.
Current bull candles are showing a strong push that could easily retake the 99.415 top, with the formation of a tight bull channel, also following an upward trendline.
Above 99.50, expect a fast-paced continuation towards 100.00. Below 99.00, however, the price action provides a more rangebound picture, hence immediate reactions and today’s close will be essential to watch.
Levels of interest for the Dollar Index:
Resistance Levels
- 99.40 to 99.50 resistance, past week highs 99.415
- Initial war spike 99.68
- 100.00 to 100.50 main resistance zone
- War highs 100.544
Support Levels
- 99.00 intraday pivot
- 98.50 to 98.70 war pivot now support
- Support 97.40 to 97.60, triple bottom
- 2025 lows 96.40 to 96.80 support
- Range lows at early 2022 consolidation just below 96.00
GBP/USD 4H Chart and Technical Levels
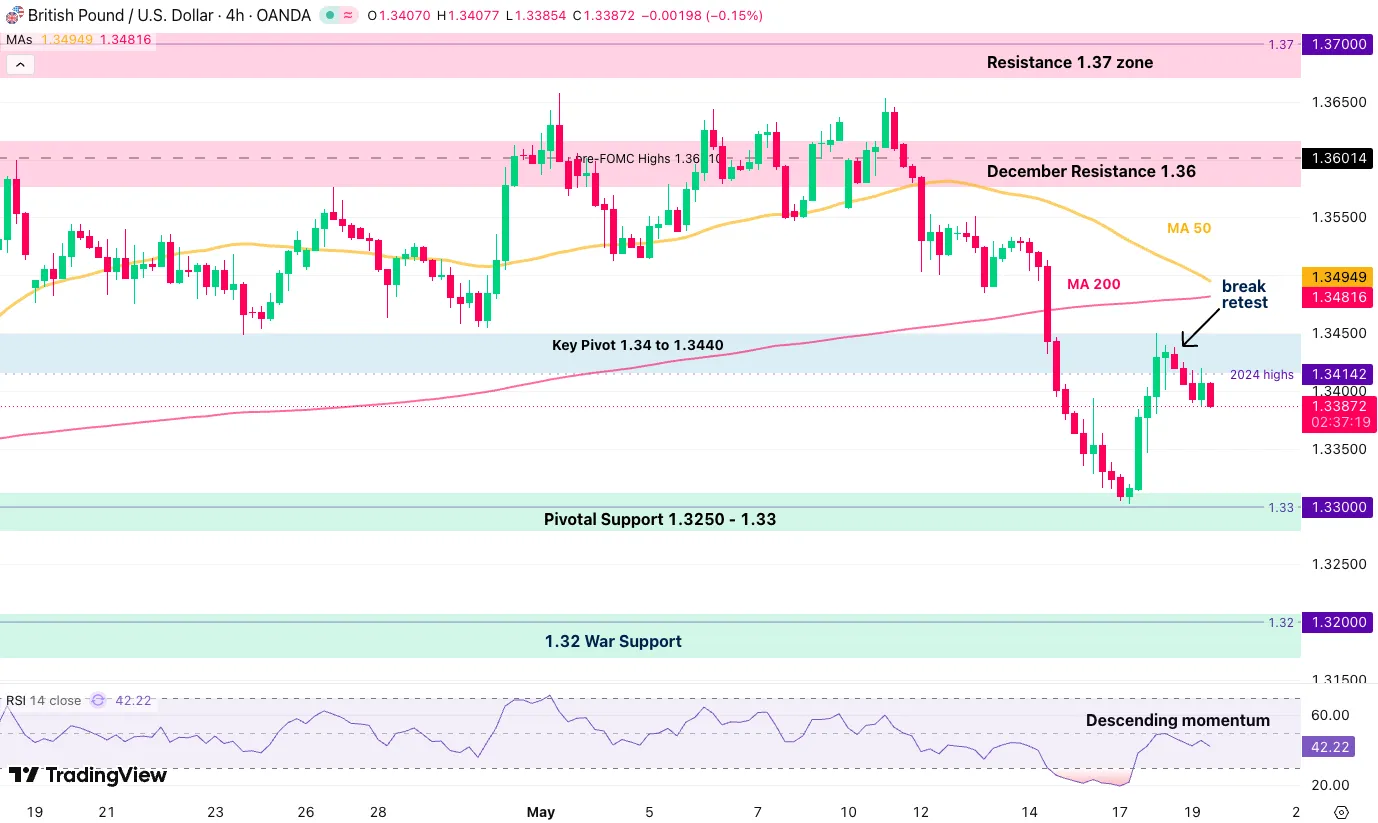
GBP/USD 4H chart. Source: TradingView, May 19, 2026.
Since our last analysis of the major FX pair, the price action completely reversed. Having rejected the 1.36 major resistance on a fakeout, sellers quickly took control of the action.
This weekly open allowed a pullback right at the 1.34 to 1.3450 pivot zone, and the ongoing rejection points to a highly probable retest of the 1.33 level.
A break below would be plausible, with no clear support areas until 1.32 after that, the war lows.
Levels of interest for GBP/USD:
Resistance Levels
- Key pivot 1.34 to 1.3450
- December resistance 1.36, range highs
- Pre-FOMC highs 1.36010
- Resistance 1.37 zone
- 2025 resistance around 1.38
Support Levels
- Pivotal support 1.3280 to 1.33
- 1.32 war support
EUR/USD 4H Chart and Technical Levels
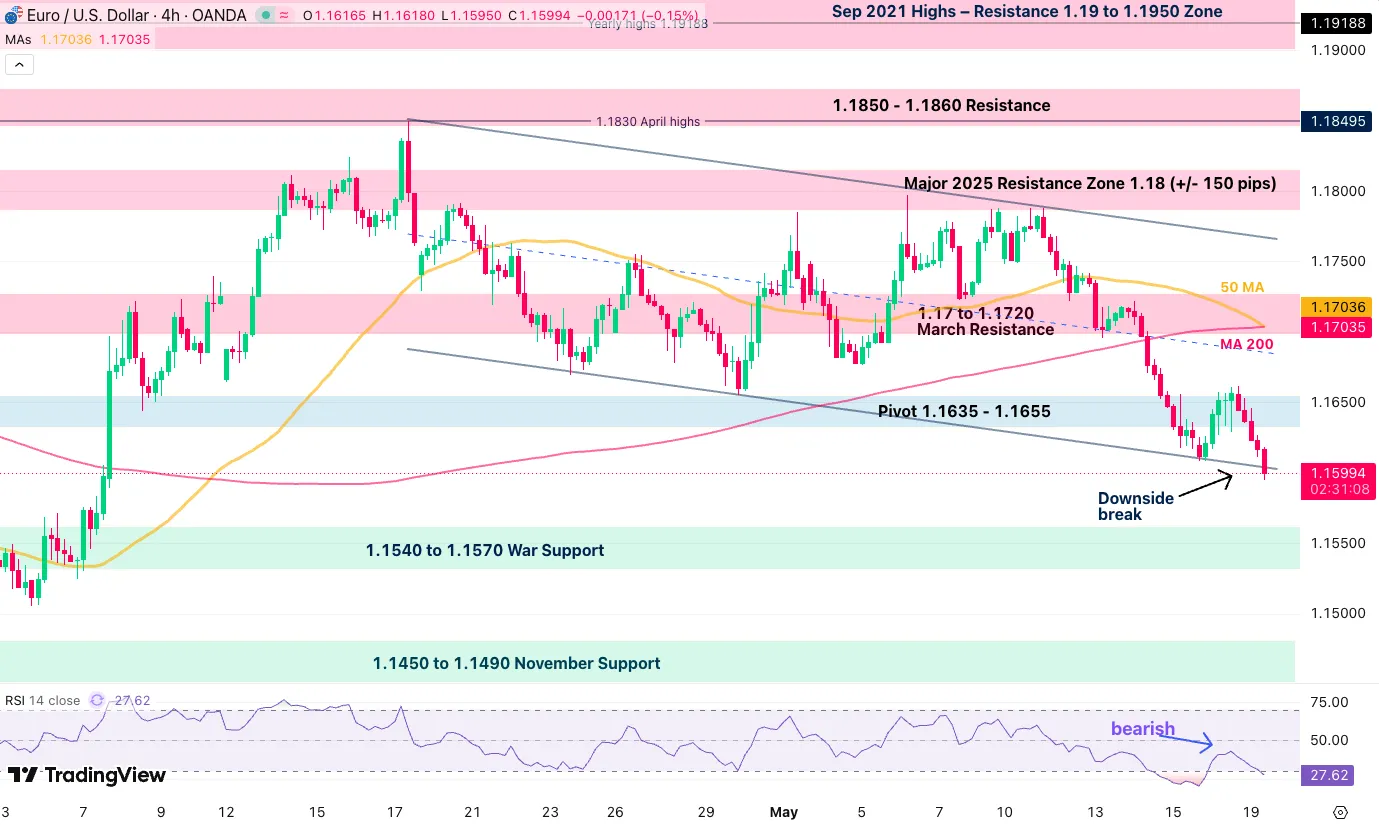
EUR/USD 4H chart. Source: TradingView, May 19, 2026.
EUR/USD has been under heavy pressure since last week, with sellers leading a 2,000-pip move lower in an attempt to break the low-slope descending channel. Add to it a death cross, with the 50-period MA crossing below the 200 MA, and the action is decisively bearish.
While the price action is strong, the pair is reaching some oversold levels, hence an immediate break could be less strong. Watch if the action closes below 1.16 to confirm a downside break.
The next target for bears is the 1.1540 to 1.1570 war support.
Levels to place on your EUR/USD charts:
Resistance Levels
- Pivot 1.1635 to 1.1655
- 1.17 to 1.1720 March resistance
- Resistance zone around 1.18, +/- 150 pips
- 1.1830 June 2025 highs
Support Levels
- 1.1540 to 1.1570 war support
- 1.1475 to 1.15 November support
- War lows 1.1410
Safe trades.


