
The DOW is sending a very different message from the rest of Wall Street. While the S&P 500 and NASDAQ spent much of the past two sessions showing signs of caution ahead of today’s FOMC rate decision, the DOW Jones Industrial Average pushed to a new record high. Under normal circumstances, traders would be reluctant to chase stocks higher with inflation still elevated and a potentially hawkish Fed just hours away. This time, however, another force appears to be dominating the calculation: oil.
The collapse in crude prices following the US-Iran peace breakthrough has dramatically changed the outlook for large parts of the traditional economy. Brent crude has fallen below USD 80 as markets increasingly price the reopening of the Strait of Hormuz and the gradual restoration of normal energy flows. For industrial companies, transport firms and manufacturers that make up much of the DOW, lower energy costs effectively act as a tax cut. Investors appear convinced that this benefit is large enough to offset the threat posed by a moderately hawkish Fed.
That explains why the DOW’s rally has continued even as traders prepare for one of the most important policy decisions of the year. The Fed is widely expected to leave rates unchanged at 3.50%-3.75%, and there is little room for surprise in the rate decision itself. With ultra-dove Stephen Miran having left the committee to allow Kevin Warsh to become Chair, as Jerome Powell stays as Governor, no member is expected to advocate a cut. Equally, recent comments from the committee’s hawkish wing suggest it is not yet ready to argue for an immediate rate hike. Hence, the decision will very likely be unanimous.
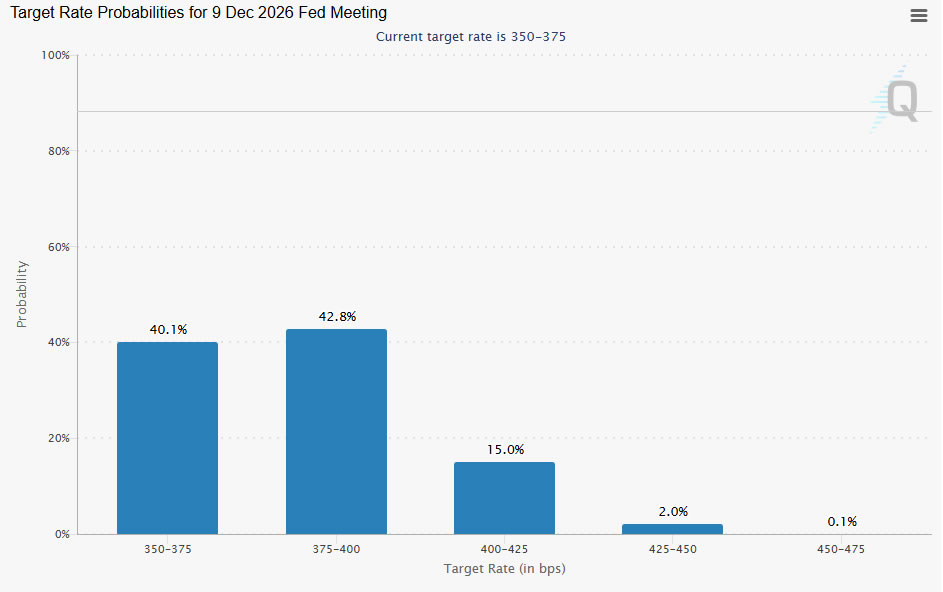
Fed funds futures currently imply roughly a 60% chance of one or more rate hikes by the end of the year, suggesting investors retain a hawkish bias but little conviction about the eventual outcome. Economists are even more skeptical that tightening will be required. In a recent Reuters survey, 72 of 102 economists, or around 70%, forecast that the federal funds rate will remain unchanged in the current 3.50%-3.75% range through the end of 2026.
So, the focus instead falls on the statement, the dot plot and Warsh’s first press conference.
Markets broadly expect the Fed to remove the easing bias that previously implied the next move would likely be a cut. The median projection is also expected to shift from one rate cut this year to no change through the end of 2026. Neither development would fundamentally shock investors because both are already largely reflected in market expectations.
The real risk lies deeper in the dot plot. Two or three rate-hike projections would likely be dismissed as the views of the committee’s usual hawks. Four or more hike dots would be much harder to ignore. At that point, investors may begin to question whether the Fed is moving from a “higher for longer” stance toward actively contemplating further tightening. That would represent a much more serious challenge for risk assets.
Warsh’s press conference could prove equally important, although there is a twist. Markets want clarity on whether he views the recent inflation surge as a temporary energy shock or the beginning of a broader second-round inflation problem. Yet Warsh has spent years arguing that central bankers should speak less, not more. Investors may spend weeks preparing questions only to discover he has little interest in providing detailed answers.
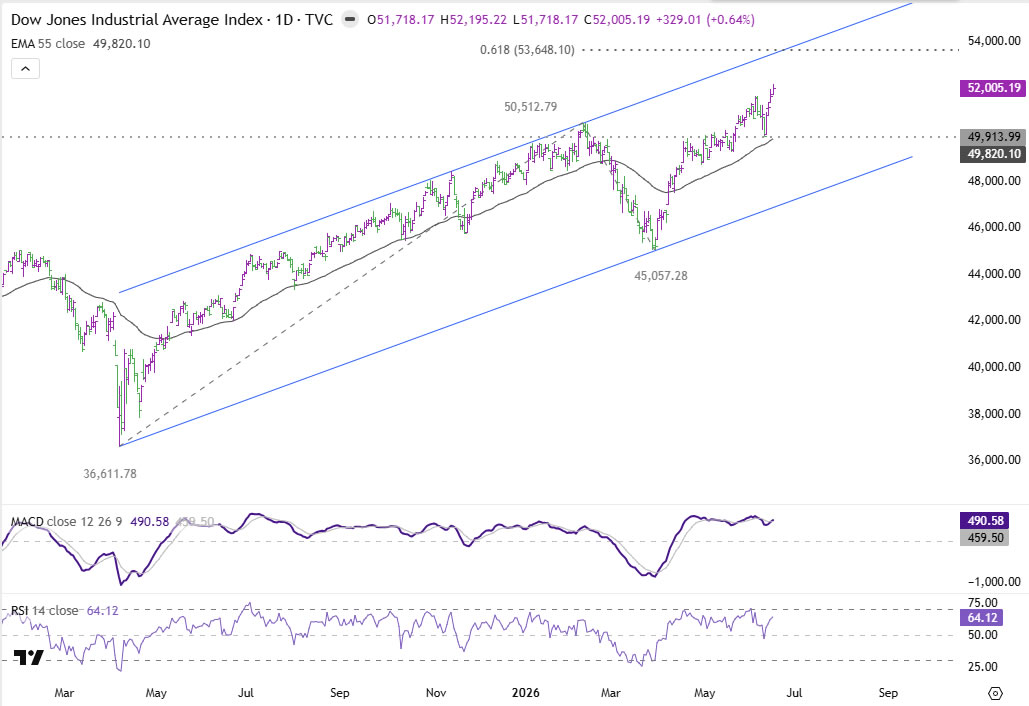
Technically, the DOW’s trend remains firmly higher. As long as support at 49,913 holds, the advance from last year’s lows remains intact and points toward the next major target at 61.8% projection of 36,611 to 50,512 from 45,057 at 53,648. Falling oil prices have given the index a powerful tailwind just as the market approaches a critical Fed meeting. Unless policymakers signal they are seriously contemplating another rate hike, cheaper energy may continue to matter more than tighter monetary policy.


