


On 11 August, the US Energy Information Administration (EIA) lowered its forecast for the average natural gas price in the third quarter to $2.87 per million BTU — 50 cents below its previous estimate. The main reason is increased domestic production and inventories, which could create the largest stockpile in a decade ahead of the start of the heating season. Planned maintenance at the Freeport LNG export terminal may have added further pressure to the balance by reducing demand for gas used in liquefaction. Meanwhile, global LNG trade had already faced shipping disruptions in the Strait of Hormuz in July, highlighting the market’s continued sensitivity to geopolitical risks.
Technical Analysis of Natural Gas
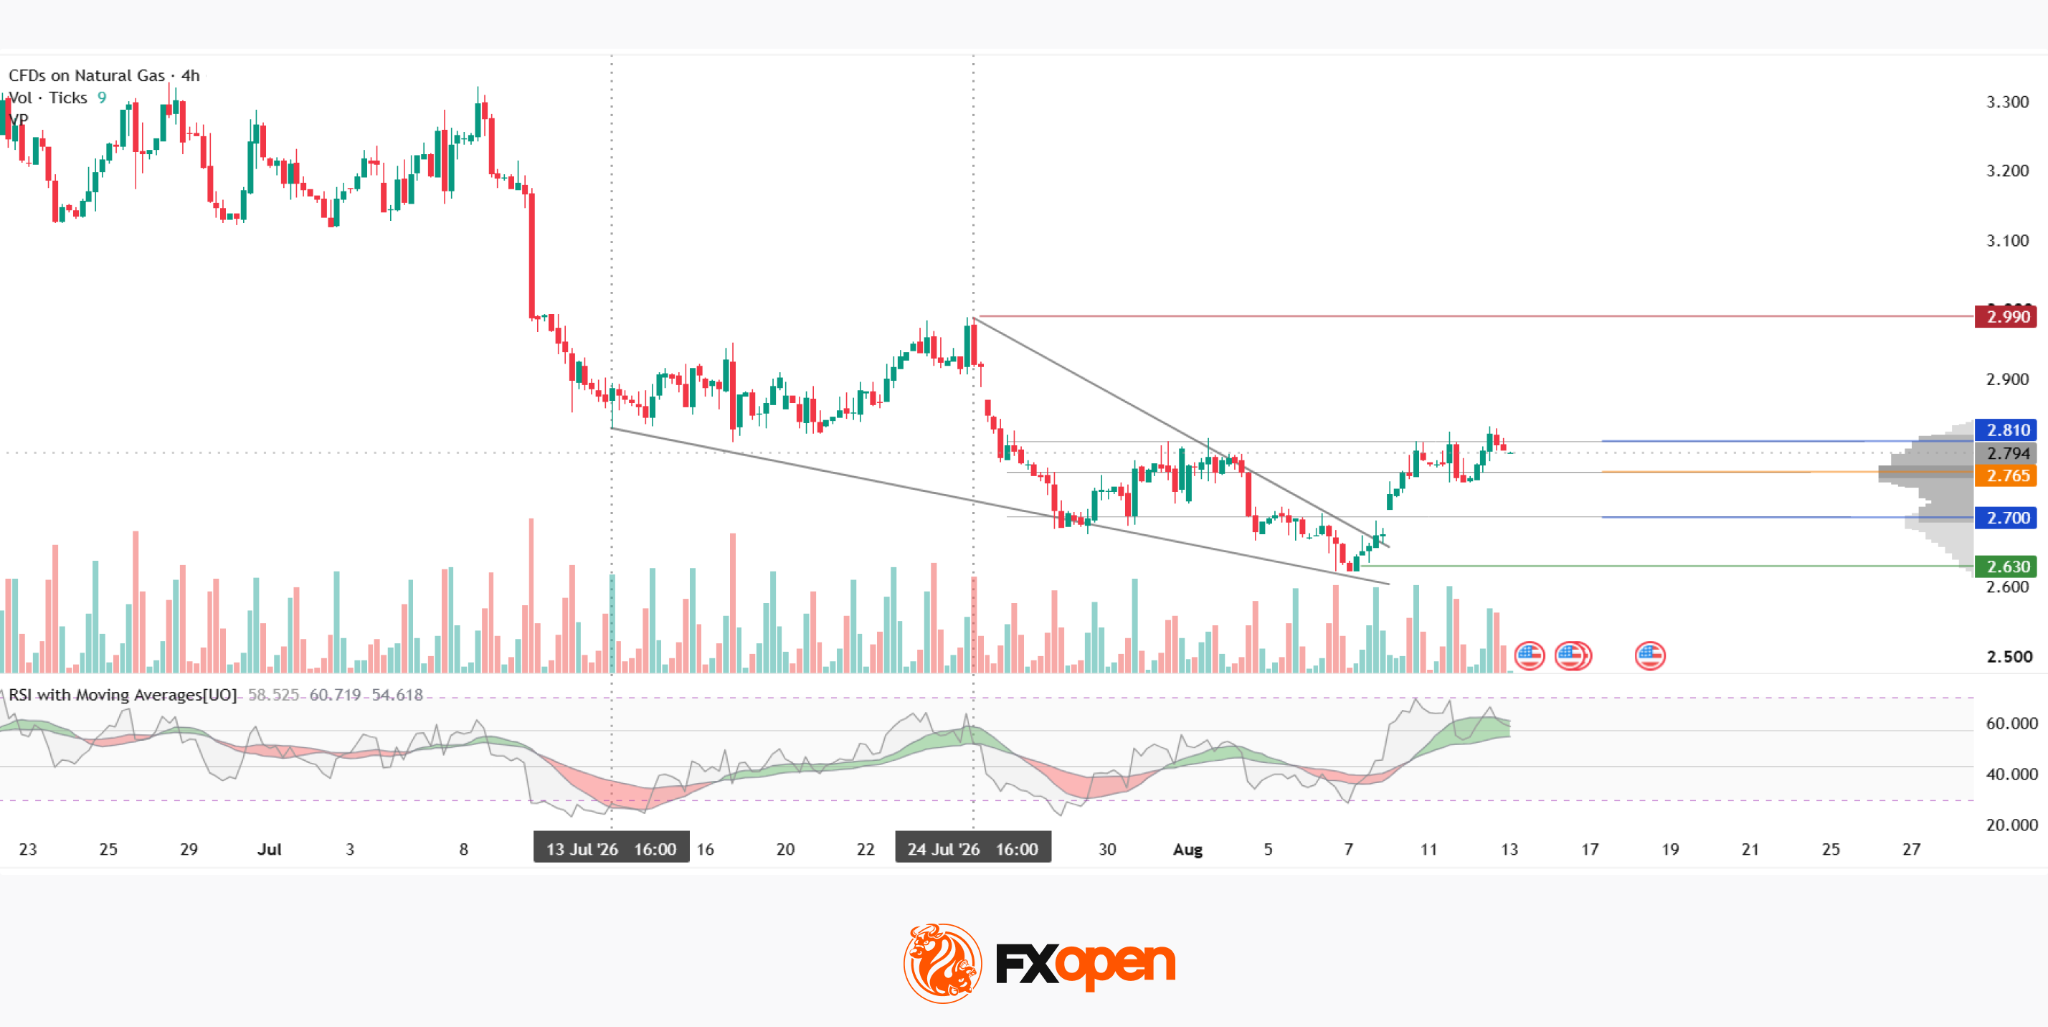
A descending wedge has formed on the XNGUSD (H4) chart, with the upper boundary being broken to the upside by a move that began on 10 August following a gap formed on notably below-average volume — a detail that calls the conviction behind the breakout into question.
Subsequent price action has been reduced to consolidation within the current profile: the price is currently moving between the Point of Control (POC) at $2.765 and the upper boundary of the profile at $2.810. The red resistance level at $2.990 is poised to meet the price near the base of the pattern.
If the breakout proves to be false, the price will have to overcome the market density within the profile. Should it break below the lower boundary at $2.700, prices could encounter resistance around the pattern’s apex at $2.630. The RSI + MAs indicator shows readings of 58, 60 and 54. Although the oscillator and fast moving average remain above the upper boundary of the neutral zone, the indicator’s slow MA has yet to move beyond it, leaving the signal incomplete.
Key Takeaways
Low volume on the breakout of the descending wedge, combined with the unresolved RSI + MAs signal, leaves the sustainability of the rise in question. The EIA’s softer price forecast, against a backdrop of record inventories, adds fundamental arguments for limiting the upside potential.
Start trading commodity CFDs with tight spreads (additional fees may apply). Open your trading account now or learn more about trading commodity CFDs with FXOpen.
This article represents the opinion of the Companies operating under the FXOpen brand only. It is not to be construed as an offer, solicitation, or recommendation with respect to products and services provided by the Companies operating under the FXOpen brand, nor is it to be considered financial advice.





 lowered its forecast for the average natural gas price in the third quarter to $2.87 per...)