
Dollar is trying to regain some ground in early US session after stronger than expected PPI. Both initial and continuing jobless claims also continued to trend lower. The greenback is followed by Euro and Yen while Aussie and Kiwi are softest. Though, major pairs and crosses are staying inside yesterday’s range for now. As for the week, Canadian Dollar is currently the strongest, , followed by Kiwi and Dollar. Swiss Franc, Euro and Yen are the weakest.
Technically, it looks like Dollar has just turned into sideway trading with yesterday’s retreat. For now, more sideway trading is likely. We’ll keep an eye on 110.01 minor support in USD/JPY and 1.1768 minor resistance in EUR/USD. The greenback’s rally would be in favor to resume as long as these levels holds. But break will indicate that deeper pull back is underway.
In Europe, at the time of writing, FTSE is down -0.20%. DAX is up 0.46%. CAC is up 0.39%. Germany 10-year yield is up 0.0149 at -0.444. Earlier in Asia, Nikkei dropped -0.20%. Hong Kong HSI dropped -0.53%. China Shanghai SSE dropped -0.22%. Singapore Strait Times rose 0.09%. Japan 10-year JGB yield dropped -0.0178 to 0.024.
US initial jobless claims dropped to 375k, above expectation
US initial jobless claims dropped -12k to 375k in the week ending August 7, above expectation of 367k. Four-week moving average of initial claims rose 1.75k to 396k.
Continuing claims dropped -114k to 2866k in the week ending July 31, lowest since March 14, 2020. Four-week moving average of continuing claims dropped -100k to 3101k, lowest since March 21, 2020.
US PPI rose 1.0% mom in Jul, accelerated to 7.8% yoy
US PPI for final demand rose 1.0% mom in July, above expectation of 0.6% mom. Over that last 12 months, PPI accelerated to 7.8% yoy, up from 7.3% yoy, above expectation of 7.4% yoy. That’s the largest yoy rate since November 2010.
PPI for final demand less foods, energy and trade services rose 0.9% mom, largest rise since January. Over the last 12 months, PPI for final demand less foods, energy and trade services rose 6.1% yoy, highest since August 2014.
Fed Daly: Talking about tapering later this year or early next year is where I’m at
San Francisco Fed President said in an FT interview that she remained “very optimistic and positive”. She added, “it’s appropriate to start discussing dialling back the level of accommodation that we’re giving the economy on a regular basis
“The starting point for that is of course asset purchases,” she said. “Talking about potentially tapering those later this year or early next year is where I’m at.”
On the employment markets, she said “we’re really adding enough jobs to see that we’re making progress towards our full employment goal.” While “we’re not there yet… we’re chipping away at the hole that was dug by Covid.”
Eurozone industrial production dropped -0.3% mom in Jun, EU down -0.2% mom
Eurozone industrial production dropped -0.3% mom in June, matched expectations. Production of capital goods fell by -1.5% and energy by -0.6%, while production of durable consumer goods and intermediate goods both rose by 0.1% and non-durable consumer goods by 1.6%.
EU industrial production dropped -0.2% mom. Among Member States for which data are available, the largest decreases were registered in Ireland (-4.4%), Portugal (-2.6%) and Denmark (-2.3%). The highest increases were observed in Malta (+5.2%), the Netherlands (+3.3%) and Estonia (+3.2%).
UK GDP grew 1.0% mom in June, 4.8% qoq in Q2
UK GDP grew 1.0% mom in June, matched expectations. That’s the fifth consecutive month of growth, GDP remained -2.2% below it’s pre-pandemic level in February 2020. Services was the main contributor, growing 1.5% mom. Production, on the other hand, dropped -0.7% mom while contraction also dropped -1.3% mom.
For Q2 as a whole, GDP grew 4.8% qoq, still -4.4% below the pre-pandemic level in Q4, 2019. ONS said, “there were increases in nearly all main components of expenditure apart from “trade”, with the largest contribution from household consumption”.
Industrial production came in at -0.7% mom, 8.3% yoy in June, versus expectation of 0.3% mom, 9.2% yoy. Manufacturing production was at 0.2% mom, 13.9% yoy, versus expectation of 0.4% mom, 29.5% yoy. Goods trade deficit widened to GBP -12.0B, versus expectation of GBP -10.1B.
Fitch affirms Japan rating at A with negative outlook
Fitch affirmed Japan’s Long-Term Foreign-Currency Issuer Default Rating (IDR) at ‘A’ with a “negative” outlook. The ratings “balance the strengths of an advanced and wealthy economy, with correspondingly robust governance standards and public institutions, against weak medium-term growth prospects and very high public debt”. The negative outlook reflected “uncertainty about the medium-term macroeconomic and fiscal outlook from the continuing pandemic”.
The rating agency expects economic growth of 22.5% in 2021 and 3.0% in 2022. But risks are to the downside, as the ongoing fifth Covid-19 wave may further delay recovery. Inflation is likely to “remain subdued”, averaging 0.3% in 2021 and 0.7% in 2022. Fitch also said BoJ is likely to maintain its current monetary policy settings over the “next few years”.
USD/JPY Mid-Day Outlook
Daily Pivots: (S1) 110.23; (P) 110.52; (R1) 110.72; More…
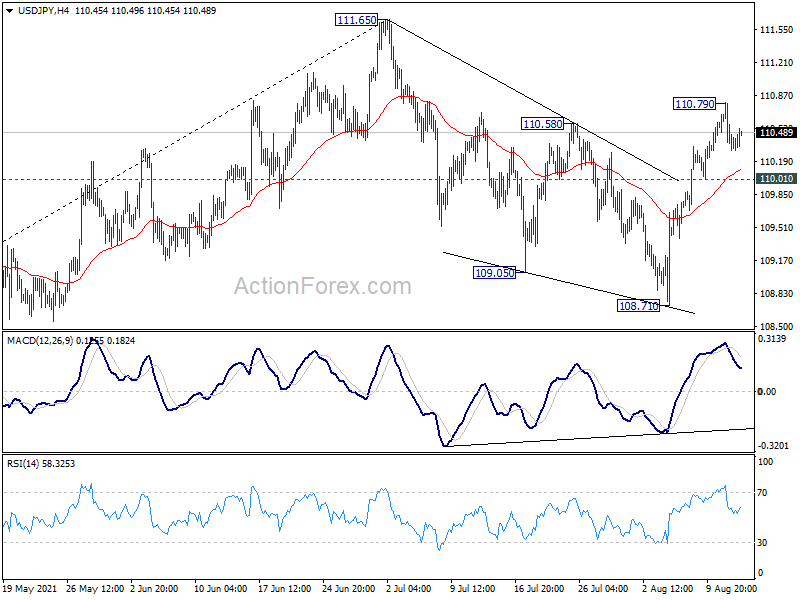
USD/JPY is staying in consolidation from 110.79 temporary top and intraday bias remains neutral. Outlook is unchanged that corrective fall from 111.65 should have completed with three waves down to 108.71. Another rise is in favor with 110.01 support intact. Break of 110.79 will turn bias to the upside for retesting 111.65 high. However, break of 110.01 will dampen this bullish view, and turn bias to the downside for 108.71 support.
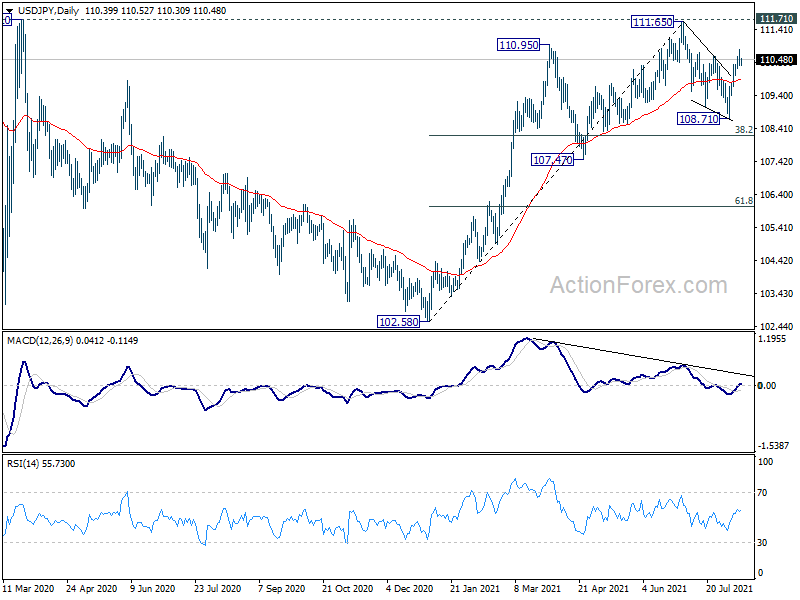
In the bigger picture, medium term outlook is staying neutral with 111.71 resistance intact. The pattern from 101.18 could still extend with another falling leg. Sustained trading below 55 day EMA will bring deeper fall to 107.47 support and below. Nevertheless, strong break of 111.71 resistance will confirm completion of the corrective decline from 118.65 (2016 high). Further rise should then be seen to 114.54 and then 118.65 resistance.
Economic Indicators Update
| GMT | Ccy | Events | Actual | Forecast | Previous | Revised |
|---|---|---|---|---|---|---|
| 23:01 | GBP | RICS Housing Price Balance Jul | 79% | 77% | 83% | 82% |
| 23:50 | JPY | PPI Y/Y Jul | 5.60% | 5.10% | 5.00% | |
| 01:00 | AUD | Consumer Inflation Expectations Aug | 3.30% | 3.70% | ||
| 03:00 | NZD | RBNZ Inflation Expectations Q/Q Q3 | 2.27% | 2.05% | ||
| 06:00 | GBP | GDP Q/Q Q2 P | 4.80% | 4.80% | -1.60% | |
| 06:00 | GBP | GDP M/M Jun | 1.00% | 1.00% | 0.80% | |
| 06:00 | GBP | Index of Services 3M/3M Jun | 5.70% | 5.50% | 3.90% | |
| 06:00 | GBP | Industrial Production M/M Jun | -0.70% | 0.30% | 0.80% | |
| 06:00 | GBP | Industrial Production Y/Y Jun | 8.30% | 9.20% | 20.60% | 20.70% |
| 06:00 | GBP | Manufacturing Production M/M Jun | 0.20% | 0.40% | -0.10% | |
| 06:00 | GBP | Manufacturing Production Y/Y Jun | 13.90% | 29.50% | 27.70% | |
| 06:00 | GBP | Goods Trade Balance (GBP) Jun | -12.0B | -10.1B | -8.5B | |
| 09:00 | EUR | Eurozone Industrial Production M/M Jun | -0.30% | -0.30% | -1.00% | -1.10% |
| 12:30 | USD | PPI M/M Jul | 1.00% | 0.60% | 1.00% | |
| 12:30 | USD | PPI Y/Y Jul | 7.80% | 7.40% | 7.30% | |
| 12:30 | USD | PPI Core M/M Jul | 1.00% | 0.60% | 1.00% | |
| 12:30 | USD | PPI Core Y/Y Jul | 6.20% | 5.70% | 5.60% | |
| 12:30 | USD | Initial Jobless Claims (Aug 6) | 375K | 367K | 385K | 387K |
| 13:00 | GBP | NIESR GDP Estimate (3M) Jul | 4.80% | |||
| 14:30 | USD | Natural Gas Storage | 47B | 13B |


