
Yen’s selloff experienced a mild respite during the Asian session, bolstered by a spike in 10-year JGB yield that touched its apex since 2014. However, given the widening yield disparities with both US and European counterparts, the outlook for Yen remains bearish, at least in the foreseeable future. Interestingly, despite US benchmark yields soaring to their highest point in over fifteen years, Dollar hasn’t capitalized on this momentum. A semblance of stabilization in the risk sentiment landscape further keeps both Dollar and Yen on the softer side.
In contrast, Euro and Swiss Franc currently enjoy an edge, showcasing modest gains against the Sterling. Meanwhile, the picture surrounding commodity currencies are ambiguous at best, teetering on the brink of vulnerability. Speculators are keeping a watchful eye on potential bearish news emanating from China, anticipating that any negative headlines could exacerbate the selloff in Aussie and Kiwi.
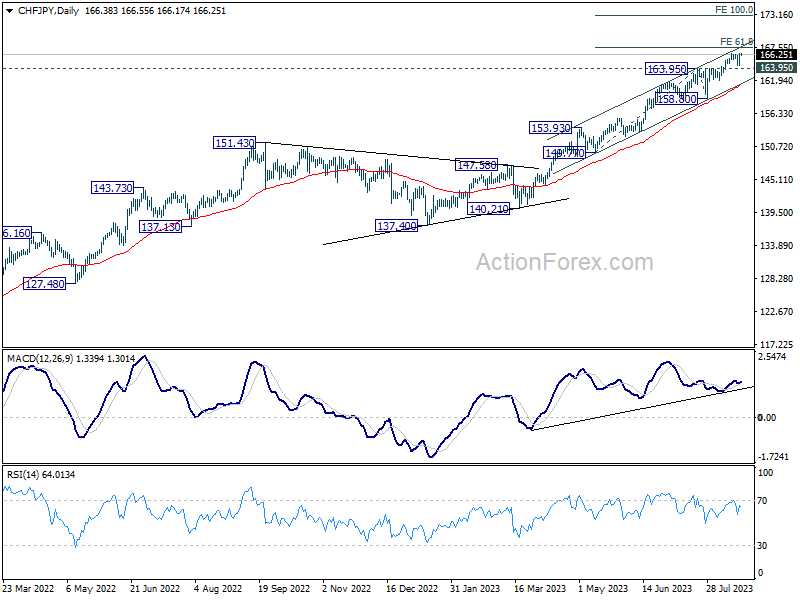
Technically, CHF/JPY’s up trend resumed overnight and edged higher to 166.55. Immediate focus is now on 61.8% projection of 149.77 to 163.95 from 158.80 at 167.56. Rejection by this level, followed by break of 163.95 resistance turned support will likely turn the cross into medium term correction. However, decisive break there could prompt upside acceleration, as accompanied by an upturn in D MACD, and target 100% projection at 172.98. The developments would be a barometers in gauging the Yen’s performance across other market spectrums.
In Asia, at the time of writing, Nikkei is up 0.80%. Hong Kong HSI is down -0.08%. China Shanghai SSE is down -0.39%. Singapore Strait Times is down -0.22%. Japan 10-year JGB yield is up 0.0161 at 0.671. Overnight, DOW dropped -0.11%. S&P 500 rose 0.69%. NASDAQ rose 1.56%. 10-year yield rose 0.091 to 4.342.
US 10-yr yield soars to 15-yr high, real yield breaks 2%
US 10-year Treasury yield ascended to an impressive 4.354%, marking its loftiest level since November 2007, before stabilizing at 4.342%. Notably, 10-year inflation-protected Treasury yield surpassed 2% threshold, the first such occurrence since 2009. This move highlights a significant journey from its year-to-date nadir, which hovered around 1%.
Adding to the mix, the ever-relevant two-year yield grazed 5% mark during the later hours of US session. This ascent falls just short of the highs registered earlier this year in both the previous month and March.
This rise can be attributed to indications of a more robust than anticipated growth across segments of the global economy. Such growth metrics are spurring speculations on central banks’ potential inclination to maintain interest rates on current high levels for an extended duration than previously assumed.
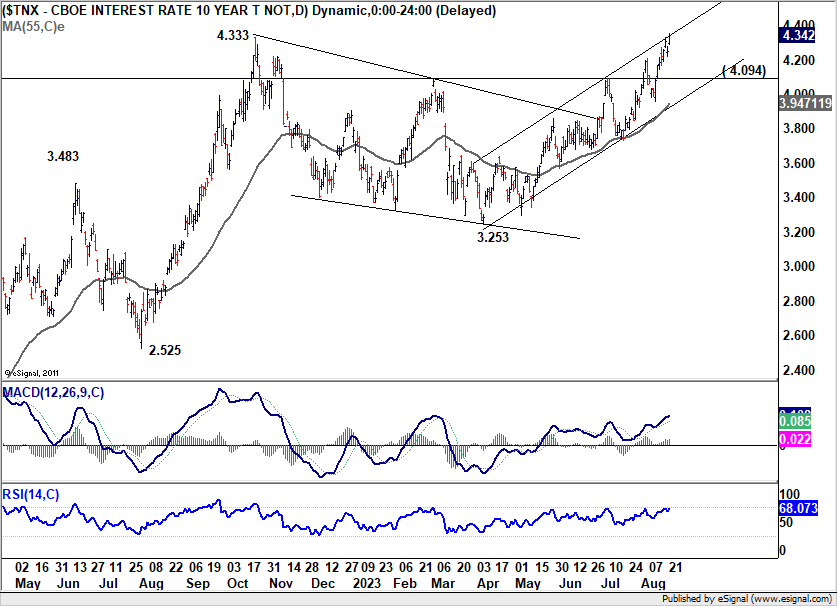
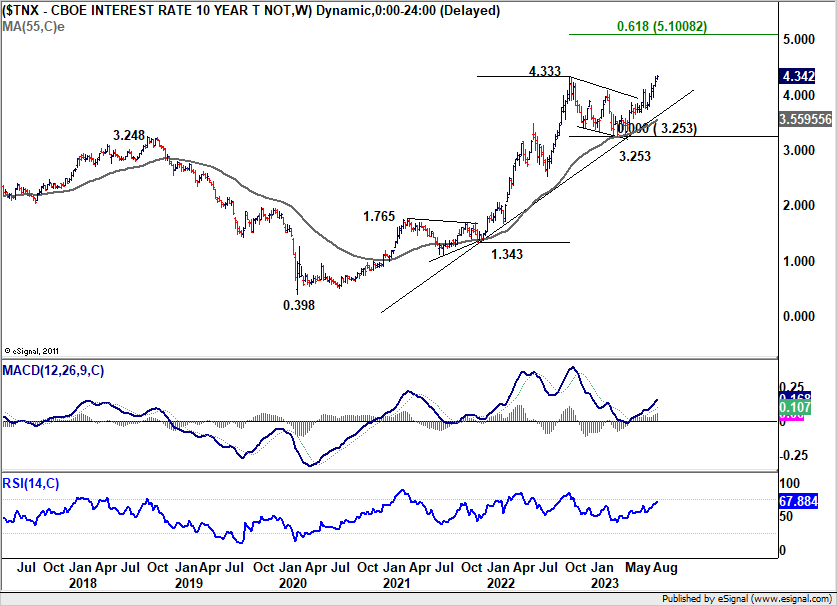
As 10-year yield broke through 4.333 resistance, there are two questions now. Firstly, it’s whether TNX could sustain above this resistance level. Secondly, it’s whether there will be upside acceleration after clearing this resistance decisively. In any case, outlook will stay bullish as long as 4.094 resistance turned support holds. Next medium term target is
61.8% projection of 1.343 to 4.333 from 3.253 at 5.100.
Silver extending rebound, can it take Gold higher?
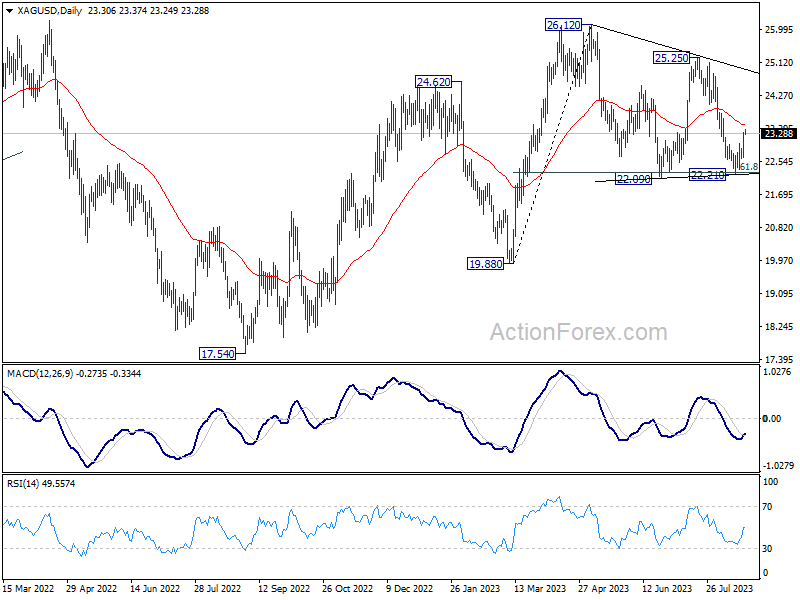
Silver’s rebound from 22.21 extended higher overnight and the development should confirm short term bottoming there. A bullish scenario for Silver is that consolidation from 26.12 has completed with three waves to 22.21, after defending 61.8% retracement of 19.88 to 26.12 at 22.26 twice.
Sustained trading above 55 D EMA (now at 23.50) will bolster the bullish case for silver and bring stronger rise back to trend line resistance (now at 24.92). However, rejection by 55 D EMA will argue that current recovery is merely some short-covering profit taking, and send Silver through 22.09 support at a later stage to extend the fall from 26.12.
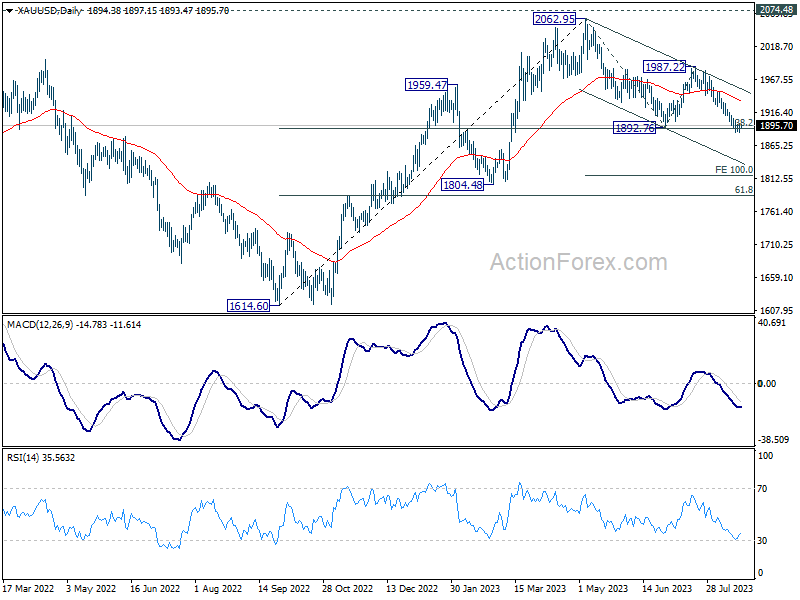
At the same time, Gold is still trying to defend 38.2% retracement of 1614.60 to 2062.95 at 1891.68. A stronger bounce in Silver could be accompanied by similar rebound in Gold back towards 55 D EMA (now at 1933.55). However, if the bearish case in Silver plays out, Gold would likely clear 1891.68 fibonacci support accelerate down to 100% projection of 2062.95 to 1892.76 from 1987.22 at 1817.03.
Looking ahead
Swiss trade balance, UK public sector net borrowing will be released in Euroepan session. Later in the day, US will release existing home sales.
USD/JPY Daily Outlook
Daily Pivots: (S1) 144.92; (P) 145.40; (R1) 145.87; More…
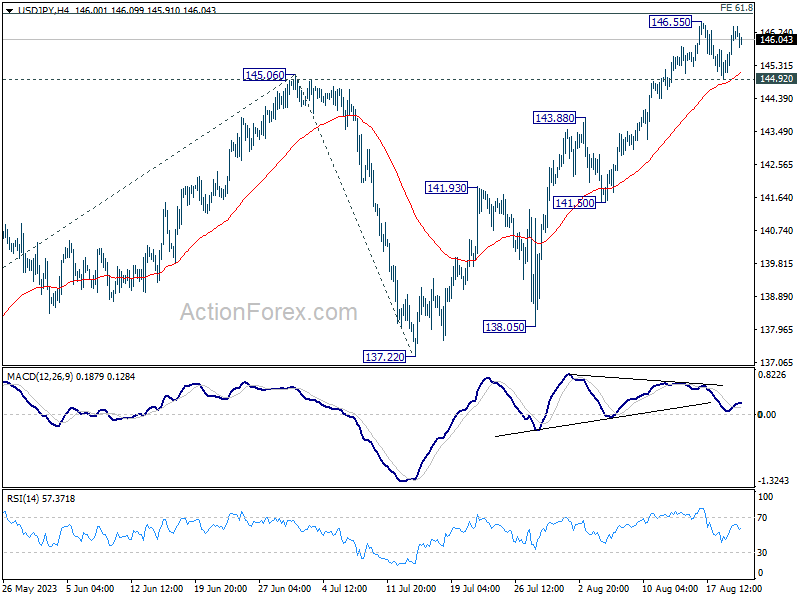
USD/JPY is still bounded in range below 146.55 and intraday bias remains neutral at this point. On the upside, sustained break of 61.8% projection of 129.62 to 145.06 from 137.22 at 146.76 will pave the way to retest 151.93 high. However, considering bearish divergence condition in 4H MACD, firm break of 44.92 support will be a sign of reversal, and turn bias back to the downside for 55 D EMA (now at 141.95).
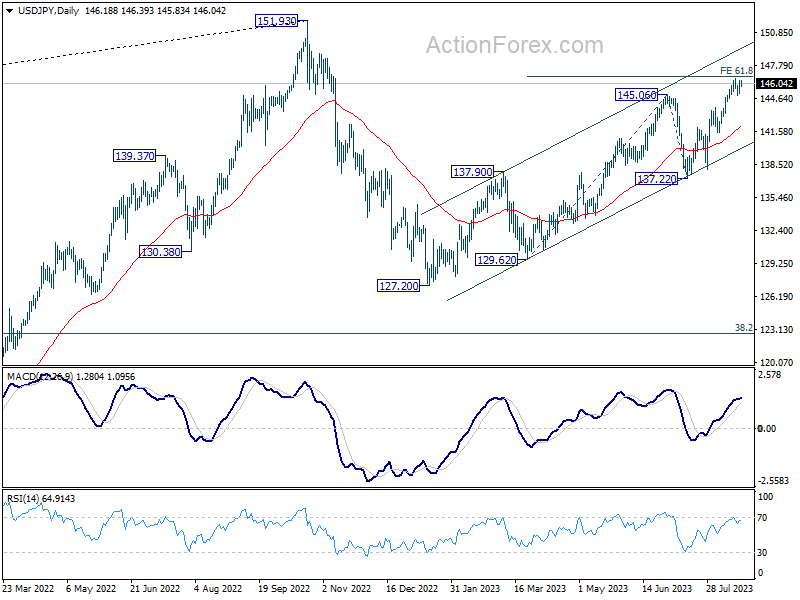
In the bigger picture, overall price actions from 151.93 (2022 high) are views as a corrective pattern. Rise from 127.20 is seen as the second leg of the pattern and could still be in progress. But even in case of extended rise, strong resistance should be seen from 151.93 to limit upside. Meanwhile, break of 137.22 support should confirm the start of the third leg to 127.20 (2023 low) and below.
Economic Indicators Update
| GMT | Ccy | Events | Actual | Forecast | Previous | Revised |
|---|---|---|---|---|---|---|
| 06:00 | CHF | Trade Balance (CHF) Jul | 4.50B | 4.82B | ||
| 06:00 | GBP | Public Sector Net Borrowing (GBP) Jul | 3.4B | 17.7B | ||
| 08:00 | EUR | Eurozone Current Account (EUR) Jun | 10.2B | 9.1B | ||
| 14:00 | USD | Existing Home Sales Jul | 4.15M | 4.16M |


