
The moves triggered by stronger than expected CPI in the US proved to be short lived. DOW opened lower overnight to 24490.36 but quickly reversed. Eventually it ended up 1.03% at 24893.49. S&P 500 and NASDAQ also closed up 1.34% and 1.86% respectively. Dollar initially gained after the release but also reversed quickly. More importantly, it now looks like the greenback is ready to resume it’s broad based down trend. Staying in the currency markets, Yen is trading as the strongest one for the week on revived speculations of stimulus exit. That’s followed by Kiwi and then Euro. The only move that was persistent was the rally in treasury yields with 10 year yield closing up 0.073 to 2.913, resuming recent up trend towards 3.036 key resistance.
The post CPI rally in stocks could be seen as an indication that the crash in the prior weeks were excessive. That is, fear over aggressive Fed tightening was over-priced with DOW fall from 26616.71 historical high to 23360.29. Some analysts said that the worst is already over. We’ll a bit more cautious stance for the moment. DOW will be entering into key near term resistance zone between 55 day EMA (24903) and 61.8% retracement of 26616 to 23360 at 25372. Reactions to this zone is the key to decide whether the correction from 26616.71 is over.
The sharp decline is Dollar index overnight now suggests that recent recovery from 88.43 is already over, limited well below 55 day EMA. The larger medium term down trend is ready to resume to target 61.8% projection of 103.82 to 91.01 from 95.15 at 87.23. This is in line with development in EUR/USD, which defended 1.2222 key support and is heading back to 1.2537 high.
Elsewhere
Japan machine orders dropped -11.9% mom in December. Australia employment grew 16k in January, unemployment rate dropped 0.1% to 5.5%. Australia consumer inflation expectation rose 3.6% in February. Eurozone trade balance is the only feature in European session. Later in the day, US will release regional Fed surveys from Empire state and Philadelphia, PPI, jobless claims, industrial production and NAHB housing index.
EUR/USD Daily Outlook
Daily Pivots: (S1) 1.2328; (P) 1.2397 (R1) 1.2518; More….
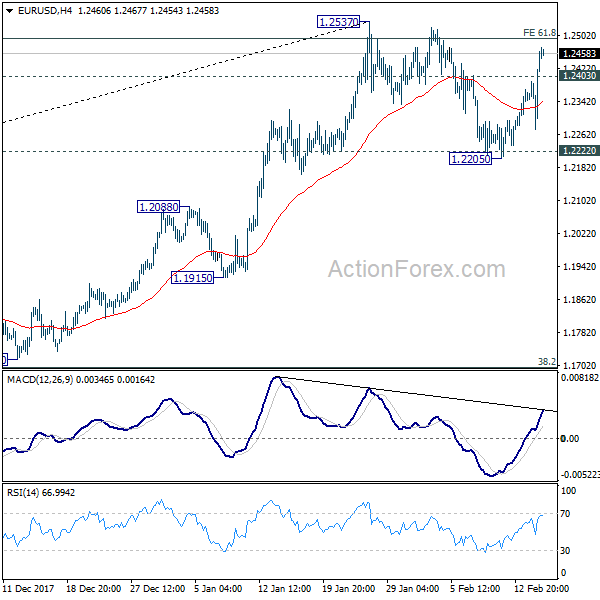
EUR/USD’s strong rebound and break of 1.2403 suggests that pull back from 1.2537 has completed at 1.2205, after drawing support from 1.2222 key support level. Intraday bias is back on the upside for 1.2537 resistance. Decisive break there will resume larger up trend and target 100% projection of 1.0569 to 1.2091 from 1.1553 at 1.3075. In any case, for now, as long as 1.2205 support holds, outlook will remain bullish.
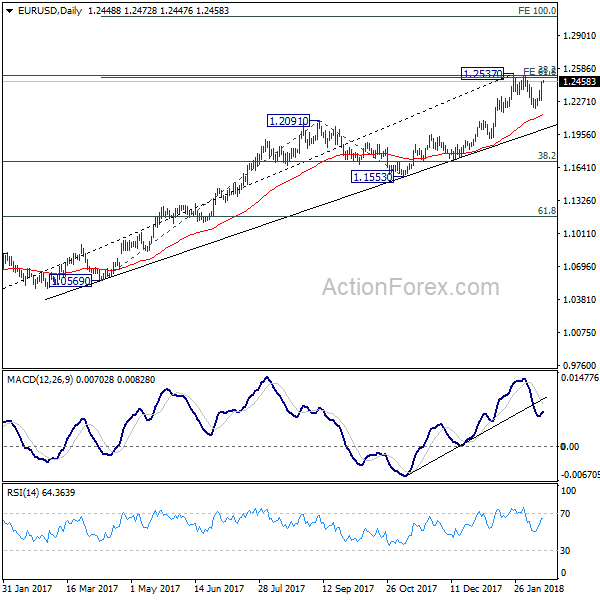
In the bigger picture, key fibonacci level at 38.2% retracement of 1.6039 (2008 high) to 1.0339 (2017 low) at 1.2516 remains intact. Hence, rise from 1.0339 medium term bottom is still seen as a corrective move for the moment. Rejection from 1.2516 will maintain long term bearish outlook and keep the case for retesting 1.0039 alive. However, sustained break of 1.2516 will carry larger bullish implication and target 61.8% retracement of 1.6039 to 1.0339 at 1.3862.
Economic Indicators Update
| GMT | Ccy | Events | Actual | Forecast | Previous | Revised |
|---|---|---|---|---|---|---|
| 23:50 | JPY | Machine Orders M/M Dec | -11.90% | -2.30% | 5.70% | |
| 00:00 | AUD | Consumer Inflation Expectation Feb | 3.60% | 3.70% | ||
| 00:30 | AUD | Employment Change Jan | 16.0K | 15.2K | 34.7K | 33.5K |
| 00:30 | AUD | Unemployment Rate Jan | 5.50% | 5.50% | 5.50% | 5.60% |
| 04:30 | JPY | Industrial Production M/M Dec F | 2.70% | 2.70% | ||
| 10:00 | EUR | Eurozone Trade Balance (EUR) Dec | 22.6B | 22.5B | ||
| 13:30 | USD | Empire State Manufacturing Feb | 18 | 17.7 | ||
| 13:30 | USD | Initial Jobless Claims (10 FEB) | 227k | 221k | ||
| 13:30 | USD | PPI M/M Jan | 0.40% | -0.10% | ||
| 13:30 | USD | PPI Y/Y Jan | 2.50% | 2.60% | ||
| 13:30 | USD | PPI Core M/M Jan | 0.20% | -0.10% | ||
| 13:30 | USD | PPI Core Y/Y Jan | 2.10% | 2.30% | ||
| 13:30 | USD | Philadelphia Fed Business Outlook Feb | 21.6 | 22.2 | ||
| 14:15 | USD | Industrial Production M/M Jan | 0.20% | 0.90% | ||
| 14:15 | USD | Capacity Utilization Jan | 78.00% | 77.90% | ||
| 15:00 | USD | NAHB Housing Market Index Feb | 72 | 72 | ||
| 15:30 | USD | Natural Gas Storage | -119B | |||
| 21:00 | USD | Net Long-term TIC Flows Dec | 50.3B | 57.5B |