
Economic data, Fed expectations, trade war, Brexit were among the biggest themes last week. Emerging market risks seemed to have abated. Meanwhile, Italy was less of a threat to Eurozone after the government pledged not to blow up the account. Yen and Swiss Franc ended the week as the first and third strongest ones as ex-US markets were troubled by risk aversion. Dollar strengthened as usual on Trump’s escalating trade threats to other countries and ended as the second strongest. New Zealand, Australian and Canadian Dollar were the weakest ones naturally, on risk aversion. Sterling ended mixed after suffering much volatility on flip-flopping Brexit headlines.
Markets firming up Fed interest rate pricing after strong week of data
Economic data released from the US were very strong. ISM manufacturing jumped to 61.3 in August, highest since May 2004. ISM non-manufacturing also rebounded to 58.5. Initial jobless claims dropped to 203k, lowest since 1969. Non-farm payroll showed respectable 201k. More importantly, average hourly earnings rose strongly by 0.4% mom.
Comments from Fed officials last week continued to be mixed. But that didn’t change the overall picture in the board. That is, the consensus should be continuing rate hikes to neutral first. What’s beyond that will depend on incoming data and other factors like yield curve.
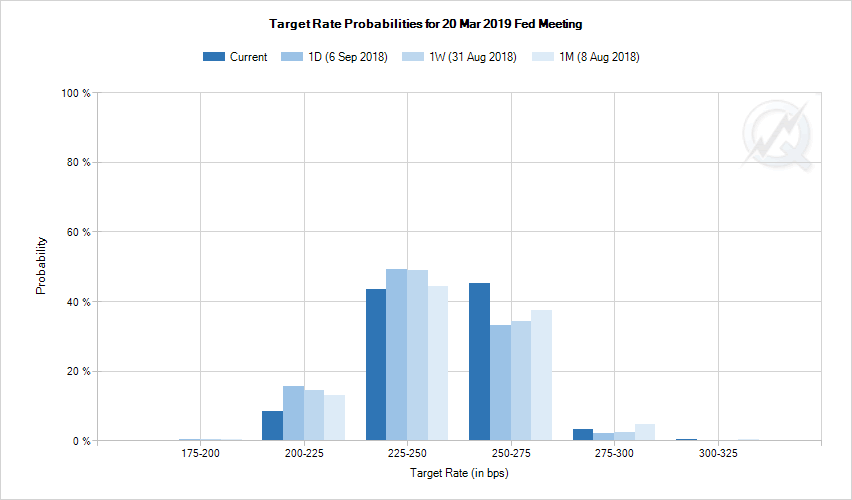
After the strong set of data, markets have firmed up their pricing on Fed’s rate path. By March 2019 FOMC meeting, fed fund futures are now pricing in more than 48% chance of three more 25bps hikes to 2.50-2.75%. While it’s still kept below 50% level, it’s notably higher than 35.2% on Thursday, and 36.6% a week ago.
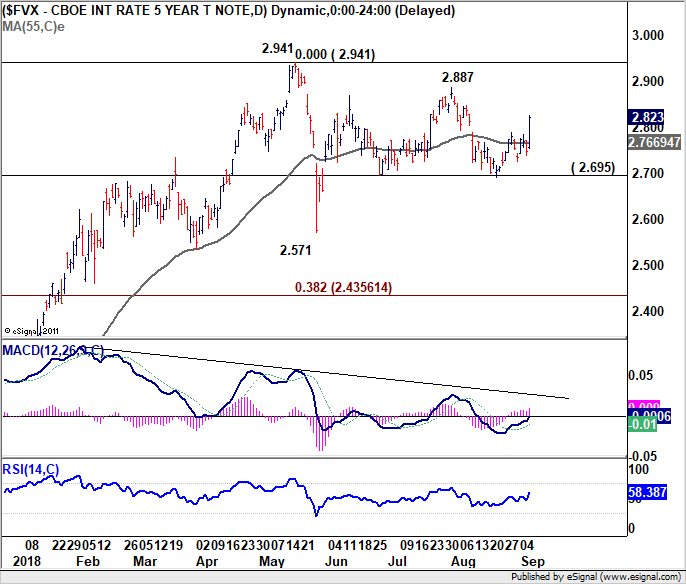
10 year yield finally broke 55 day EMA firmly
Strong NFP also lifted treasury yields clearly, reflecting the expectation on Fed hikes. 10 year yield jumped 0.063 to 2.942 on Friday. More importantly, TNX finally made up its mind to take the flat 55 day EMA decisively. The threat of another immediate fall in TNX diminished largely. And more upside would be seen back towards 2.887/941 resistance zone. The development will limit any downside attempt in USD/JPY and could eventually give it a lift.
Trade tensions to worse, at least till mid-term elections
Trade war remained a dominant theme in the global markets, as stocks were sold off deeply. But it should be noted again that US equities stayed firm all the way despite some brief and shallow setbacks. The threads of trade tensions have now become so tangled that it’s hard to pick a point to start the analysis.
But anyway, let’s start with Canada. Whether it’s still NAFTA or not, the trade negotiation between the US and Canada ended another week without any tangible progress. Dairy, media ownership and Chapter 19 dispute resolution mechanism remained the deadlocks. Trump brought out auto tariffs on Canada again on Friday and warned that “in Canada, the tax on cars would be the ruination of the country.” So, tariffs on Canadian cars are still very much a possibility given Canadian Prime Minister Justin Trudeau’s firm stance on the issues.
Then, if Canada gets auto tariffs, the chance would be increased for EU too, if the latter doesn’t concede further. Just a week ago, Trump rejected EU’s offer to lower auto tariffs to zero, ignoring the “ceasefire agreement”. Additionally, Trump leaked his plan to a WSJ journalist that Japan is the next trade target. The US-Japan negotiation have started, and Trump could fire a shot at Japan after concluding or abandoning talks with Canada.
Then there is China, the public hearing on 25% tariffs on USD 200B in Chinese products ended last week. Trump is ready to start imposing them any time and China is prepared for retaliation. On Friday, Trump bluffed again and said there’s another USD 267B in products ready to be tariffed on short notice and he warned “that totally changes the equation”. That’s the piece of news that triggered the strong rally in Dollar and selloff in commodity currencies on Friday.
However, it should be noted that from China’s August trade data, Trump’s ransom way of negotiation and trade policy failed again. China increased imports from other regions in August like EU (10.6% yoy) and AU (34.0% yoy). Import from US slowed drastically to 2.7% yoy. On the other hand, exports to the US still grew steadily at 13.2% yoy comparing to EU (8.3% yoy) and AU (23.3% yoy). In the end, trade surplus with the US grew 18.4% yoy. And, trade surplus with EU just rose 4.0% yoy. Trade deficit with AU has indeed jumped 45.7% yoy. More details found in this quick note.
Anyway, there are, almost certainly, more developments and escalations ahead of mid-term election in November. The question is, whether Canada, EU, Japan and China will wait out Trump. Or like Mexico, some would concede.
US stock markets shrug unaffected by trade war, but global stocks tumbled
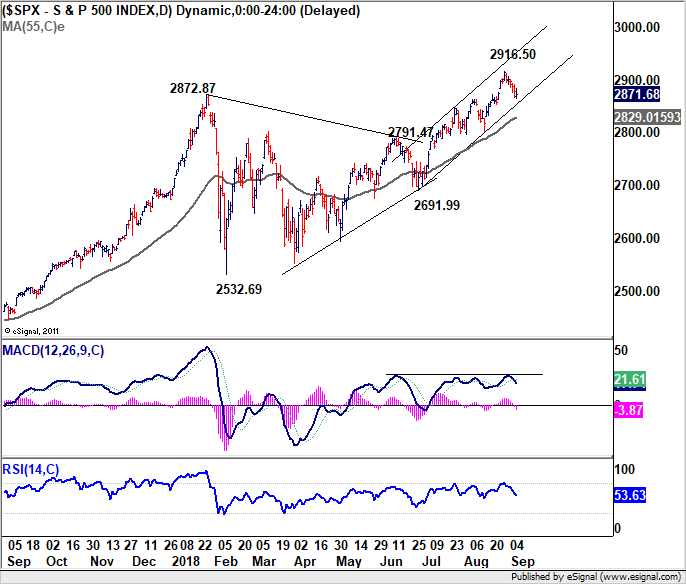
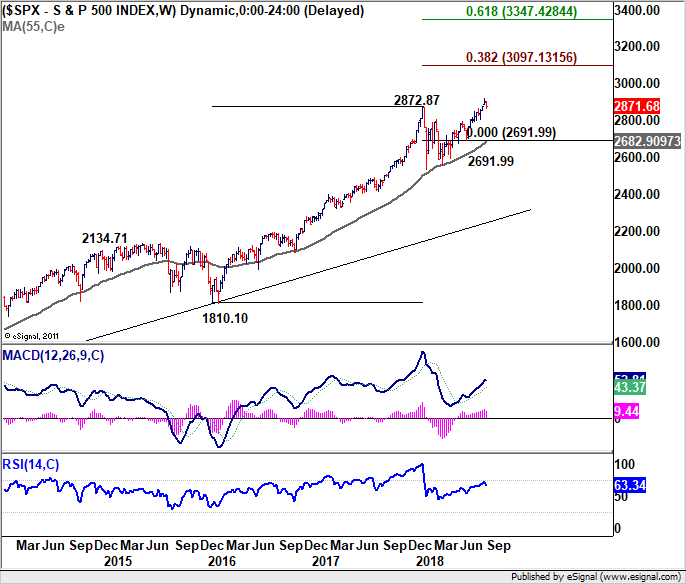
We’d like to emphasize again that when we talk about risk aversion, we’re clearly it refers to ex-US global markets. S&P 500 retreated after hitting 2916.50 record high. But it’s kept inside near term rising channel, well above rising 55 day EMA (now at 2829.01). The pull back also looks corrective so far. There is no indicate of trend reversal. SPX remains on track to extend the record run towards 3000 psychological level.
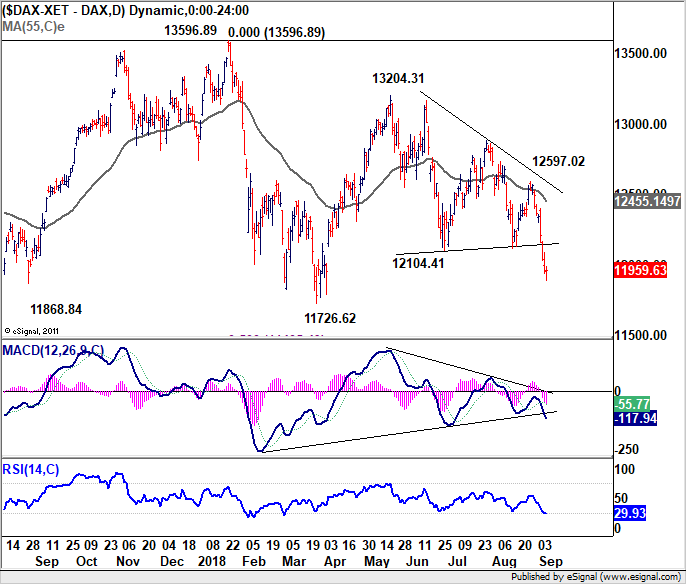
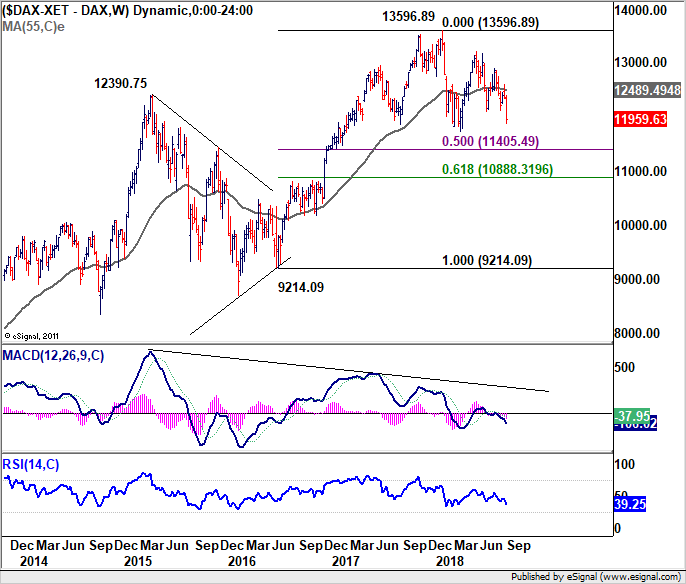
On the other hand, DAX suffered steep selloff and broke 12104.41 support last week to close at 11959.63. The rejections by 55 day and 55 week EMA were rather bearish. We’re viewing price actions from 13596.89 as a corrective pattern. Deeper fall would now be seen to 11726.62. There is prospect breaking 50% retracement of 9214.09 to 13596.89 at 11405.49 before bottoming.
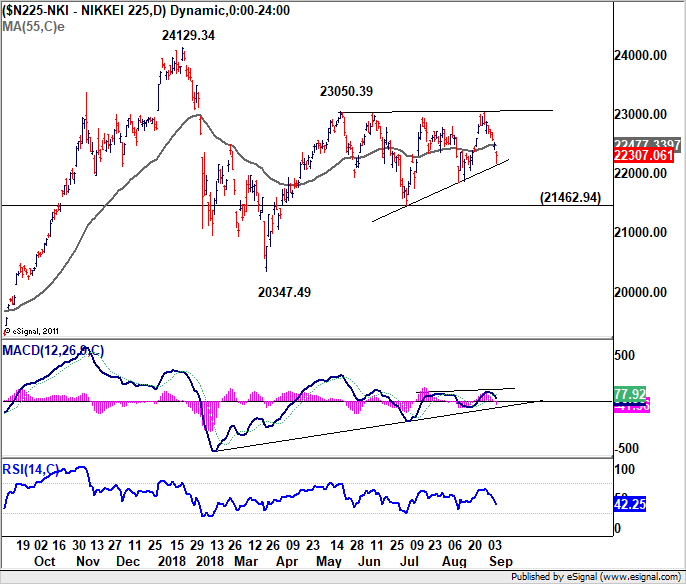
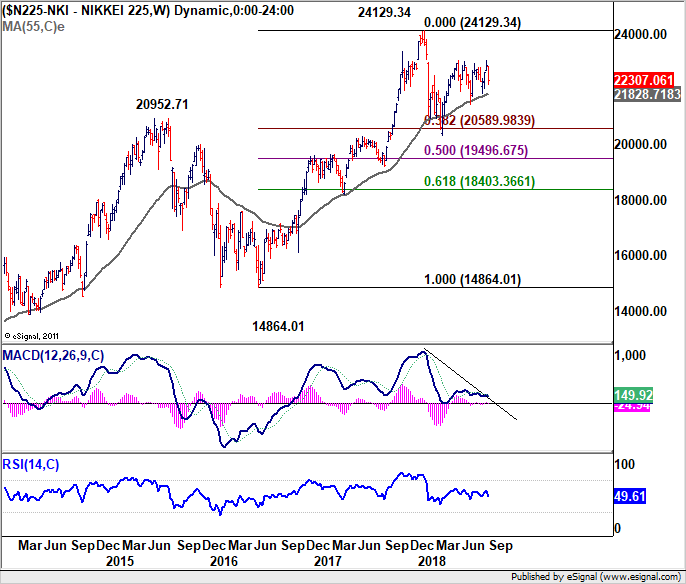
Nikkei was once again rejected by 23050.39 key near term resistance. The late selloff was triggered by news that Japan is Trump’s next trade target. Immediate focus is on near term trend line (now at 22135). Break there will open up more downside to 21462.94 key support level. Break of this will confirm completion of the rebound from 20347.49. That is, the correction from 24129.34 is going to extend with another leg, possibly through 20000 handle to 50% retracement of 14864.01 to 24129.34 at 19496.67.
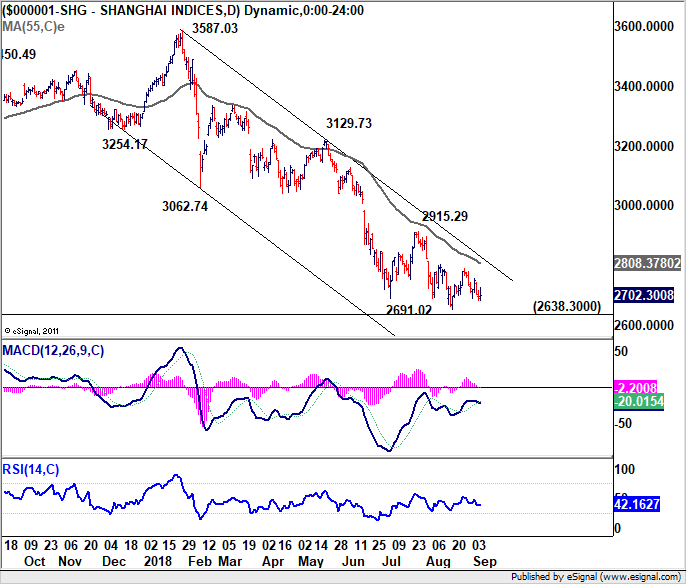
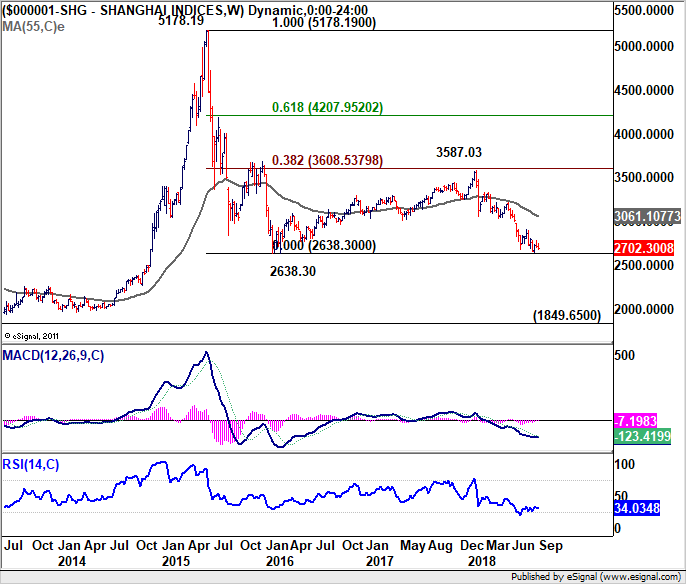
China Shanghai SEE continued to stay in range above 2638.30 key support (2016 low). But things are looking bad as the rebounds got weaker and weaker. It’s just a matter of time when 2638.30 is taken out firmly. But it’s hard to say where the index will fall too given China’s history of intervention and market manipulation. The “national team” might finally comes in when SSE hits 2500 handle.
Considering the above analysis, there’s a high chance that Yen, Swiss Franc and Dollar will firm up against others ahead. And commodity currencies, as well as Euro will continue to suffer.
Position trading strategies
On position trading strategies, we’ve entered short in AUD/JPY last week at 80.25 as noted planned in the week report. As AUD/JPY declined, we lowered the stop to breakeven at 80.25 here. Now, the development was as we expected. 61.8% retracement of 72.39 to 90.29 at 79.22 was taken out quite decisively. Yet, it’s not deep even enough to warrant lowering of stop yet. So we’ll keep the stop at 80.25.
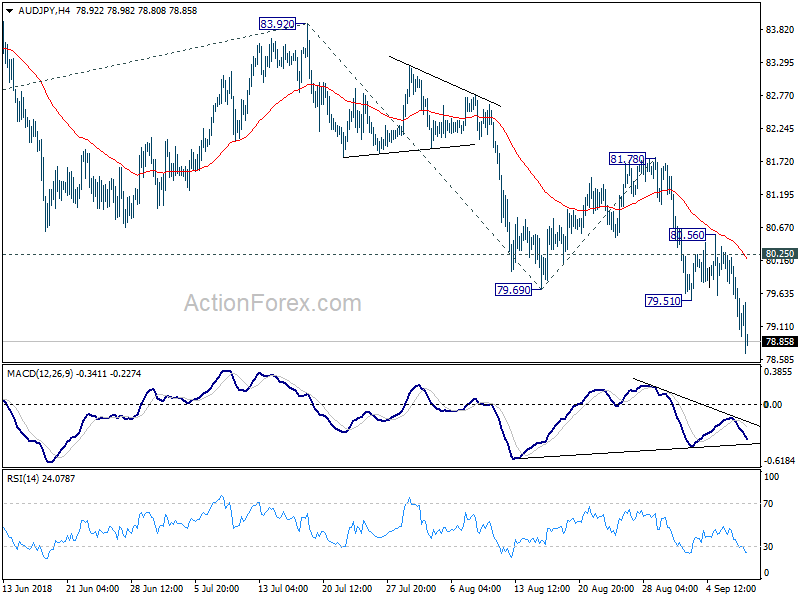
AUD/JPY should now head to 77.55/85 (61.8% projection of 90.29 to 80.48 from 83.92 at 77.85, 100% projection of 83.92 to 79.69 from 81.78 at 77.55). We do not plan to exit there yet, as we would like to monitor and assess the downside momentum first.
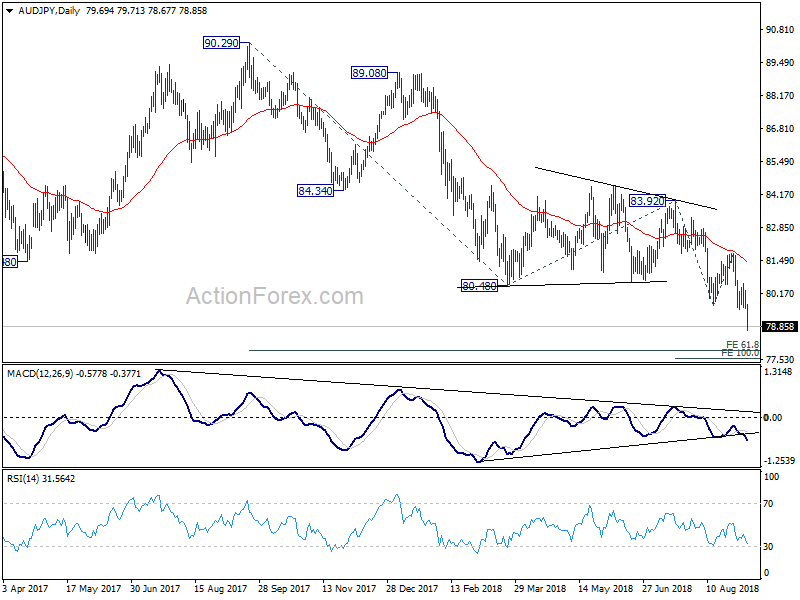
As noted before, the rejection from falling 55 week EMA was rather bearish in medium term. The whole up trend from 72.39 (2016 low) should have completed at 90.29 (2017 high). We’re now looking at the prospect of deeper fall to 100% projection of 90.29 to 80.48 from 83.92 at 74.11, or further to 72.39 low. We’ll make a call on where to exit later.
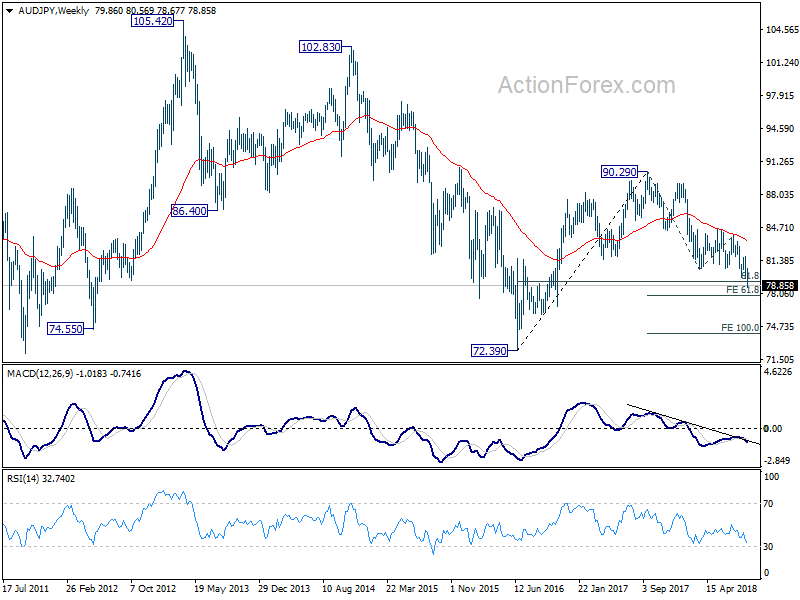
So to summarize, we’ll hold AUD/JPY short, with stop at 80.25. No target yet, potentially between 74.11 and 72.39.
As for new strategy, Dollar, Yen and Swiss Franc are the three to consider buying. We have AUD/JPY already, therefore, we’d avoid both Aussie and Yen. Swiss franc has indeed led the way higher long ago so we’d prefer not to jump in again now. That left Dollar for our consideration. Euro, Sterling and Canadian Dollar are the candidates.
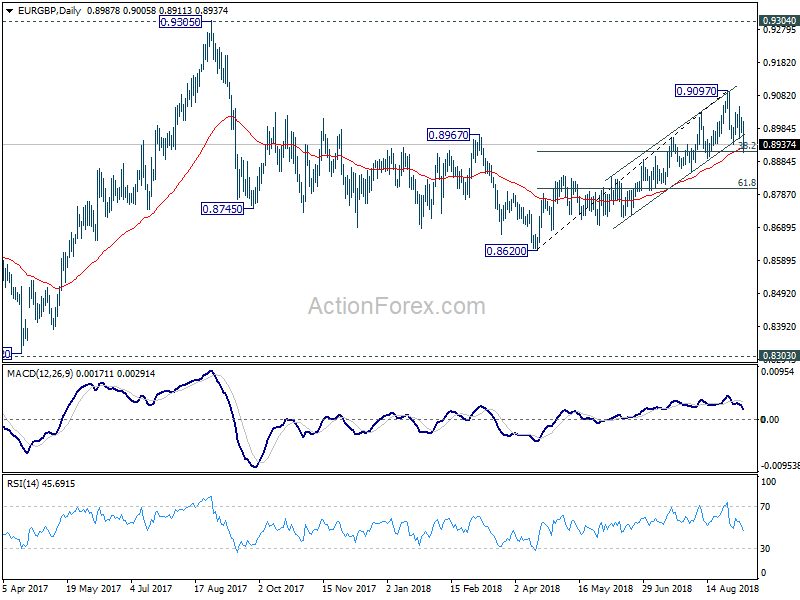
As mentioned in our technical report, EUR/GBP’s sharp fall last week took out near term channel support and 0.8937 support. The development indicates that a short term top was formed at 0.9097. And, more importantly, the choppy structure from 0.8620 to 0.9097 argues that it’s a corrective move that might be completed. Break of 38.2% retracement of 0.8620 to 0.9097 at 0.8915 will affirm our bearish view and target 61.8% retracement at 0.8802 and below. Hence, Euro is a better one to sell than Sterling.
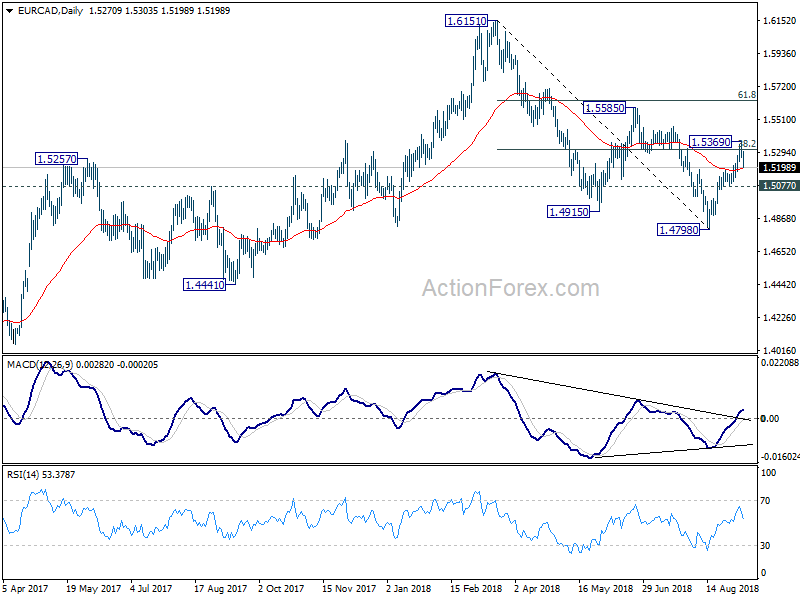
Looking at EUR/CAD, the cross should have bottomed in medium term at 1.4798 on bullish convergence condition in daily MACD. But strong resistance was seen from 38.2% retracement of 1.6151 to 1.4798 at 1.5315. EUR/CAD retreated sharply after hitting 1.5369. The development should now set the range for near term consolidation between 1.5077 support and 1.5369. Further rise in in favor in the cross, but that will come after the consolidation completes. That is, for the near term, it may not make much difference selling Euro or Canadian. However, as BoC is on course for more rate hike, and there could suddenly be a breakthrough in NAFTA talks. So, in that sense, Euro is preferred.
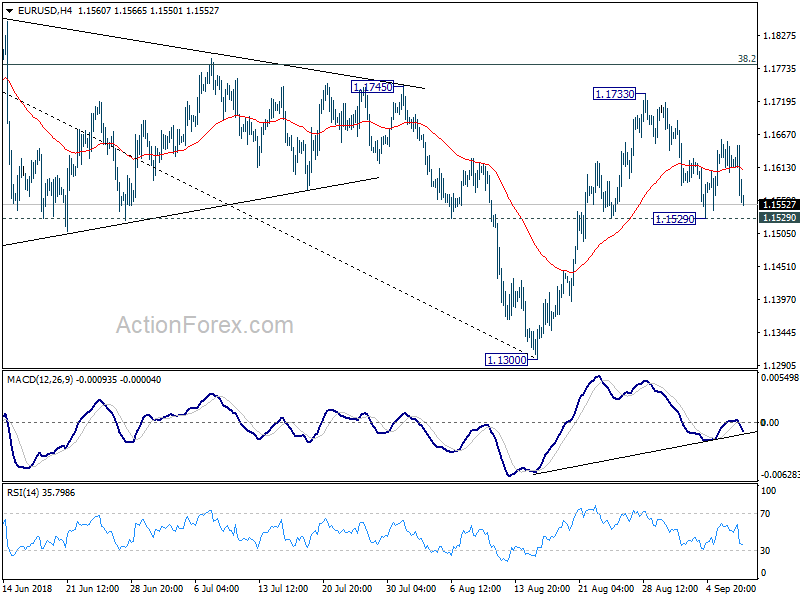
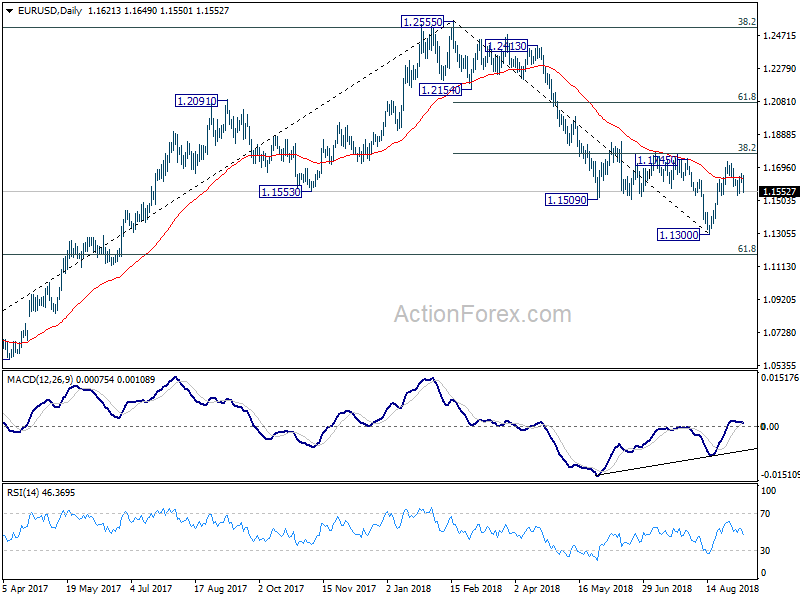
Now, EUR/USD. Our view is unchanged that price actions from 1.1300 are merely a corrective pattern. And in case of another rise, upside should be limited by 38.2% retracement of 1.2555 to 1.1300 at 1.1779 to bring near term reversal. However, it should be noted that 1.1300 is seen as a medium term bottom. Therefore, we don’t expect a break of 1.1300 on the next fall. Instead, there could be one more rebound to make it a medium term three wave consolidation pattern. Hence, if we sell on break of 1.1529, and put at stop at 1.1660, even if EUR/USD can hit 1.1300, risk/reward is lower than 1:2. Not justified. So, we’ll give it a pass first but keep monitoring. There’s a chance of selling EUR/USD if it recovers towards 1.1733 with weak momentum. Then, we can enter at a better price. Let’s see.
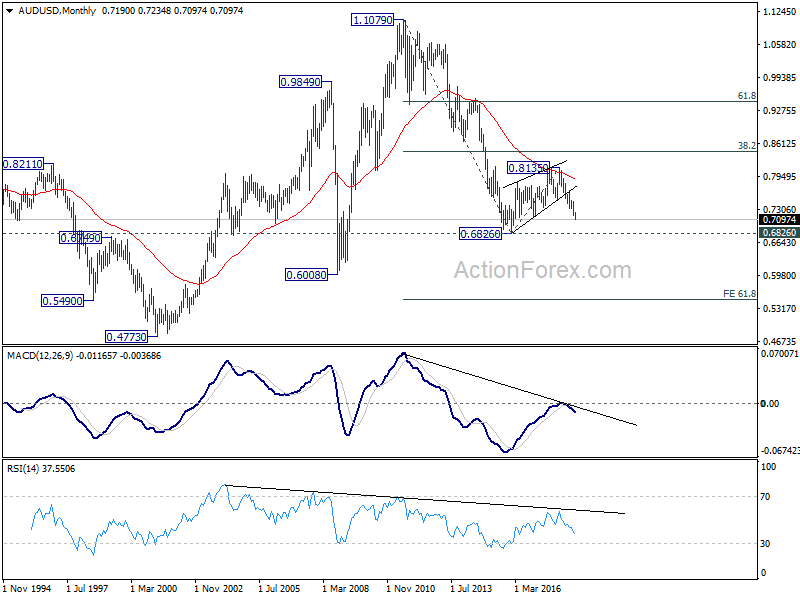
AUD/USD Weekly Outlook
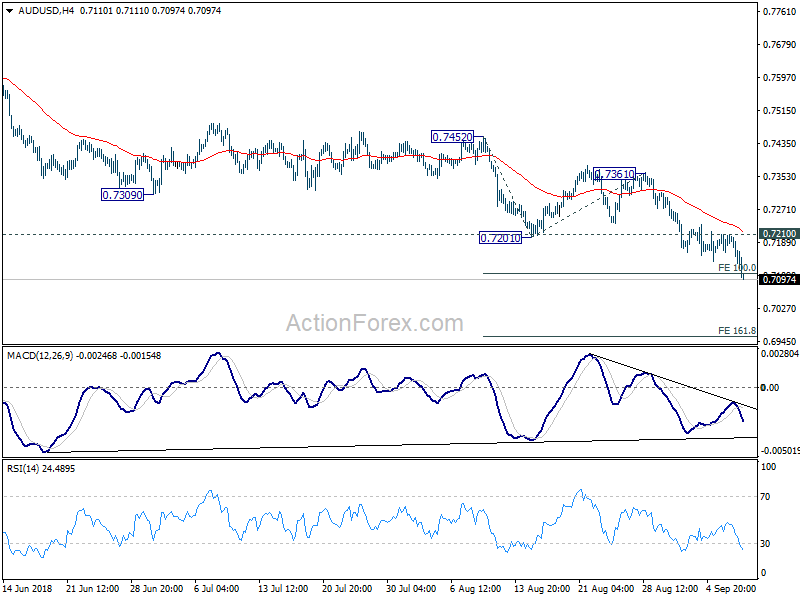
AUD/USD’s down trend extended last week to as low as 0.7097. 100% projection of 0.7452 to 0.7201 from 0.7361 at 0.7110 was already met and there is no sign of bottoming. Initial bias remains on the downside this week for 161.8% projection at 0.6955. Break will target key support level at 0.6826. On the upside, break of 0.7210 resistance is needed to indicate short term bottoming. Otherwise, outlook will stay bearish in case of recovery.
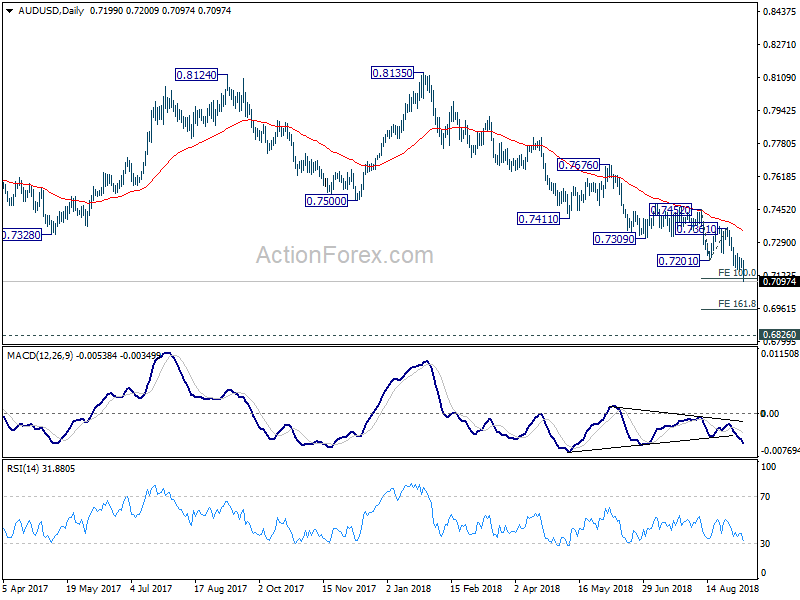
In the bigger picture, rebound from 0.6826 (2016 low) is seen as a corrective move that should be completed at 0.8135. Fall from there would extend to have a test on 0.6826. There is prospect of resuming long term down trend from 1.1079 (2011 high). Current downside momentum as seen in daily and weekly MACD support this bearish case. Firm break of 0.6826 will target 0.6008 key support next (2008 low). On the upside, break of 0.7361 resistance is needed to be the first sign of medium term bottoming. Otherwise, outlook will remain bearish even in case of strong rebound.
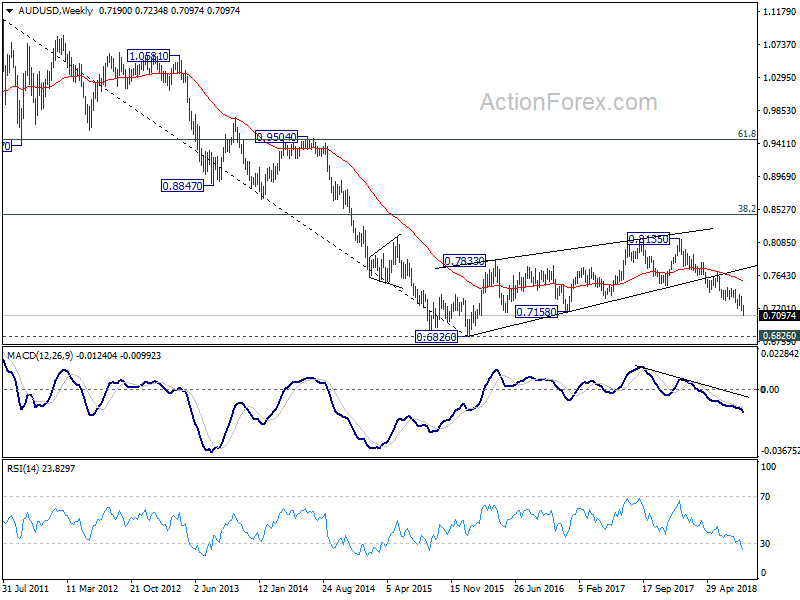
In the longer term picture, the corrective structure of rebound from 0.6826 (2016 low) to 0.8135, and the failure to break 38.2% retracement of 1.1079 (2011 high) to 0.6826 at 0.8451, carry bearish implications. AUD/USD was also rejected by 55 month EMA. Now, the down trend from 1.1079 is in favor to extend. On break of 0.6826, next target will be 61.8% projection of 1.1079 to 0.6826 from 0.8135 at 0.5507.


