
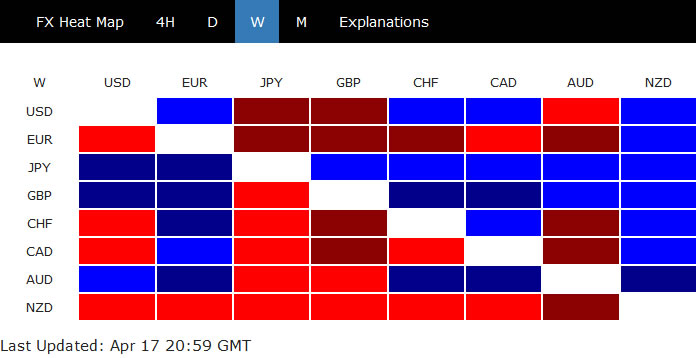
Global stock markets were some what supported by talks of staged exit of coronavirus lockdown. There was optimism that finally a cure for the virus too. Nevertheless, the extended rebound in stocks were not much reflected in the currency markets. Yen ended the week as the strongest one, followed by Sterling. New Zealand Dollar was the weakest, followed by Euro. Dollar was just mixed.
It should be reminded that the crash in March was driven by both the coronavirus pandemic and oil price war. It’s clear that traders didn’t buy into that OPEC++ deal on production cut as we saw WTI crude oil future dropped through 20 handle. It could be hard for stock markets to extend recent rally if there is no sustainable rebound in oil prices. If risk aversion does come back, as we argued below, we’d favor selling Kiwi. On the other hand, oil driven risk rally would favor Canadian Dollar over other commodity currencies.
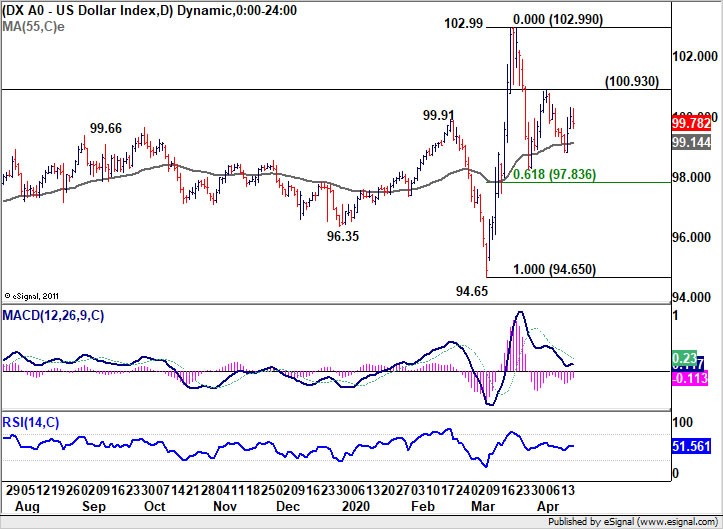
Dollar index range bound despite extended risk rally
Dollar’s performance in a week of risk appetite wasn’t too bad. Dollar index drew support form 55 day EMA and recovered. But there was no follow through buying to push it through 100.93 near term resistance. Corrective pattern from 102.99 might extend further, with risk of another fall to 61.8% retracement of 94.65 to 102.99 at 97.83 before completion. Nevertheless, break of 100.93 will target a test on 102.99 high. That might come when risk rebound tops.
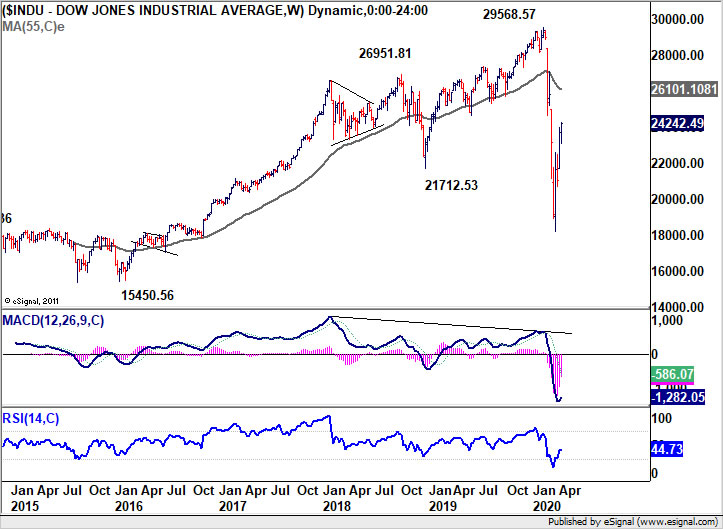
DOW extended rebound, entering into key resistance zone
DOW’s corrective rebound from 18213.65 extended higher last week and closed strongly at 24242.49. The strength of the rebound suggests that it’s the second leg of the corrective pattern that started at 29568.57 high. That is, at least one more down leg in the scale of the fall from 29568.57 to 18213.65 is expected before the pattern finally completes. The eventual depth of the correction will depend very much depends on the extent of the current rebound, which is rather hard to predict.
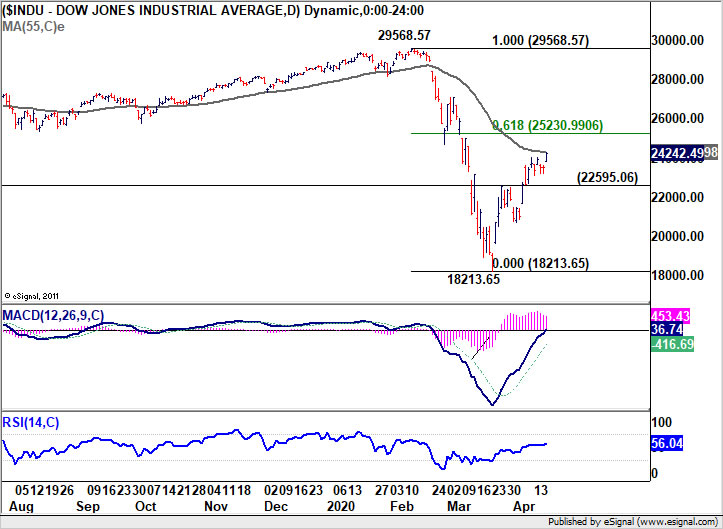
Nevertheless, DOW should enter into a “topping” zone with the next rise, between 55 day EMA (now at 24286.88) and 55 week EMA (now at 26101.10). 61.8% retracement of 29568.57 to 18213.65 at 25230.99 sitting in between. We’ll continue to look for reversal signal and break of 22595.06 resistance turned support should start the third leg to 18213.65 and below.
A look at AUD, NZD and CAD for the next move
A look at commodity currencies crosses suggest that AUD/NZD has defended parity well. Meanwhile, upside potential in AUD/CAD is relatively limited. Hence, in case of return of risk aversion, Kiwi would be the preferred choice to sell. Meanwhile, Canadian Dollar could have an overwhelming upper hand on Aussie should risk rally extends, particularly if it’s driven by rebound in oil prices.
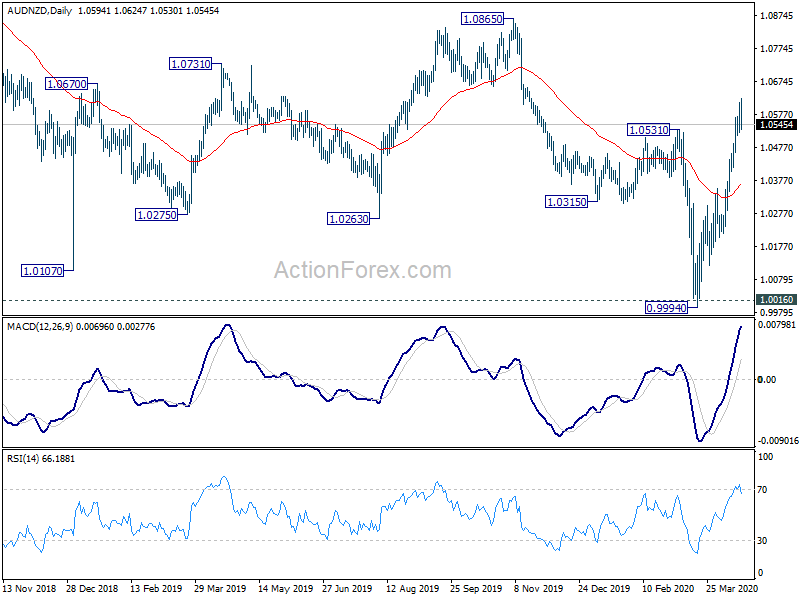
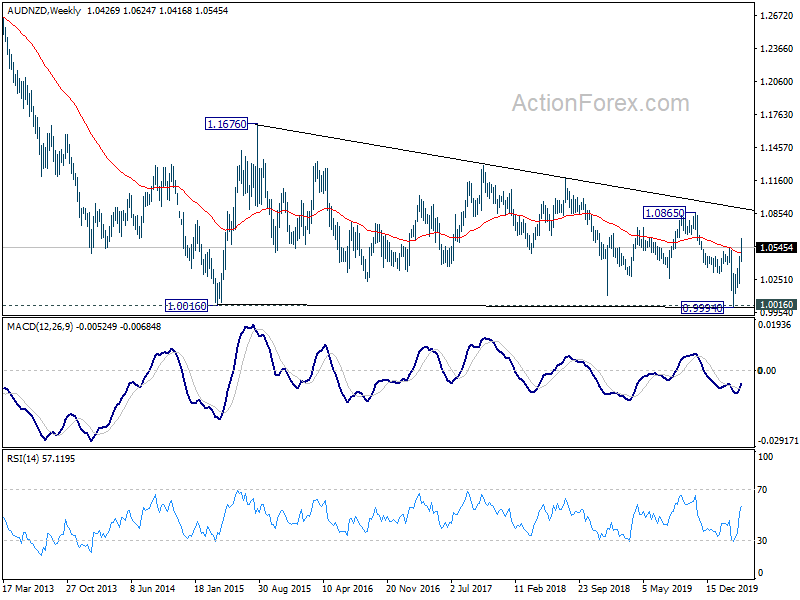
AUD/NZD’s break of 1.0531 resistance, as well as 55 week EMA, suggests that fall from 1.0865 has completed at 0.9994 already. Tentatively, 1.0016 low and parity should have been defended. The risk more steep broad-based selloff in Aussie is eased for now. Further rise is in favor to 1.0865 resistance. Major test lies in trend line resistance (now at 1.0906). There is some room for Aussie to outperform Kiwi even in case of risk aversion.
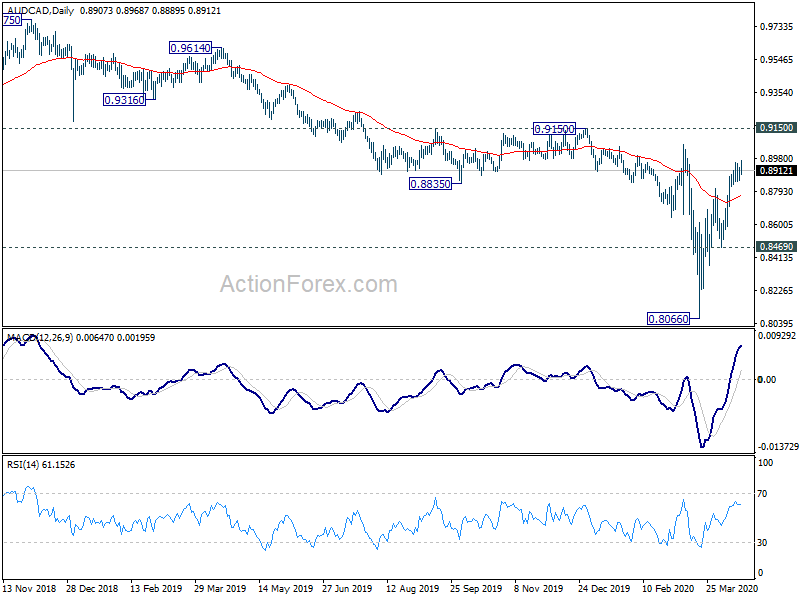
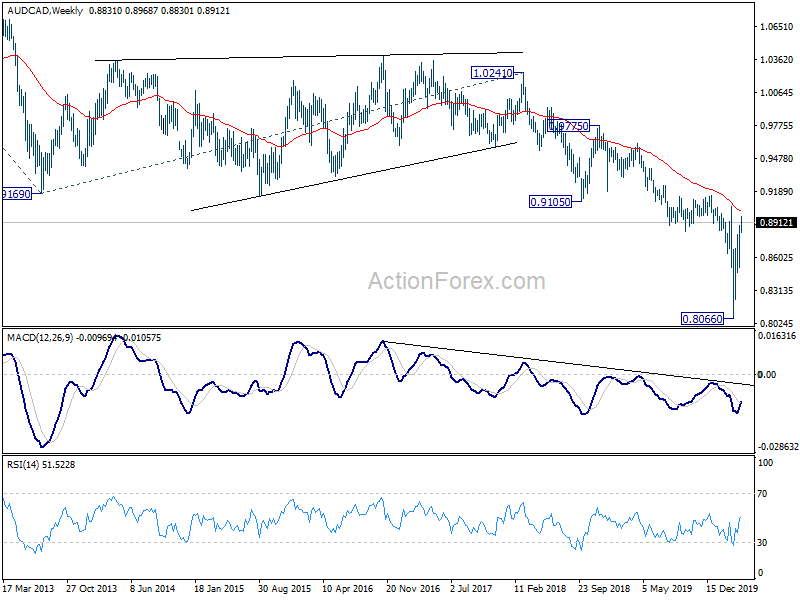
AUD/CAD’s corrective rebound from 0.8066 spike low extended higher last week and there is no clear sign of topping yet. The sustained trading above 55 day EMA is a positive sign. Yet, the cross will be facing key resistance zone between 55 week EMA, as well as 0.9150. Hence, upside potential for the next rise should be limited for the near term. Instead, a break below 55 day EMA could sign the completion of the rebound, and bring deeper fall to 0.8496 support for confirmation.
EUR/JPY Weekly Outlook
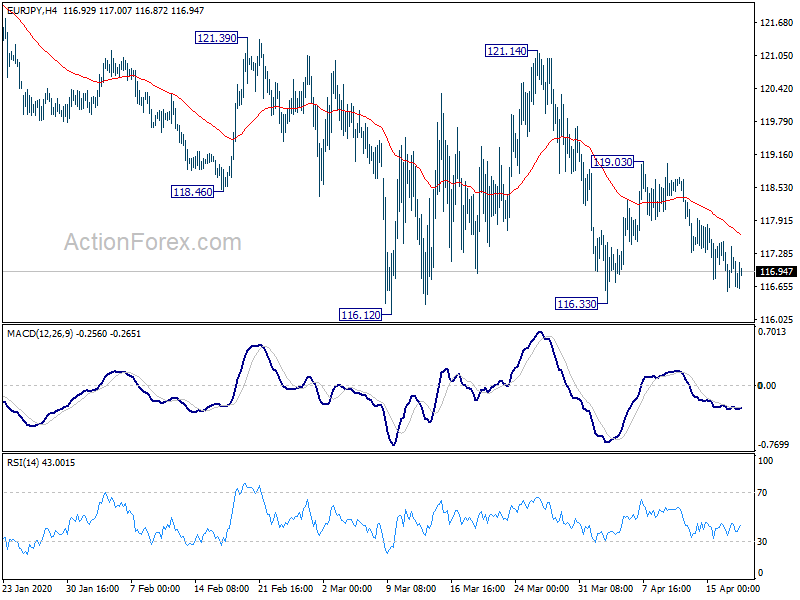
EUR/JPY gyrated lower last week with weak downside momentum. Initial bias stays mildly on the downside this week for 115.86/116.12 support zone. Decisive break there will confirm larger down trend resumption. On the upside, break of 119.03 will extend recent consolidation from 115.86 with another rise leg.
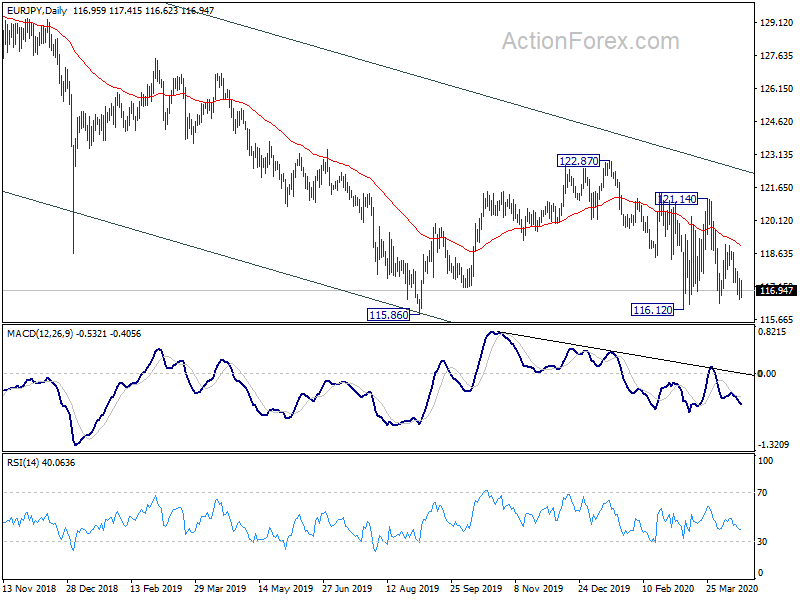
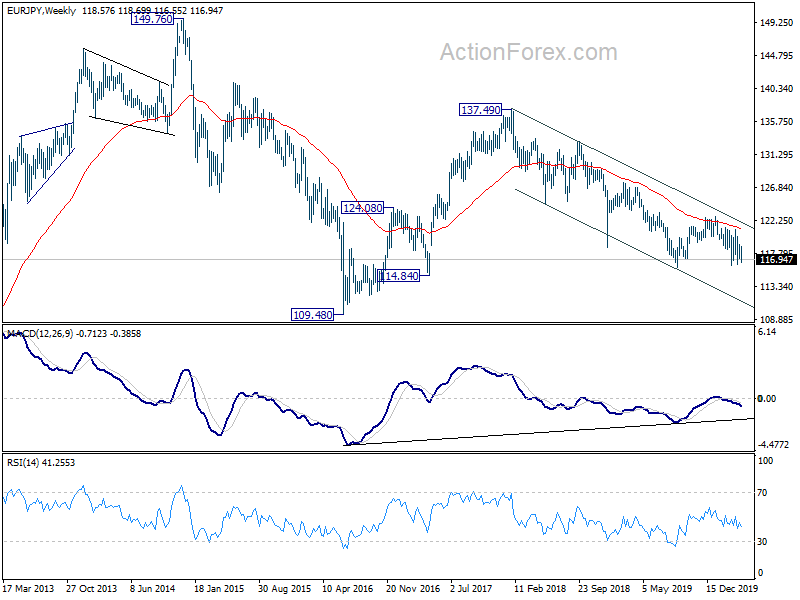
In the bigger picture, outlook remains bearish as the cross is staying well inside falling channel established since 137.49 (2018 high), as well as below falling 55 week EMA. As long as 122.87 resistance holds, the down trend form 137.49 should extend to 109.48 (2016 low). However, sustained break of 122.87 will indicate medium term bullish reversal.
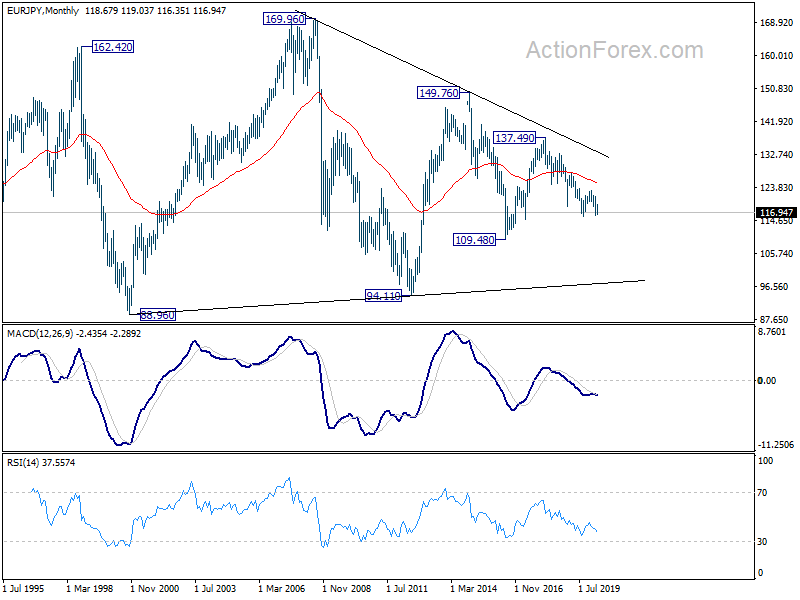
In the long term picture, EUR/JPY is staying in long term sideway pattern, established since 2000. Fall from 137.49 is seen as a falling leg inside the pattern. This falling leg would target 109.48 (2016 low). With EUR/JPY staying below 55 month EMA (now at 124.84), this is the preferred case.


