
Markets experienced a roller-coaster ride in the first week of September. S&P 500 and NASDAQ extended record runs and it looked like DOW was on the way for a catch-up. Then technology stocks led a steep selloff towards the end of the week and pulled all indices sharply lower. Nevertheless, late recovery on Friday gave investors some hope that up trend was not in much risk yet.
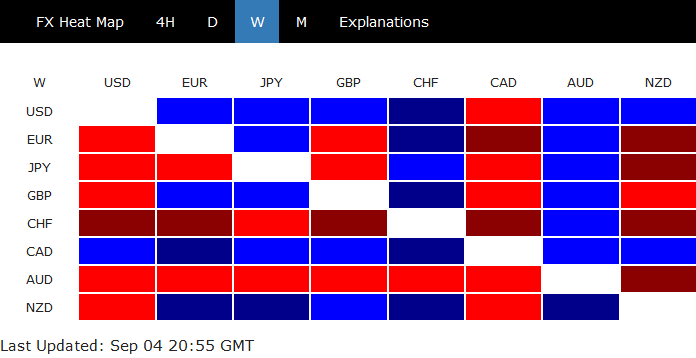
Dollar ended as the second strongest, outshone by Canadian, followed by New Zealand Dollar. On the other hand, Australian Dollar was the worst performing one, followed by Swiss Franc and then Yen. The greenback’s rebound was some what disappointing as no key resistance level was taken out. The Loonie was indeed very impressive considering the decline in oil price. We’ll probably know soon if the wild moves were just jitters, or the tides are turning.
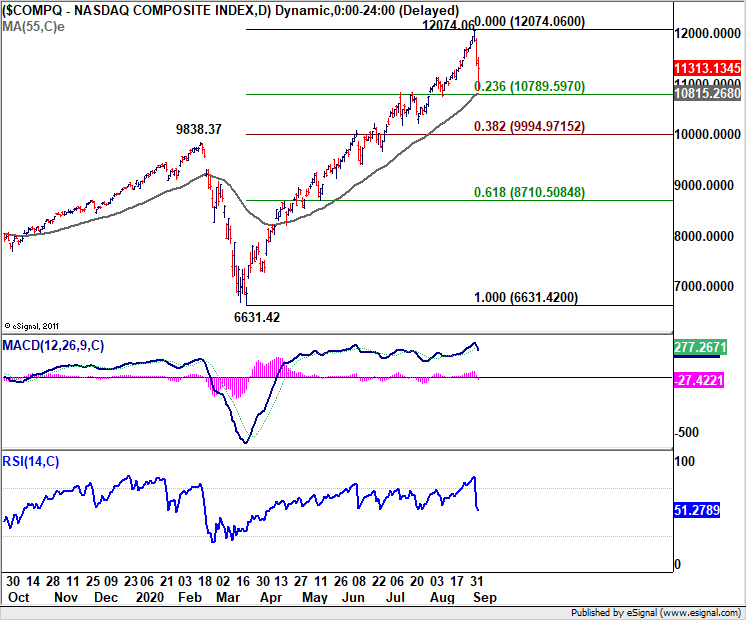
NASDAQ and S&P 500 seen as in short term, sideway consolidations for now
NASDAQ suffered a steep two day pull back after hitting record high at 12074.06. But Friday’s late rebound argues that it’s more likely a near term sideway consolidation rather than a deep medium term pull correction. We’d hold on to this view as long as 23.6% retracement of 6631.42 to 12074.06 at 10789.59 holds. However, firm break of 10789.59 will likely bring deeper pull back to 38.2% retracement at 9994.97, which is close to 10000 handle. The corrective pattern will also take much longer to complete.
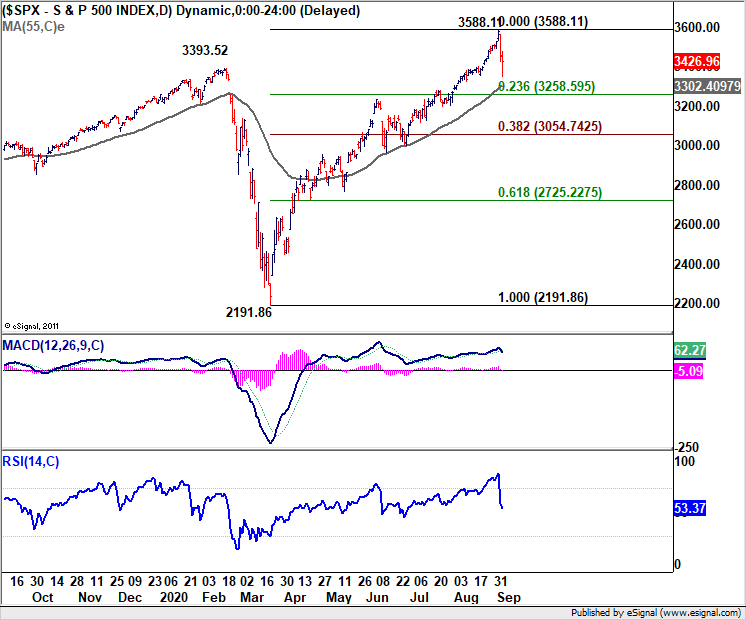
Similar picture is seen in S&P 500. As long as 23.6% retracement of 2191.86 to 3588.11 at 3258.59 holds, we’d treat current price actions as a short term sideway consolidation only. Another high would be seen sooner rather than later. However, firm break of 3258.59 will suggest that deeper and longer correction is underway to 38.2% retracement at 3054.74, and possibly to 3000 handle.
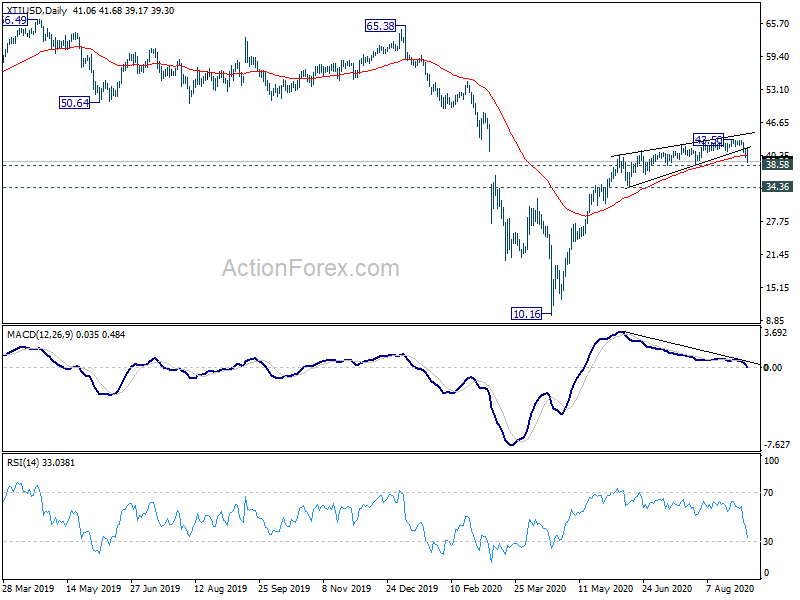
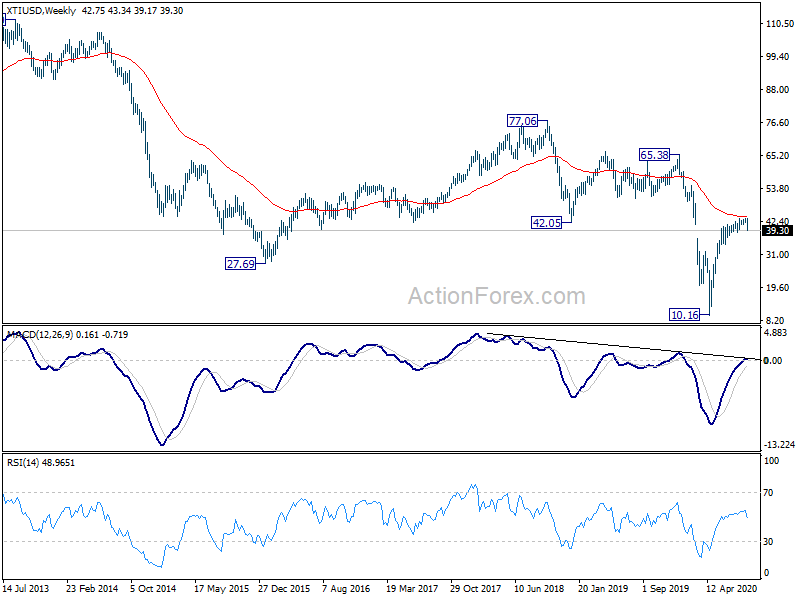
WTI could be in deep correction after rejection by 55 week EMA
The above view on US indices is not without risk. In particular, WTI crude oil looks gathering momentum for a deep pull back, considering that it’s rejected by 55 week EMA. This is supported by steep bearish divergence condition in daily MACD too. Focus will immediately be on 38.58 support in the coming days. Strong rebound from this level will keep price actions from 43.50 as a shallow sideway consolidation. Firm break of 38.58, however, should bring deeper correction to 34.36 support before finding a bottoming. In that case, the above stock indices could be dragged down.
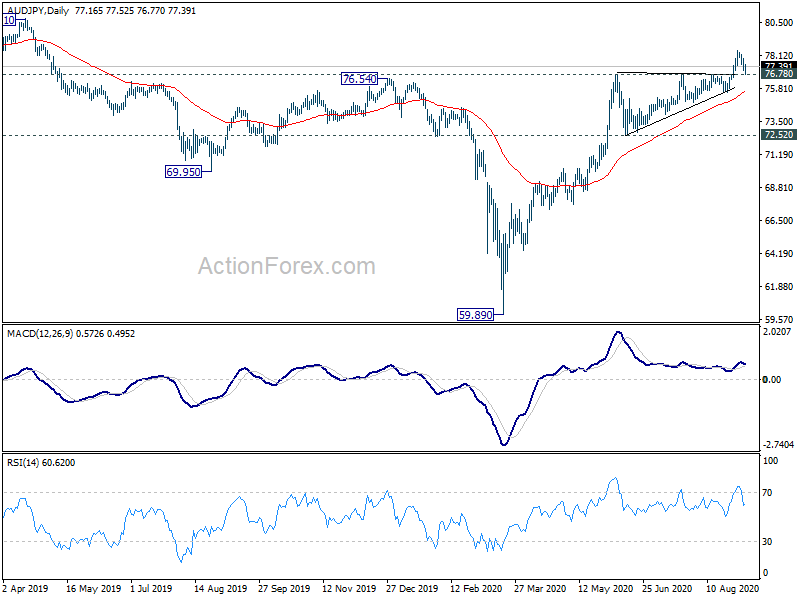
AUD/JPY still bullish but beware of the terminal thrust
AUD/JPY will be used by us as a gauge on overall risk sentiments as usual. The strong rise from 59.89 extended to as high as 78.46. There is risk that the thrust out of a triangle is a terminal wave that concludes a larger move. As long as 76.78 resistance turned support holds, which it’s doing, outlook will stay bullish for further rally. However, firm break of 76.78 would argue that AUD/JPY has already started a correction to rise from 59.98, with 72.52 support as a tentative target.
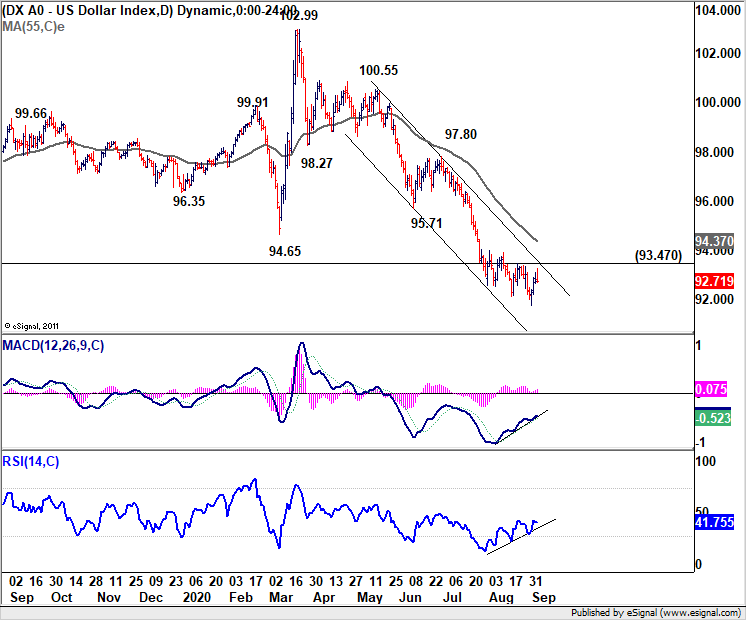
Dollar index’s rebound insufficient to confirm bottoming
As for Dollar, the rebound last week wasn’t strong enough to confirm bottoming yet. To be more specific, these levels are still holding: 1.1762 support in EUR/USD, 1.3053 support in GBP/USD, 0.7135 support in AUD/USD, 1.3239 resistance in USD/CAD. USD/CHF breached equivalent resistance of 0.9161 just so very briefly.
Same for Dollar index as it’s held by near term resistance at 93.47, despite loss of downside momentum. The down trend from 102.99 could still extend through 91.74. Nevertheless, firm break of 93.47 would firstly indicate short term bottoming. Secondly, subsequent rise would likely correct whole fall from 102.99 and target 95.71/97.80 resistance zone.
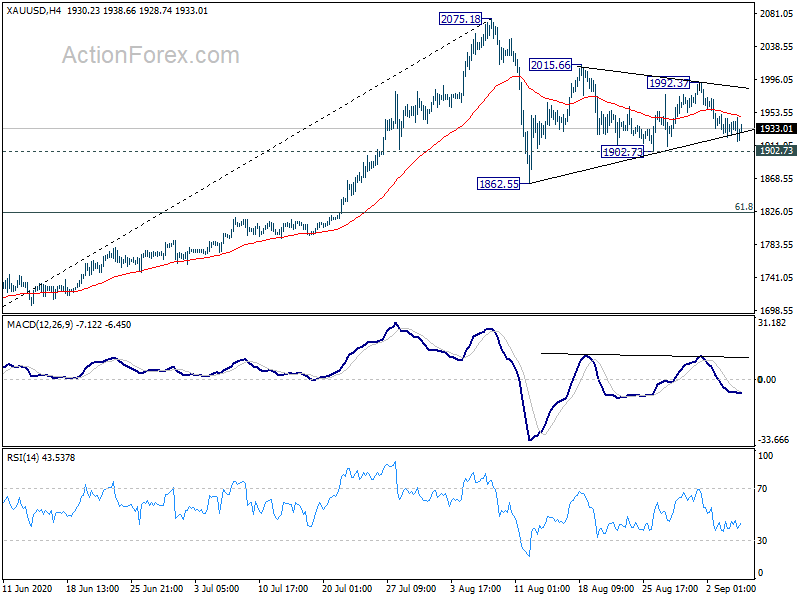
Gold to confirm if it’s starting a deeper down leg in correction
Gold will be used to “re-confirm” if Dollar is staging a genuine rebound. The breach off near term trend line support on Friday was a little disappointing as there was no follow through selling. Staying below 4 hour 55 EMA maintains some near term downside bias. Break of 1902.73 support will affirm the case that corrective pattern from 2075.18 is starting a deeper down leg to 1862.55 support and below. But, until that happens.
GBP/USD Weekly Outlook
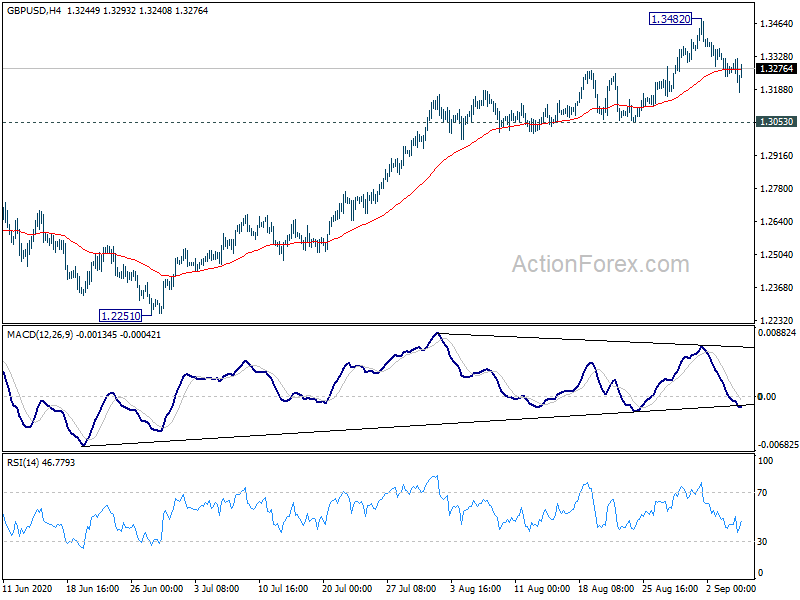
GBP/USD rose further to 1.3482 last week but retreated quickly since then. Initial bias stays neutral this week for consolidations first. Further rally is expected as long as 1.3053 support holds. On the upside, break of 1.3482 will resume the whole rise from 1.1409 to 1.3514 key resistance next. However, break of 1.3053 will indicate short term topping and initial rejection by 1.3514. Intraday bias will be turned back to the downside for 55 day EMA (now at 1.2955) and below.
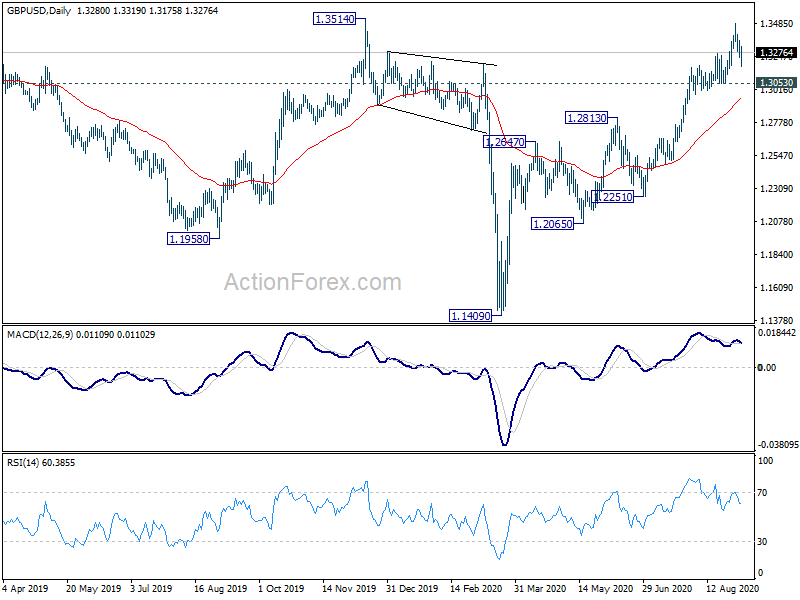
In the bigger picture, immediate focus is still on 1.3514 resistance. Decisive break there should at least confirm medium term bottoming at 1.1409. Further rise should be seen to 1.4376 resistance first. Though, rejection by 1.3514 will retain bearishness for resuming the down trend from 2.1161 (2007 high) at a later stage.
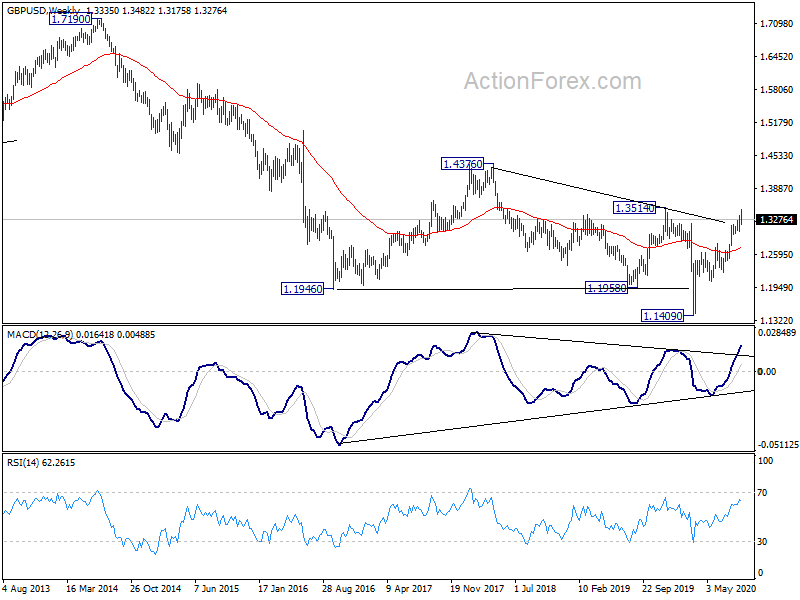
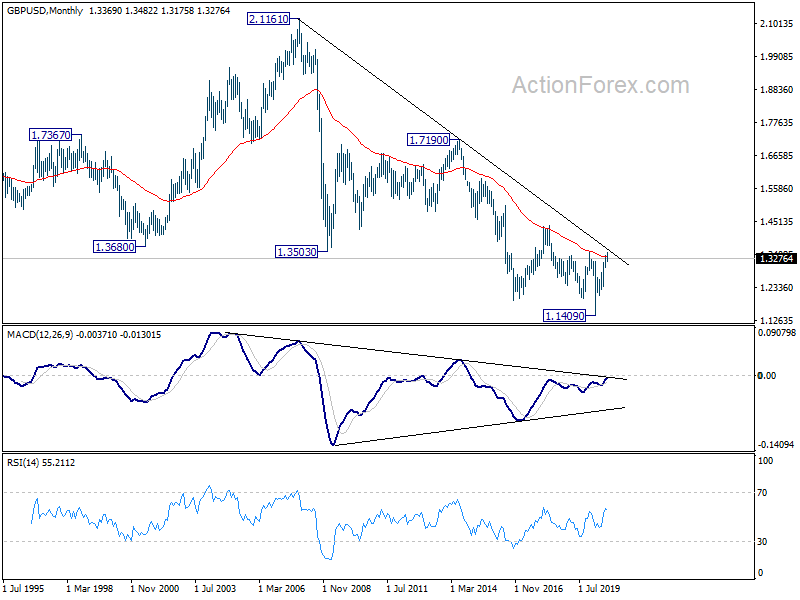
In the longer term picture, the case of long term bullish reversal is building up with breach of 55 month EMA. Bullish convergence conditions are also seen in weekly and monthly MACD. Decisive break of 1.3514 will argue that rise from 1.1409 is at least a medium term up trend that corrects that fall from 2.1161 (2007 high). We’ll find out soon.


