
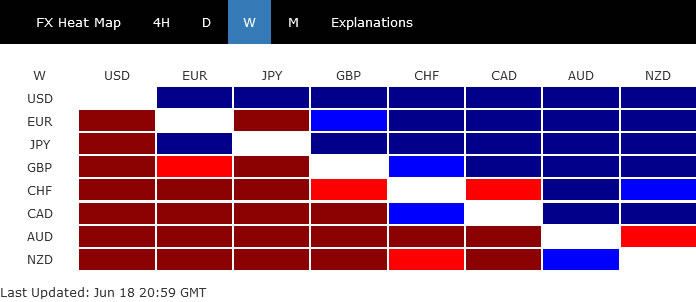
Dollar ended last week sharply higher as boosted by the surprisingly hawkish FOMC projections. Yen followed as second strongest on steep selloff in stocks, while Euro is a distant third. Commodity currencies were the worst performers, with Aussie leading the way, followed by New Zealand Dollar. Though, Swiss Franc were also one of the weakest.
Nevertheless, until the economic and health development warrant a rate Fed hike next year, Dollar will likely continue to follow an inverse path with risk appetite. We’re not seeing stocks in long term correction for now, but just a medium term correction. Hence, while the near term strength in the greenback was solidified, current rally is still seen as just part of the medium term consolidations.
FOMC turned out to be much hawkish than expected
FOMC rate projection last week turned out to be much hawkish than expected. Fed now forecasts two rate hikes in 2023. Further than that, 7 of 18 policymakers had indeed penciled in one or two hikes in 2022. With a little strong growth and inflation data in the rest of the year, the tide could easily tilt towards a hike just next year. The development prompted strong rally in Dollar, and steep selloff in stocks towards the end of the week.
Some suggested readings on Fed:
- Fed Projects 2 Rate Hikes in 2023, Strongly Upgrades Growth and Inflation Outlook
- Hawkish Bullard Sends US Dollar Higher
- June FOMC Meeting: Notable Shift in the “Dot Plot”
- FOMC Pulls Forward the Start of Rate Hikes
DOW in medium term correction after worst week of the year
DOW had the worst week of the year and hawkish Fed prompted steep selloff towards the end of the week. The break of 55 day EMA, medium term channel support, and 33473.80 support all suggested that 35091.56 is a medium term top. It’s now in correction to rise from 26143.77, targeting 38.2% retracement at 31673.50. We’d expect strong support from there to bring rebound to extend the pattern.
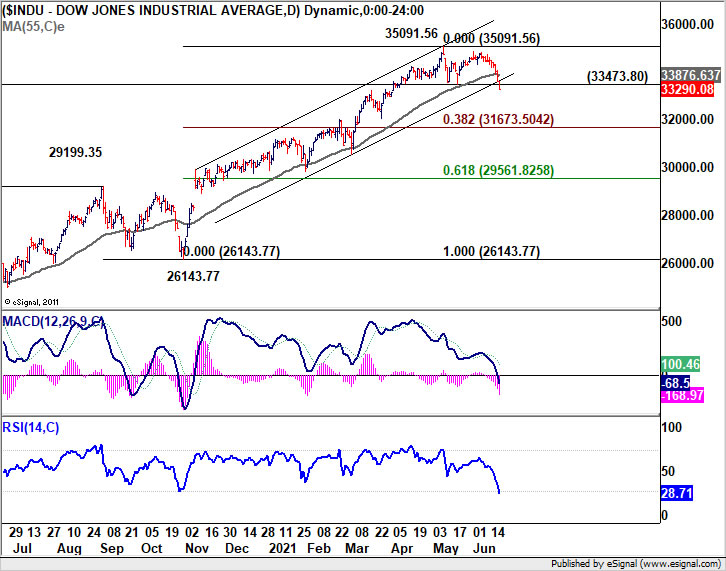
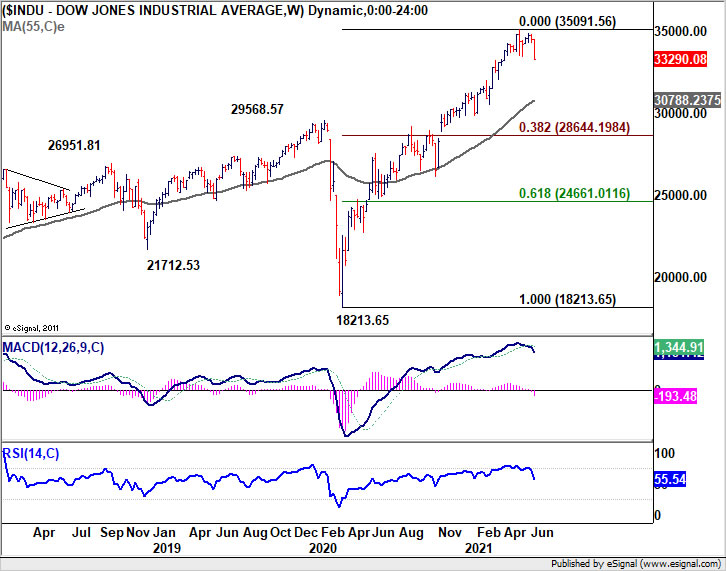
It way too early to turn overly bearish. But we’d like to point out that sustained break of 31673.50 will argue that DOW is indeed corrective the whole up trend form 18213.65 (2020 low). In this case, deeper fall would be seen to 55 week EMA (now at 30788.23) or even further to 38.2% retracement at 28644.19. We’re not expecting this to happen for now, though.
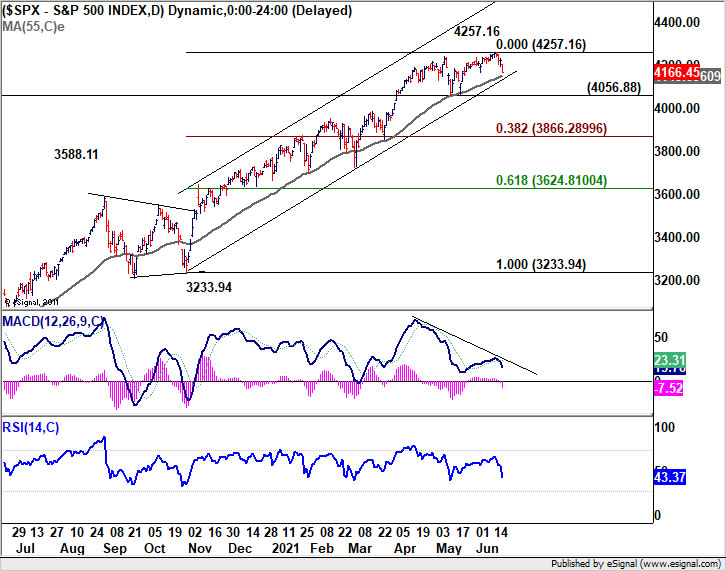
S&P 500 is lagging behind DOW in the bearish development and it’s still holding above 55 day EMA, as well as medium term trend line. It’s also kept above well 4056.88 support (corresponding to DOW’s 33473.80). It’s likely for SPX to follow DOW’s steps to break through 4056.88 in the near term, as a correction to rise from 3233.94. But it might probably not hit 38.2% retracement of 3233.94 to 4257.16 at 3866.28, unless something very bearish happens.
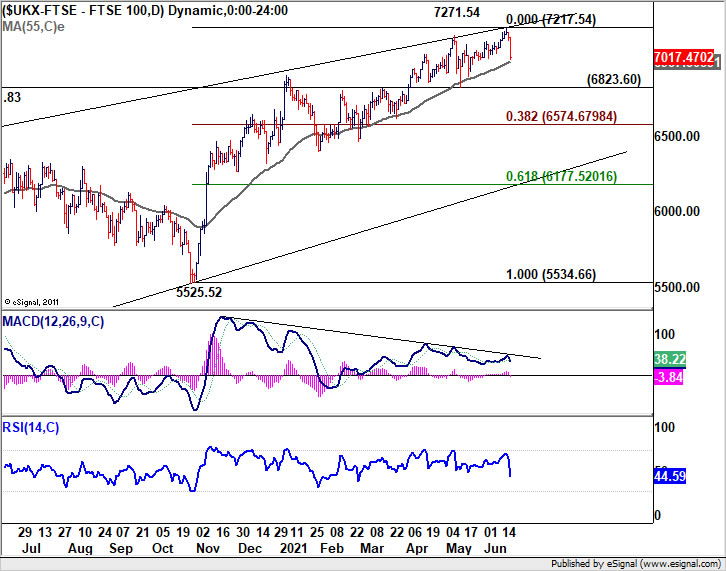
FTSE could also be starting medium term correction
FTSE also had a rather bad week last week. Considering bearish divergence condition in daily MACD, risk of a deeper correction is relatively high. Firm break of 55 day EMA (now at 6897.80) will likely send the index through 6823.60 support, as correction to rise from 5525.52. But we’d also expect strong support from 38.2% retracement of 5525.52 to 7217.54 at 6574.67 to contain downside and bring rebound.
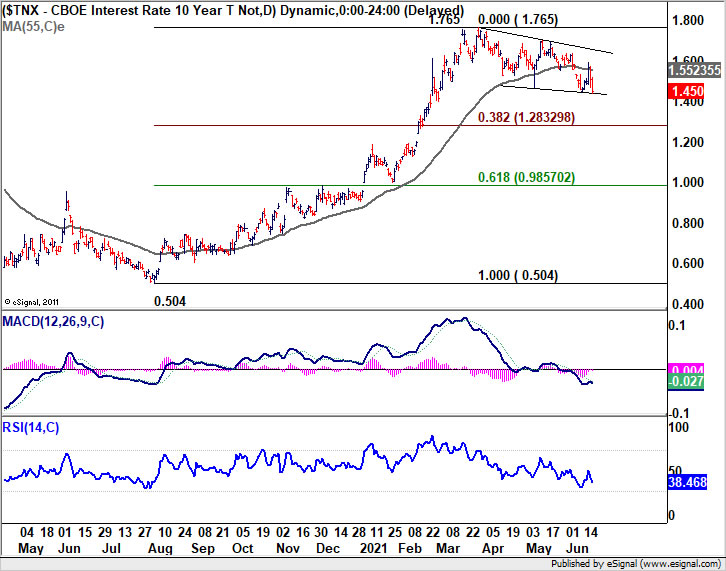
TNX recovery capped by 55 day EMA, to continue downwards
US 10-year yield’s rebound attempt was capped by 55 day EMA last week as corrective pattern from 1.765 extends. Deeper decline remains mildly in favor as long as this 55 day EMA holds. TNX would gyrate towards 38.2% retracement of 0.504 to 1.765 at 1.283. We’d expect strong support from there to bring rebound, the extend the corrective pattern, or resume the medium term up trend.
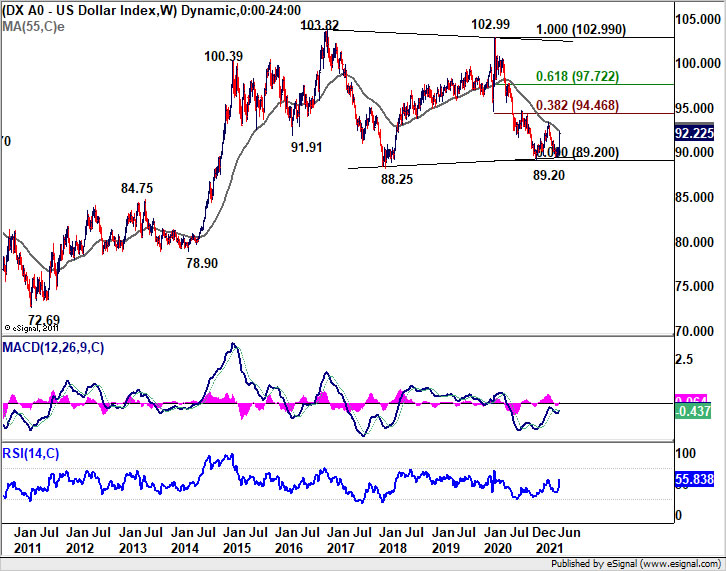
DXY in third leg of consolidation pattern, targeting 93.43 and above.
Dollar index surged sharply last week and hit as high as 92.22. Further rally is expected as long as 55 day EMA (now at 90.73) holds. DXY should target 93.43 resistance and possibly further to 38.2% retracement of 102.99 to 89.20 at 94.46 at 94.46. However, rise from 89.53 is currently still seen as the third leg of the consolidation pattern from 89.20. Hence, we’d expect strong resistance from 94.46 to limit upside, at least to extend sideway trading.
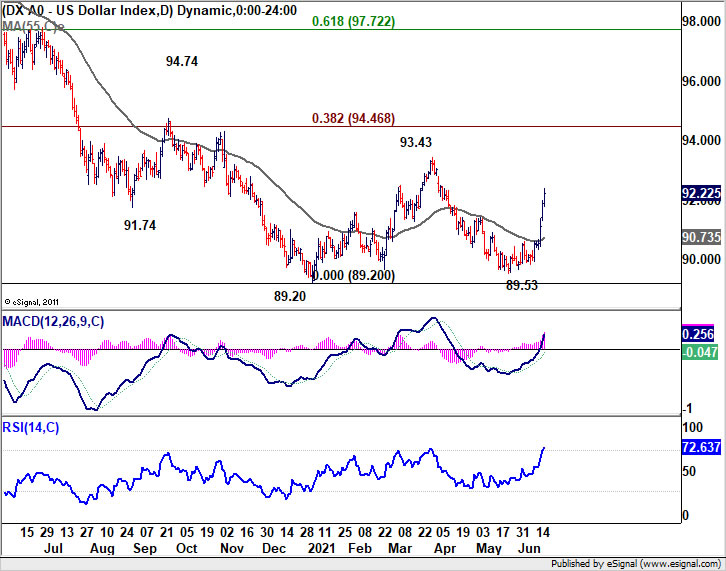
However, we’d also like to point out a less favored, more bullish scenario. That is, fall from 102.99 is the third leg of the sideway pattern from 103.82, which could have completed at 89.20 after hitting 88.25. Sustained break of 94.46 would suggest that that DXY is at least in another rising leg of the pattern, and should target 61.8% retracement at 97.72 and above. We’re not expecting this to be the case for the near term, unless we’re seeing some very bearish development in stocks, or one-sided breakout in yields.
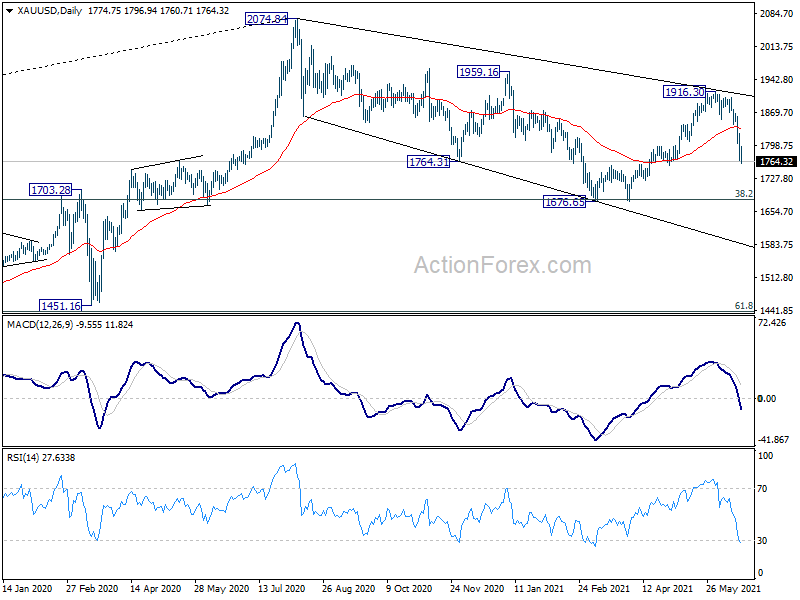
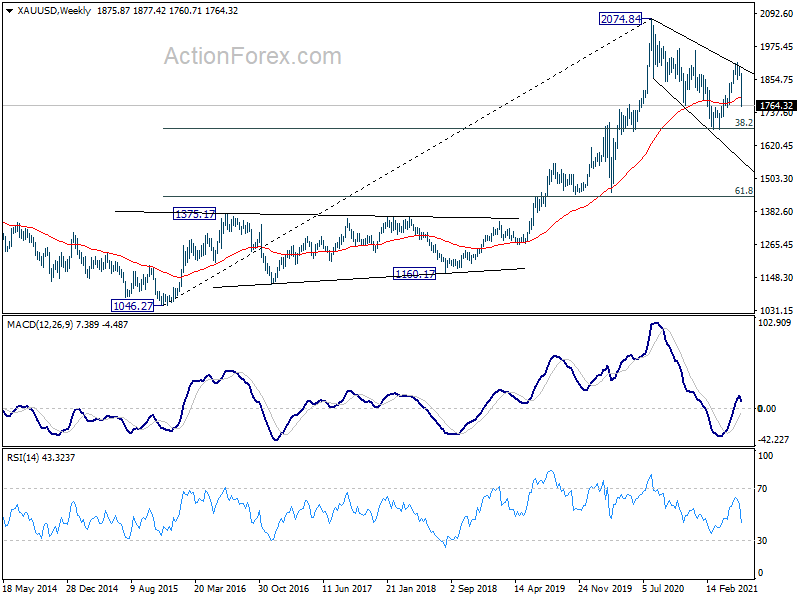
Gold extending corrective pattern towards 1676.65 support again
Gold also suffered steep selloff on broad based Dollar strength last week. The development dampened our original bullish view, and suggests that correction from 2074.84 is still in progress, with fall from 1916.30 as the third leg. Based on current downside momentum, deeper fall should be seen to 1676.65 support.
However, such level coincides with long term fibonacci level of 38.2% retracement of 1046.27 to 2074.84 at 1681.92. We are not expecting a strong, sustained break of 1676.65. However, firm break of 1676.65 would open up the case for deeper correction to 61.8% retracement at 1439.18. If such bearish case happens, it could be an indication of much stronger bullish momentum in Dollar.
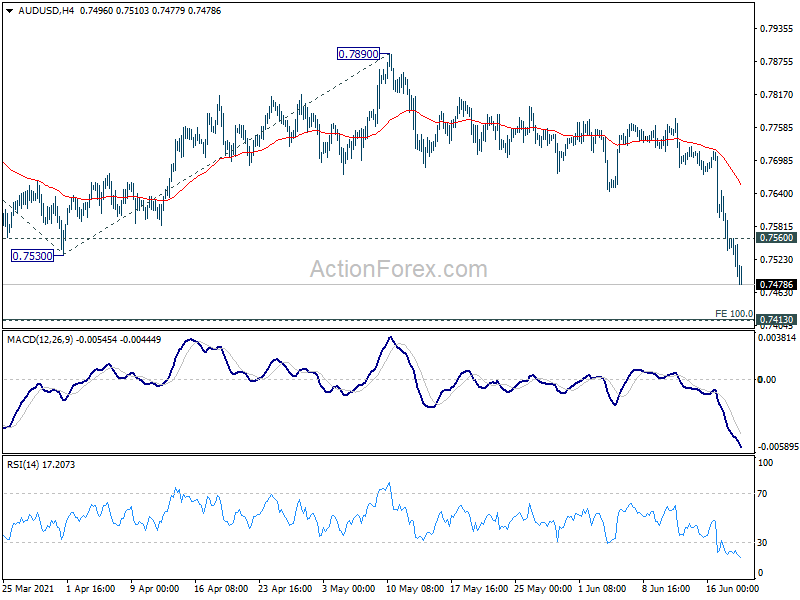
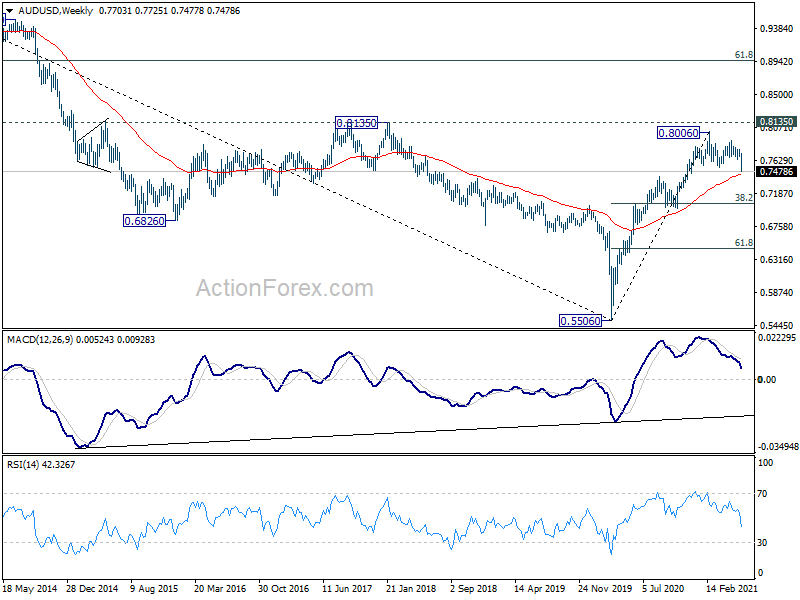
AUD/USD Weekly Outlook
AUD/USD’s corrective pattern from 0.8006 resumed last week by breaking through 0.7530 support. Initial bias stays on the downside this week. Deeper decline would be seen to 100% projection of 0.8006 to 0.7530 from 0.7890 at 0.7414. We’d expect strong support from there to bring rebound. On the upside, above 0.7560 minor resistance will turn intraday bias neutral first. However, sustained break of 0.7414 will argue it’s at least in larger scale correction, and target 161.8% projection at 0.7120 next.
In the bigger picture, rise from 0.5506 medium term bottom could either be the start of a long term up trend, or a corrective rise. Reactions to 0.8135 key resistance will reveal which case it is. Rejection by 0.8135 key resistance, followed by firm break of 0.7413 resistance turned support, will favors the latter case. Deeper decline would be seen to 38.2% retracement of 0.5506 to 0.8006 at 0.7051 first.
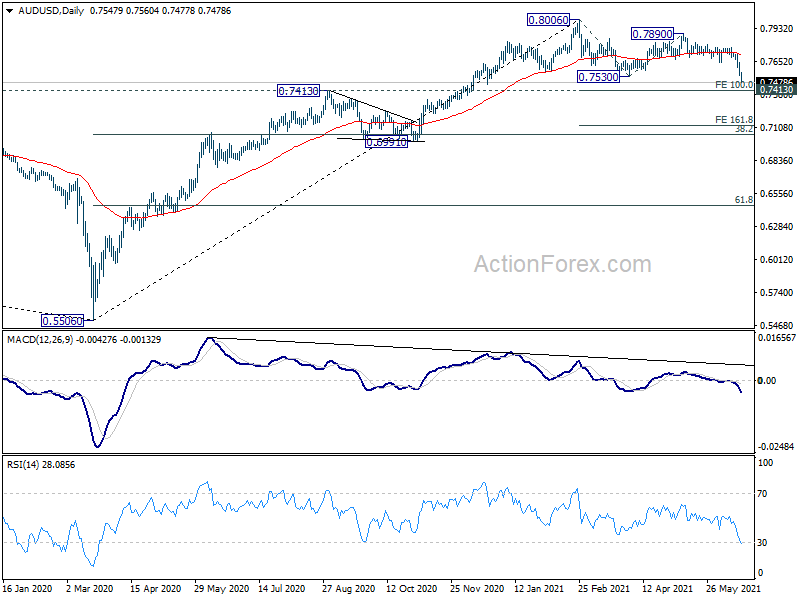
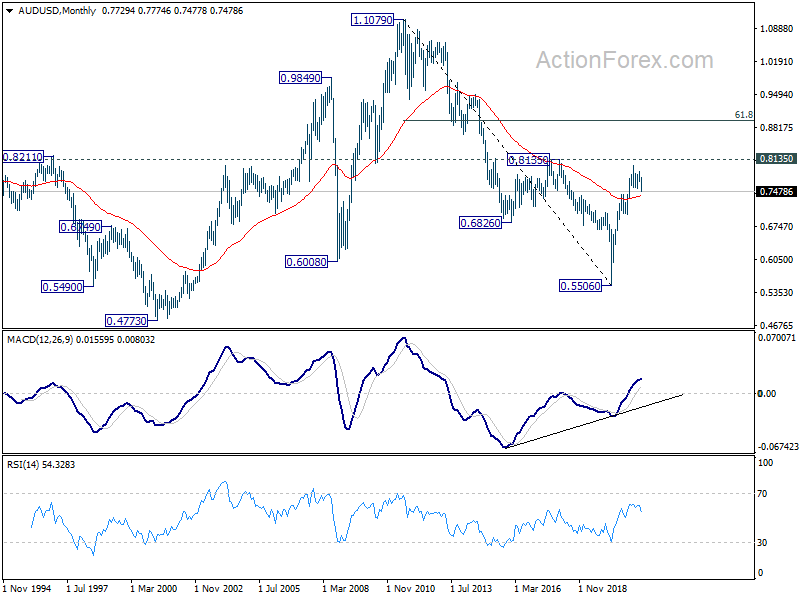
In the longer term picture, 0.5506 is a long term bottom, on bullish convergence condition in monthly MACD. Focus is now back on 0.8135 structural resistance. Decisive break there will raise the chance that rise from 0.5506 is an impulsive up trend. Next target should be 61.8% retracement at 0.8950 of 1.1079 to 0.5506 and above. Though, rejection by 0.8135 will keep the case of medium to long term sideway consolidation open.


