
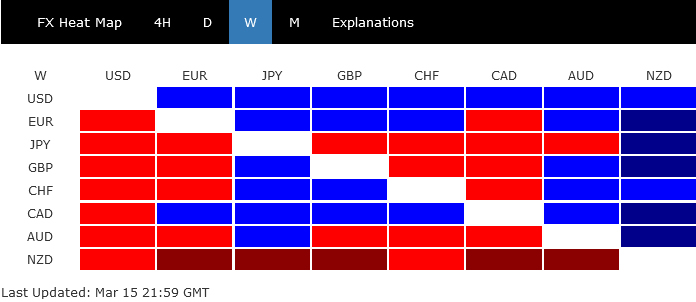
Dollar ended the week as the strongest currency, boosted by the fresh round of inflation data that led markets to reassess expectations around Fed’s rate cuts. This recalibration was also marked a pronounced rebound in treasury yields and a notably cautious sentiment pervading the stock market. Despite this rally, Dollar remained confined within the previous week’s range against its major counterparts, suggesting that a clear directional shift is still pending confirmation.
On the other hand, Yen and New Zealand Dollar found themselves at the lower end of the performance spectrum. In Japan, positive outcomes from wage negotiations have seemingly paved the way for a much-anticipated BoJ rate hike. Yet, market participants remain divided on whether BoJ will act in its next meeting on Tuesday or opt for a rate adjustment in April. Meanwhile, Kiwi faced downward pressure following remarks from New Zealand’s Finance Minister, which painted a grim picture of the economic outlook and fueled speculation about an earlier rate cut by RBNZ.
In other parts of the currency market, Canadian Dollar and Euro trailed behind the greenback as the second and third strongest currencies, respectively. Australian Dollar was positioned as the third weakest, while Sterling and Swiss Franc were mixed in the middle. It’s important to note, however, that the currency landscape could be significantly reshaped in the coming week, as a series of central bank meetings—including those of BoJ, RBA, Fed, SNB, and BoE—are on the horizon.
Inflation Realities Prompt Shift in Market Expectations for Fed Rate Cuts
The central theme of the financial markets last week was the increased uncertainty regarding Fed’s policy loosening path, primarily stirred by fresh inflation data. The release of February’s CPI and PPI reports not only confirmed that inflation battle in the US is far from over but also triggered notable response across asset classes. Treasury yields staged a significant leap, taking Dollar higher alongside. At the same time, major stock indexes showed sign of fatigue after recent record runs and appeared to be losing momentum as investors turned cautious.
The discourse in the markets is now centering around three critical facets of Fed’s monetary easing path: the timing of the initial rate cut, the total number of cuts within the year, and the final stance of this cycle.
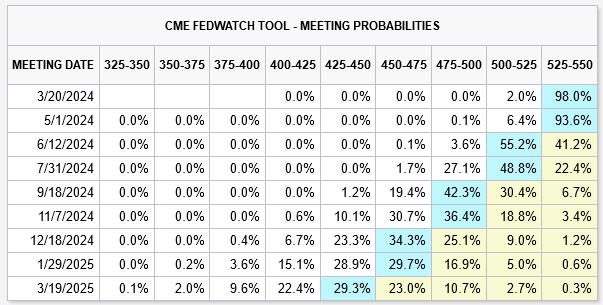
The persistent nature of inflation has led to reassessment among traders, who are increasingly betting on a delay in the first rate reduction. The possible move from June to July would allow more time for the current interest rates to impact exert their intended dampening effect on demand and inflation. This adjustment in expectations is reflected in Fed fund futures, where the likelihood of a June rate cut has decreased from nearly 75% to less than 60% in just a week’s time. Interest-rate swaps also pushed bets on the timing of the full first quarter-point rate cut to the July.
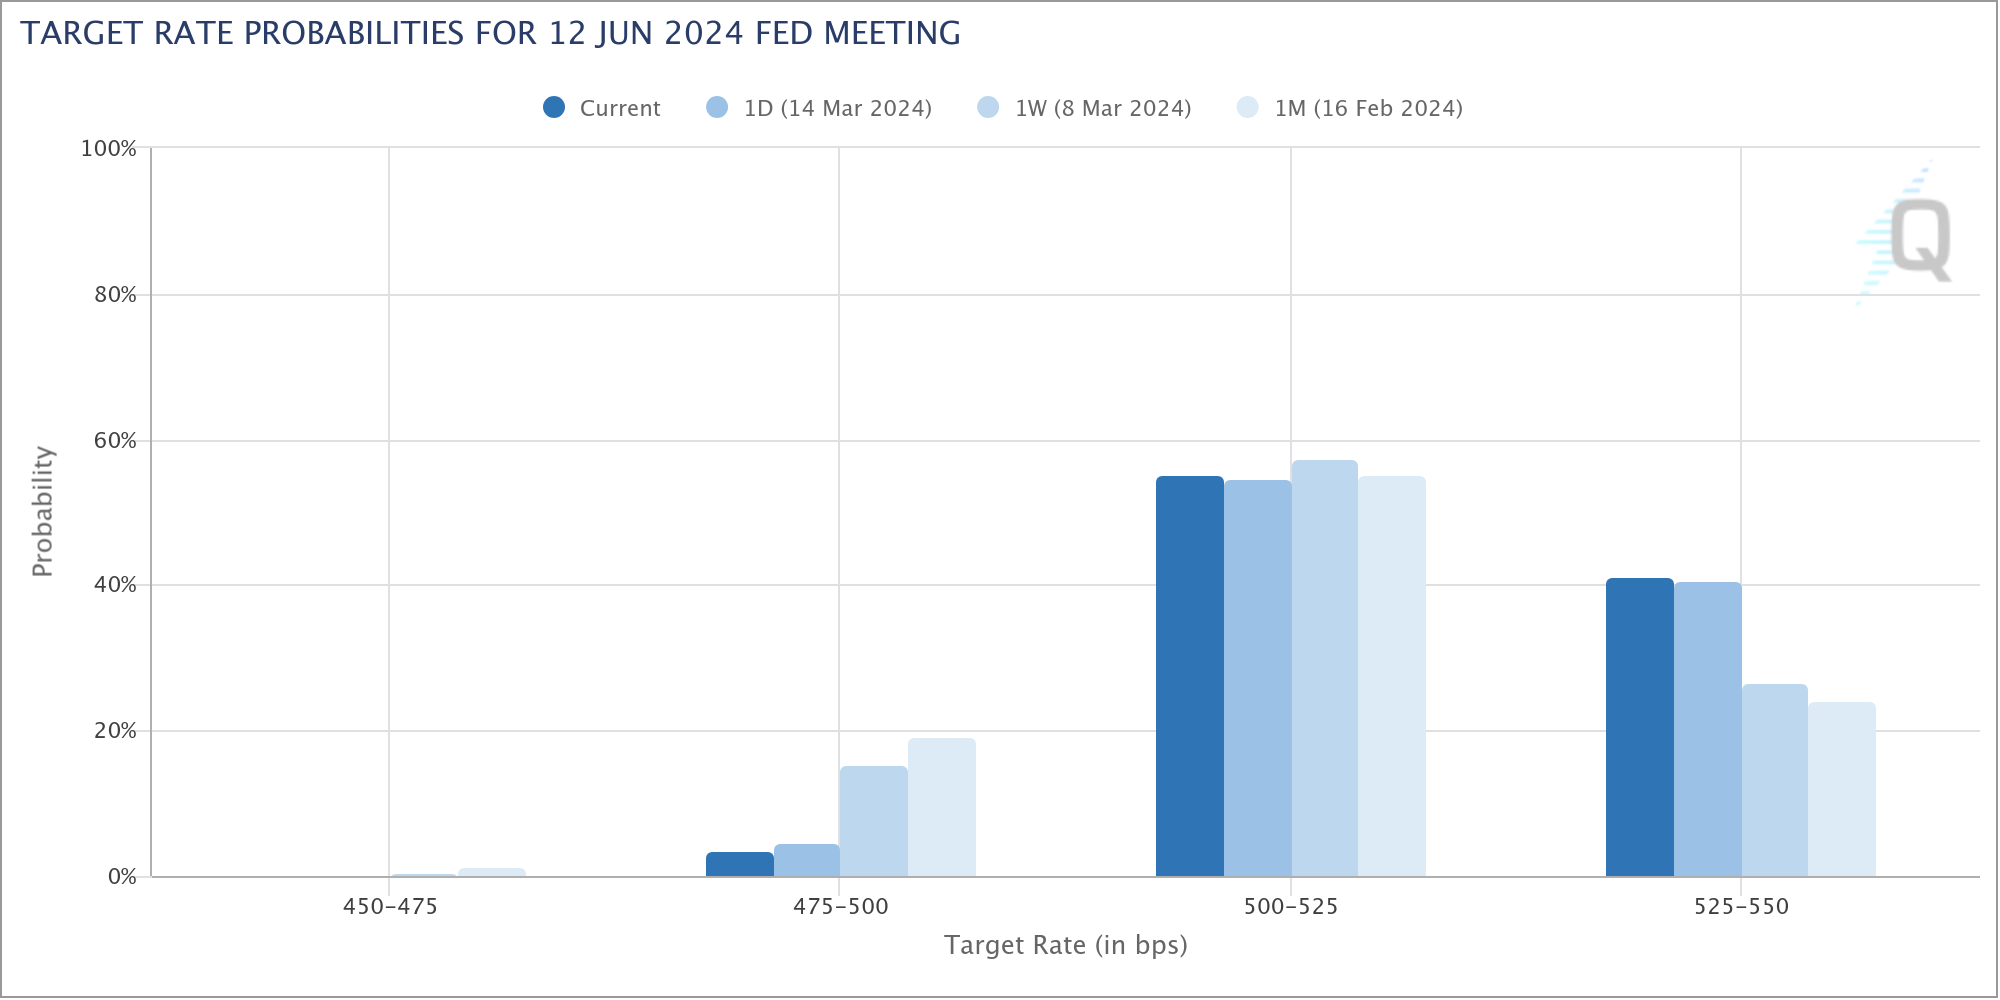
The prospects for three rate cuts within the year, as previously indicated in the December dot plot, are also being reconsidered. Current pricing in the Fed fund futures suggests only about 65% chance of federal funds rate at 4.50-4.75% (down from current 5.25-5.50%,) by the end of the year, a marked shift from expectations following the December meeting. Swaps pricing is also showing less than 75 bps of easing priced this year.
Discussions around the terminal rate of the Fed’s current cycle introduce another layer of complexity. Some economists argued that with stronger productivity growth in the US comparing to other regions, neutral rate, where monetary policy neither stimulates nor restrains economic growth, might be higher than initially thought. This speculation suggests that the terminal interest rate could lean closer to 4% rather than 3% mark.
Fortunately, there is less than a week when Fed will publish its new economic forecasts and dot plot. They should provide some clarify to these questions.
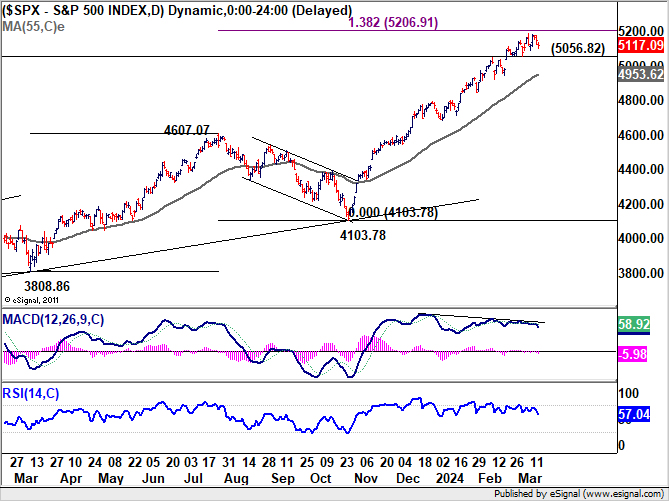
As for the markets, S&P 500 continued to lose upside momentum as seen in D MACD. There is prospect of a near term correction, subject to reactions to FOMC projections. Break of 5056.82 support will indicate short term topping, just ahead of 138.2% projection of 3808.86 to 4607.07 from 4103.78 at 5206.91. In this case, deeper pull back would be seen back to 55 D EMA (now at 4953.62).
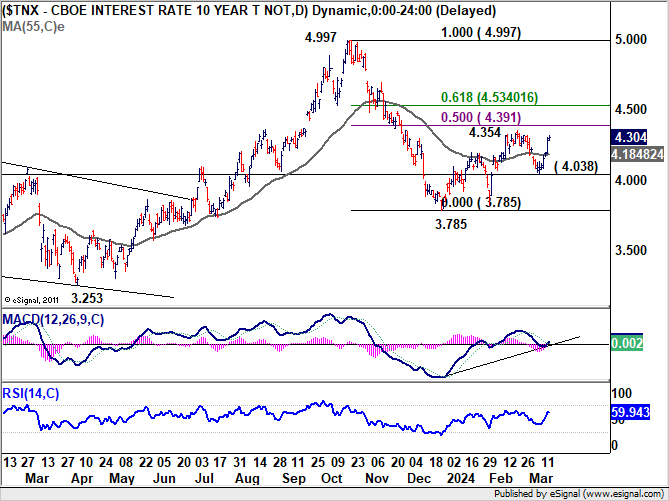
10-year yield’s strong rally last week was a surprise to us. The development suggests that corrective rebound from 3.785 is still in progress. Further rise is now in favor as long as 4.038 support holds and break of 4.354 resistance could be seen. But strong resistance is expected between 4.391 and 4.534 (50% and 61.8% retracement of 4.997 to 3.785) to limit upside. Nevertheless, in an unlikely scenario that 4.534 is taken out decisively, there should be some drastic underlying changes.
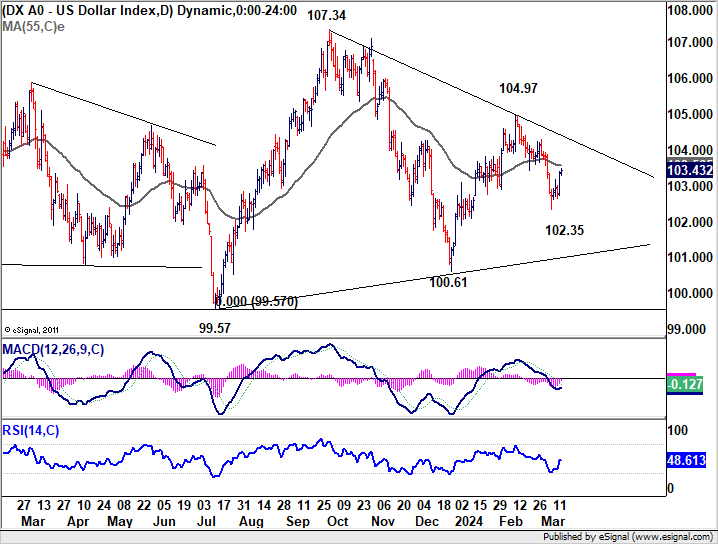
Dollar index’s recovery last week indicates short term bottoming at 102.35. But upside is capped below 55 D EMA (now at 103.56). Near term outlook is turned mixed for now. The more certain view is that medium term corrective pattern form 99.57 (2023 low) is extending. But it’s usually very hard to pinpoint the movements in the middle of a corrective pattern.
In the bearish case, rejection by 55 D EMA, followed by break of 102.35, will argue that fall from 104.97 is the third leg of the decline from 107.34. Deeper decline should be seen to 100.61 support and possibly below. But break of 99.57 is not envisaged.
In the bullish case, sustained trading above 55 D EMA will argue that rise from 100.61 is the third leg of the pattern from 99.57 and is still in progress. Further break of 104.97 will target 107.34 resistance.
DAX and Nikkei React to ECB and BoJ Expectations
ECB’s policy outlook appears significantly clearer compared to Fed’s, with Eurozone grappling with a weaker economy but more controlled inflation. In Governing Council member Martins Kazaks’s words, “The dragon of inflation is pinned to the ground, a little more and it will be defeated.” There is broad consensus within ECB for initiating rate cuts come spring. The preference leans towards June for these cuts, pending the Q1 wages data expected in May, despite some dovish voices advocating for an earlier start in April.
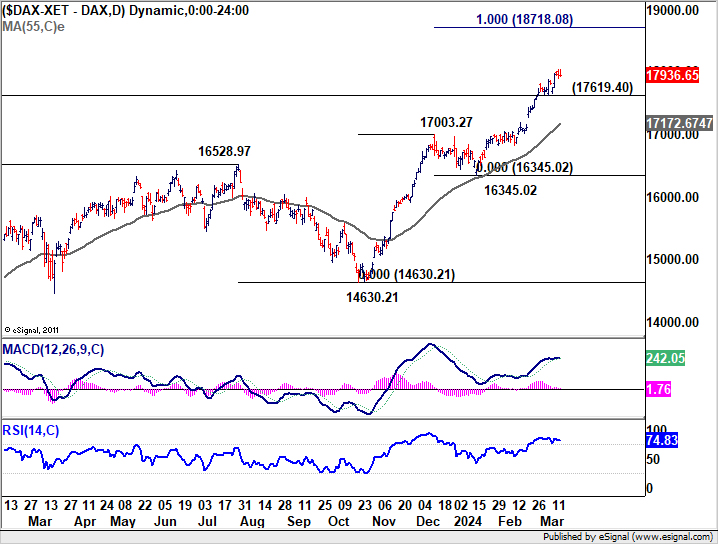
DAX continued to make new record highs last week and up trend continued. Near term outlook will stay bullish as long as 17619.40 support holds. Next target is 100% projection of 14630.21 to 17003.27 from 16345.02.
Conversely, in Japan, the encouraging developments from this year’s Shunto wage negotiations strengthened the case for a near-term BoJ rate hike. However, the market remains uncertain about the timing, with some analysts suggesting BoJ might delay until April to coincide with new economic projections.
Yet, Nikkei newspaper reported on Saturday that an imminent end to the negative interest rate policy could come the upcoming Tuesday, marking the first hike in 17 years. The significant wage increases this year, according to a BoJ source, is viewed as sufficient even by the most cautious reflationists to warrant a change in policy.
Despite weak signals in Japan’s economy, the turn of real wages growth into positive territory and the anticipation of continued wage increases are expected to bolster consumption significantly. This prospective uplift in spending could help mitigate the impacts of the anticipated policy change.
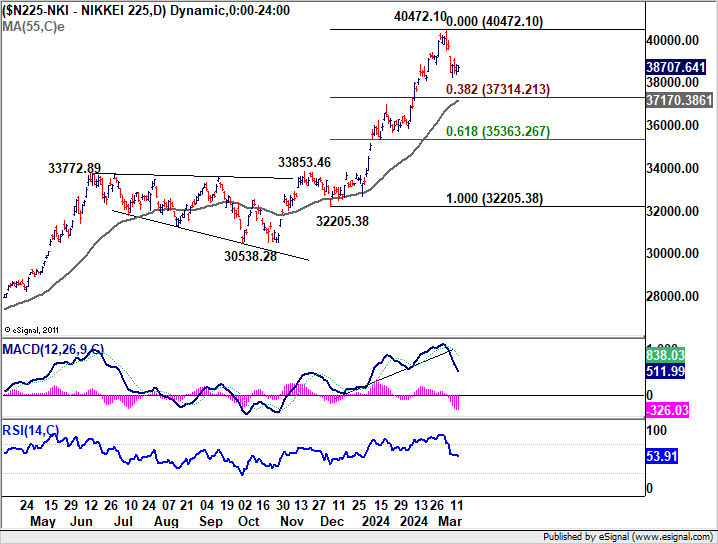
As investors brace for the BoJ’s expected action, the Nikkei index experienced a notable decline last week, suggesting a short-term peak has been reached. Yet, strong support is anticipated from the 38.2% retracement level, closely aligned with the 55 D EMA, likely to contain further downside and set the stage for consolidation ahead of another potential surge.
NZD’s Sharp Decline: Economic Pessimism and RBNZ Speculations
New Zealand Dollar tumbled sharply on Friday and ended the week as the worst performer. NZD/USD was indeed to top mover of the week, losing -1.51%.
This sharp decline was triggered by disappointing manufacturing data, but the tone was further darkened by pessimistic remarks from New Zealand Finance Minister Nicola Willis. Addressing business leaders, Willis set a somber tone for the upcoming Budget Policy Statement due on March 27, indicating that it “won’t make happy reading.”
Finance Minister Willis elaborated on the challenges ahead, noting that due to “factors outside the government’s control”, the Treasury’s growth outlook has darkened considerably. “Growth over the next few years is likely to be significantly slower than it had previously thought,” she added
Although RBNZ’s baseline scenario remains to keep interest rates steady until 2025, deteriorating economic outlook has fueled speculations of sooner than anticipated rate cut.
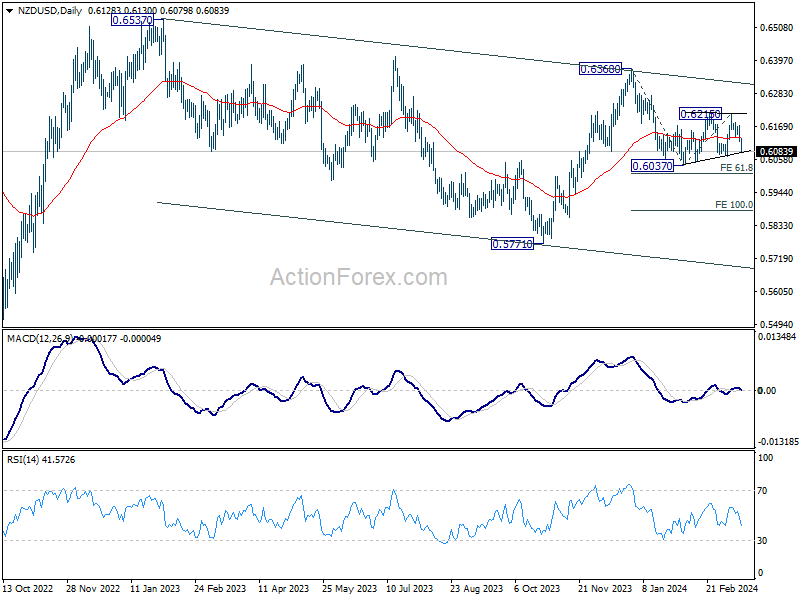
Technically, NZD/USD should be on the verge of resume recent decline from 0.6368. Firm break of 0.6037 support will target 61.8% projection of 0.6368 to 0.6037 from 0.6125 at 0.6010 first. Firm break there could prompt downside acceleration to 100% projection at 0.5884 next.
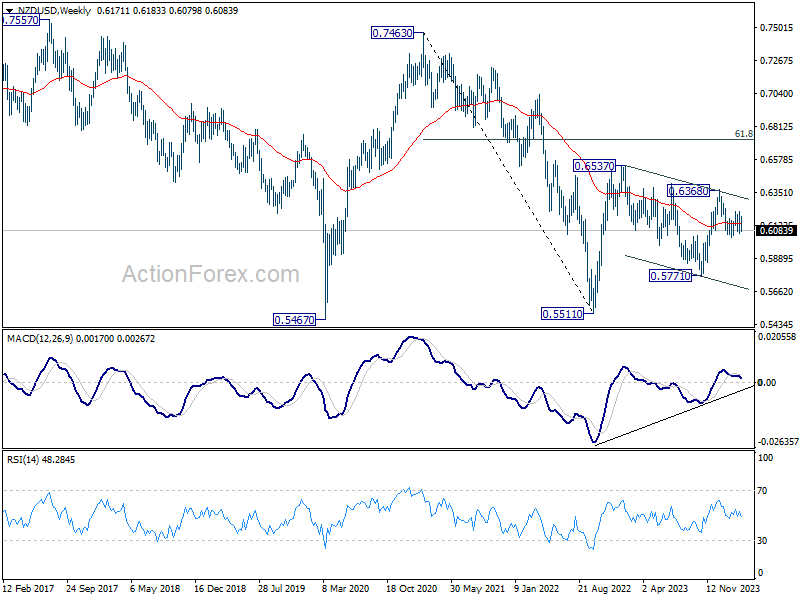
Also, the fall from 0.6368 is seen as the third leg of the corrective pattern from 0.6537 (2023 high). Break of 0.5771 support (2023 low) could be seen before NZD/USD forms a medium term bottom.
USD/CHF Weekly Outlook
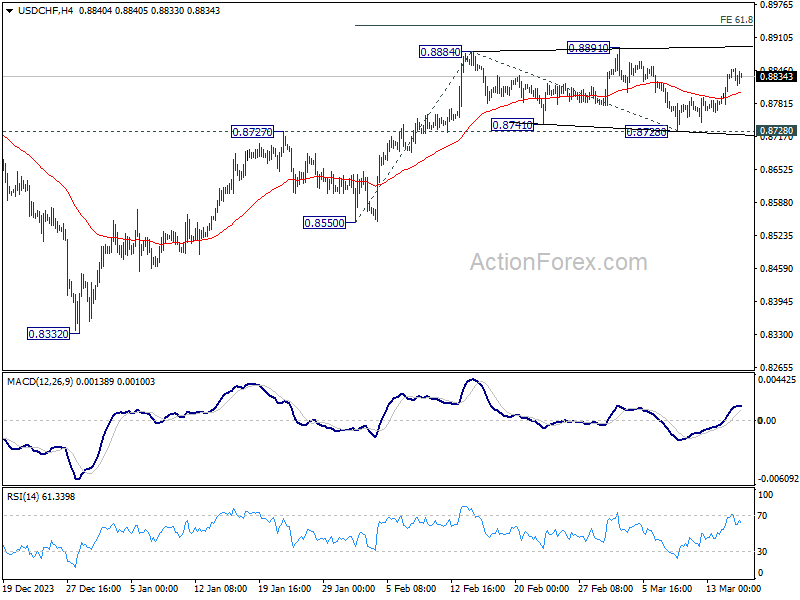
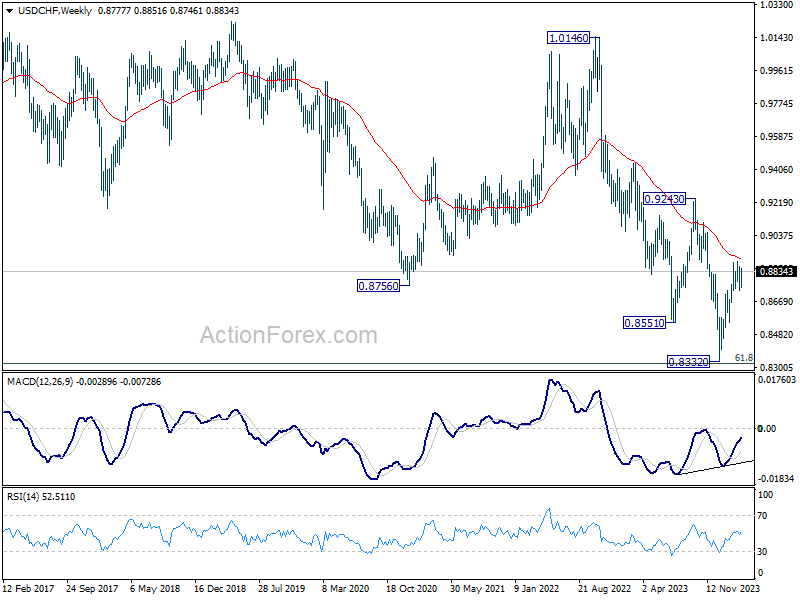
USD/CHF’s strong rebound last week suggests that consolidation from 0.8884 has completed with three waves to 0.8728. Initial bias stays mildly on the upside this week for retesting 0.8891 resistance first. Firm break there will resume whole rally from 0.8332. Next target is 61.8% projection of 0.8550 to 0.8884 from 0.8728 at 0.8934. For now, this will remain the favored case as long as 0.8728 support holds, in case of retreat.
In the bigger picture, price actions from 0.8332 medium term bottom as seen as developing into a corrective pattern to the down trend from 1.0146 (2022 high). Further rise would be seen as long as 0.8555 support holds. But upside should be limited by 0.9243 resistance, at least on first attempt.
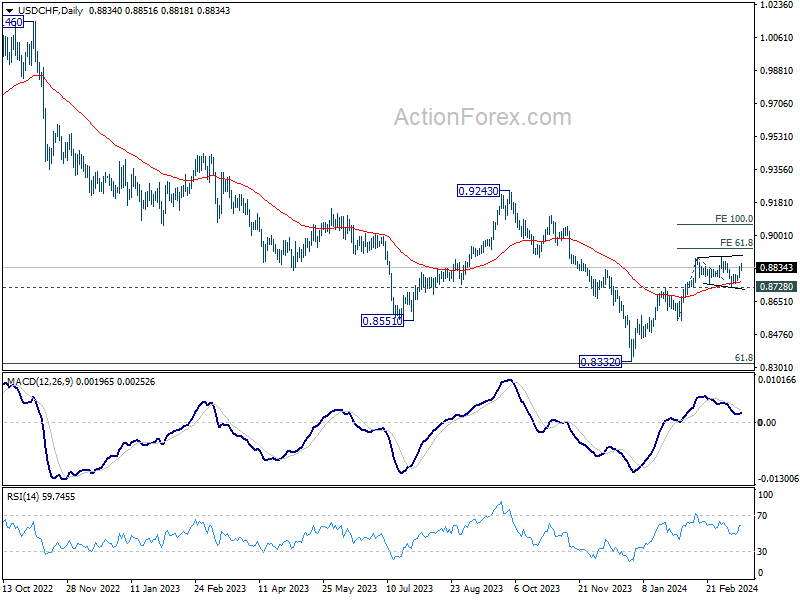
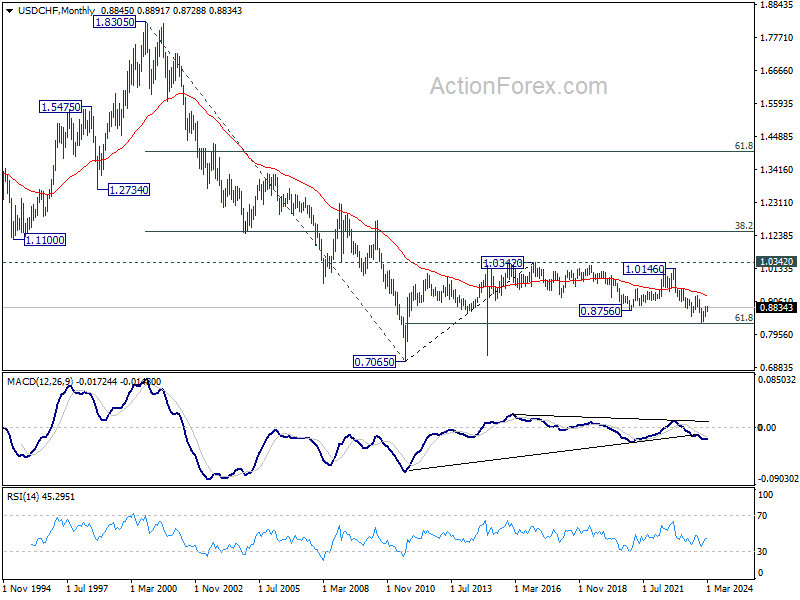
In the long term picture, price action from 0.7065 (2011 high) are seen as a corrective pattern to the multi-decade down trend from 1.8305 (2000 high). Strong rebound from 61.8% retracement of 0.7065 to 1.0342 (2016 high) will start the third leg as a medium term rally. But there will be no sign of long term reversal until firm break of 38.2% retracement of 1.8305 to 0.7065 at 1.1359.


