


TL;DR: Fed Chair Warsh’s description of Wednesday’s hike as removing “a dose of accommodation” drove the 2-year Treasury yield and Dollar Index sharply higher, but Fed funds futures barely moved the expected destination of the tightening cycle—leaving Brent’s $100 test as the upstream variable that decides whether the front end’s repricing gets confirmed.
Federal Reserve Chair Kevin Warsh introduced a new puzzle for markets when he described Wednesday’s rate hike as removing “a dose of accommodation” from the economy. The phrase invited a distinctly hawkish interpretation: if a federal funds target range of 3.75–4.00% is still accommodative, policy may have considerably further to travel before it becomes restrictive. Yet the market response was uneven. The 2-year Treasury yield surged, the Dollar followed, but Fed funds futures stopped short of endorsing a materially higher destination for rates.
That divergence is the central signal from the post-FOMC session. Markets brought the next hike closer, but they didn’t significantly lift the expected policy path over the full forecast horizon. The 2-year yield is therefore running ahead of the market that’s supposed to anchor it, while the Dollar Index has reached its first important resistance. Whether those moves develop into a broader repricing may now depend on the original inflation variable beneath the entire chain: whether Brent can hold above $100.
Warsh Gives Markets a Direction, Not a Stopping Point
Evercore’s Krishna Guha argued that Warsh’s repeated use of “accommodation” appeared deliberate rather than incidental. BNP Paribas’s James Egelhof offered the more aggressive interpretation: because accommodation normally means stimulus in Federal Reserve language, Warsh’s description implies the current policy stance is still meaningfully supportive.
Read literally, that would place 3.75–4.00% below the level at which policy begins actively restraining demand. If elevated inflation eventually requires the Fed to move into genuinely restrictive territory, more tightening could be needed than the current rate level alone suggests.
But the phrase doesn’t establish where neutral lies or how far rates remain from it. The neutral rate is better understood as an uncertain and moving range rather than a fixed threshold. Warsh himself called comparisons with neutral “useful academically” and described them as a framework that can help policymakers think about policy. He didn’t dismiss the concept; he declined to give it decisive operational weight in explaining Wednesday’s move.
That distinction resolves the apparent inconsistency. Warsh can describe the direction of policy as the removal of accommodation without identifying a precise neutral rate. A point estimate becomes more important when calibrating how far rates must rise and where the cycle should stop, rather than when explaining why one additional hike was justified.
UBS’s Jonathan Pingle identified the practical asymmetry this language may signal: a reaction function less sensitive to labor-market softness while maintaining a higher threshold for declaring policy restrictive. Warsh’s reference to the 4.1% unemployment rate and healthy job-openings data reinforced the view that the employment side of the Fed’s mandate isn’t currently preventing further action.
This is a defensible hawkish interpretation, but not yet a confirmed one. Warsh gave markets a direction of travel without calibrating the destination. That imprecision may have been intentional.
Fed Futures Reprice Pace, Not Destination
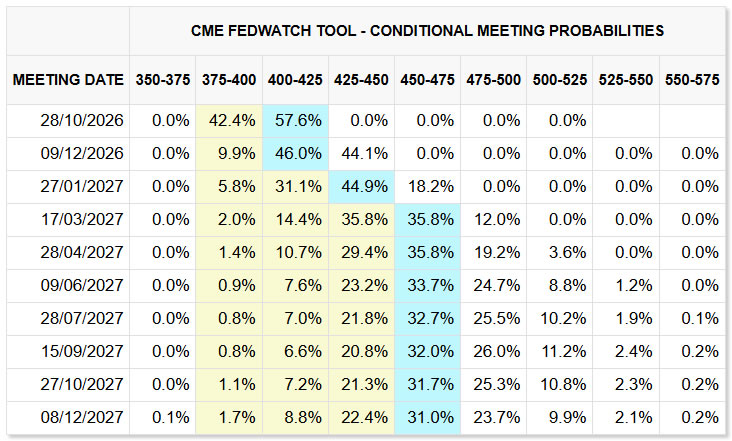
The Fed funds market responded most clearly at the front of the path. The probability of another hike on October 28 rose from 44.0% before the FOMC decision to 57.6% afterward. That’s a meaningful shift toward faster follow-up tightening.
The longer part of the distribution barely changed. The modal bucket for December 2027 remained 4.50–4.75%, with its probability moving only from 30.4% to 31.0%. More broadly, a calculation that weights the expected policy rate in each inter-meeting window by the length of that window leaves the average expected rate across the approximately 24-month horizon close to 4.50% both before and after the decision.
That 4.50% figure shouldn’t be treated as a terminal-rate estimate. It’s an average of the expected policy path across the horizon. The probability-weighted midpoint for December 2027 itself is closer to 4.64%.
Nevertheless, the conclusion is clear: the market repriced the timing of tightening much more than its eventual destination.
The 2-Year Yield Runs Ahead
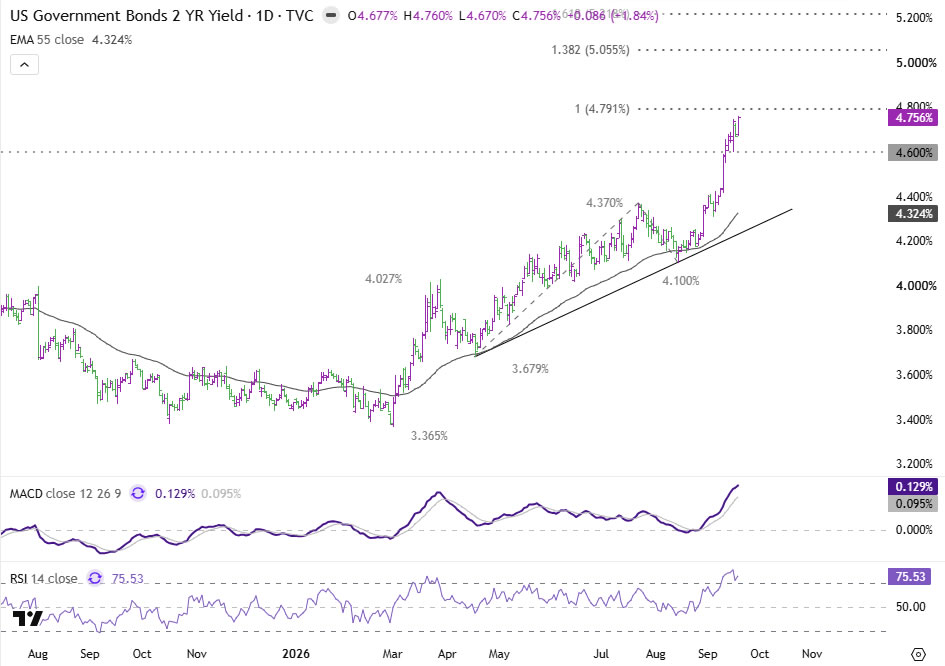
Treasuries delivered an even sharper verdict. The 2-year yield rose 12.6bp to 4.756%, compared with an increase of only 3.1bp in the 10-year yield and a decline of 2.9bp in the 30-year yield.
This isn’t the curve pattern normally associated with a generalized fiscal-credibility or duration-risk shock. Those concerns should exert more influence at the long end. Instead, the shortest of the three maturities made the largest move while the 30-year yield fell. The structure points toward concentrated near-term policy repricing.
The 2-year yield now stands around 26bp above the calculated 4.50% average expected policy rate over the next two years. That gap doesn’t prove the Treasury market has overshot because Treasury yields and average Fed funds expectations aren’t directly interchangeable. Term premium and other pricing components also matter. But the combination of that gap, the highly concentrated curve move, and a daily RSI reading above 75 suggests the front end is testing the limits of the available policy confirmation.
The next checkpoint is the 4.791–4.800% resistance zone. Rejection from that area, followed by a break below 4.600%, would favor a meaningful reversal toward the broader expected policy path.
A decisive break above 4.800% would instead expose the 5.055% projection. Such a move would leave two possible interpretations: the 2-year yield could be extending into an increasingly stretched overshoot, or Fed funds futures could begin catching up by pricing a higher policy destination. The response of the futures curve would distinguish between them.
Dollar Index: Reaching Its First Test
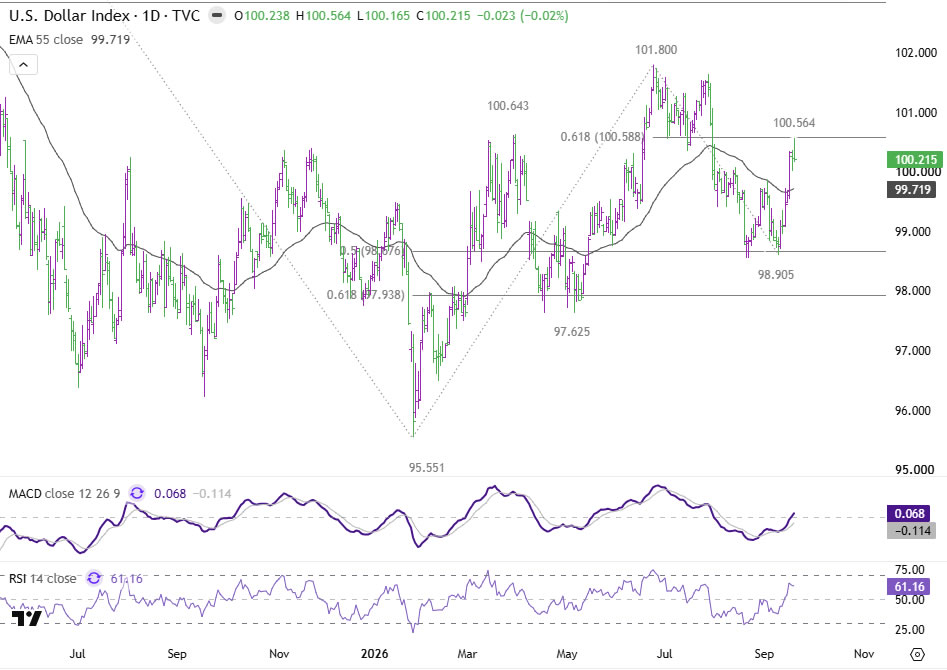
The Dollar Index has followed the front-end yield move, completing a double bottom at 98.56 and 98.91 and surging as high as 100.56. However, the rally stalled almost exactly at the 61.8% retracement of the decline from 101.80 to 98.90, located at 100.58.
The immediate bias stays on the upside while DXY holds above 100.02. A decisive break of 100.58 would extend the rebound toward the 101.80 high.
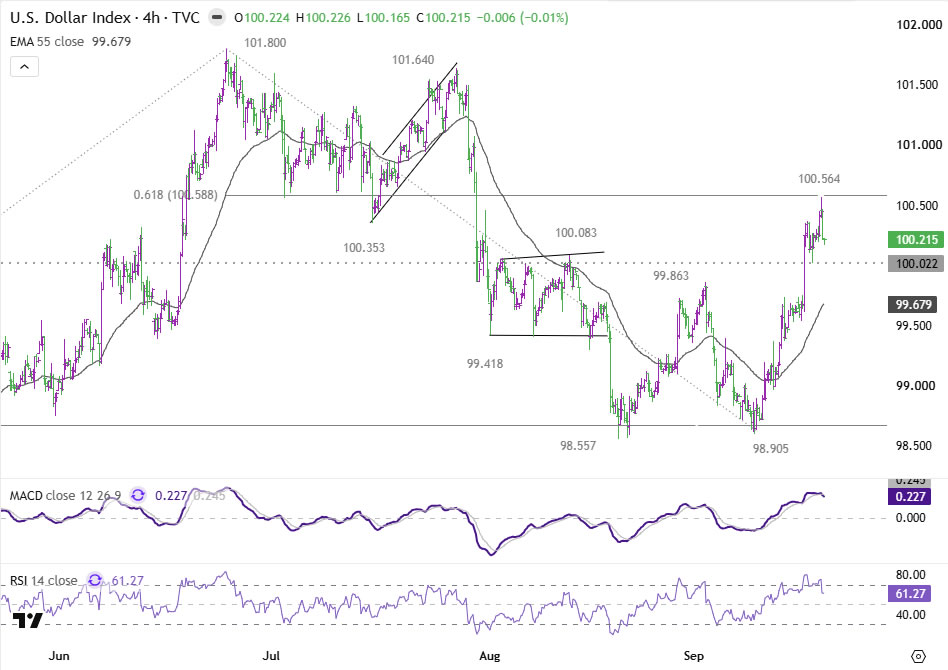
However, a rejection in the 2-year yield from 4.791–4.800%, followed by a break of its 4.600% support, would weaken one of the Dollar rally’s principal supports. A corresponding DXY break below 100.02 could then trigger a deeper pullback toward the 4-hour 55 EMA, currently near 99.68.
A sustained Dollar breakout would carry greater macro confirmation if the 2-year yield clears 4.800% and Fed futures begin lifting the expected policy destination. Without that confirmation, DXY could still reach 101.80, but the move would rely more heavily on front-end momentum than on a fully synchronized cross-market repricing, alongside the development in other currencies, in particular Euro and Yen.
Brent: The $100 Test Is the Upstream Decision
Brent appears last in the market sequence, but it functions as the upstream variable. Warsh’s language shaped how markets interpreted the Fed’s response, while energy prices remain one of the principal inputs determining how much additional inflation pressure the Fed may ultimately have to confront.
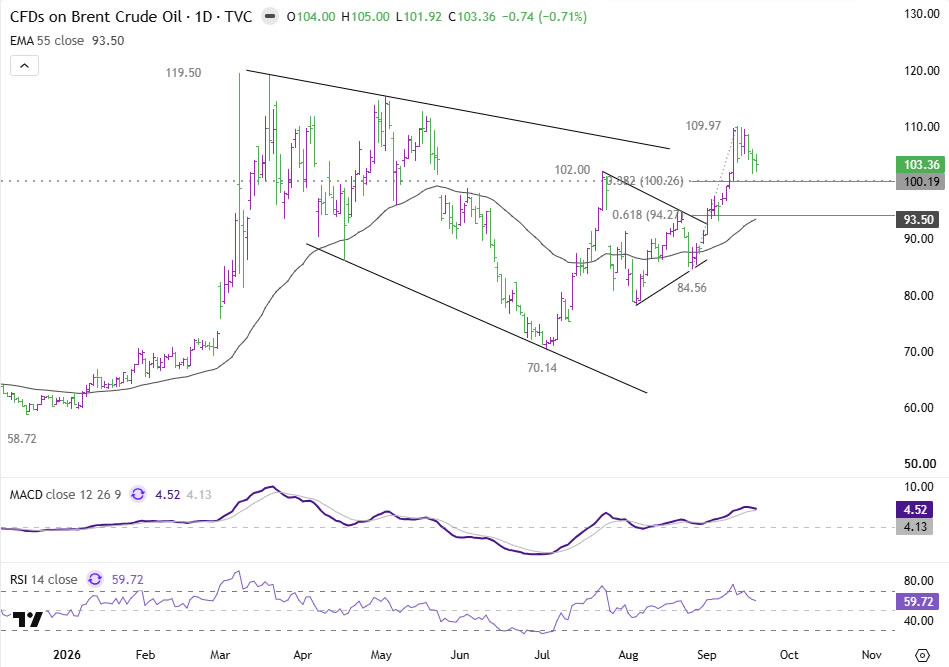
Brent retreated from 109.97 late in the week, but the decline hasn’t yet established a reversal. The central support zone is formed by the psychological $100 level and the 38.2% retracement of the rise from 84.56 to 109.97 at 100.26. The convergence of a round number and a Fibonacci level gives the area greater technical significance.
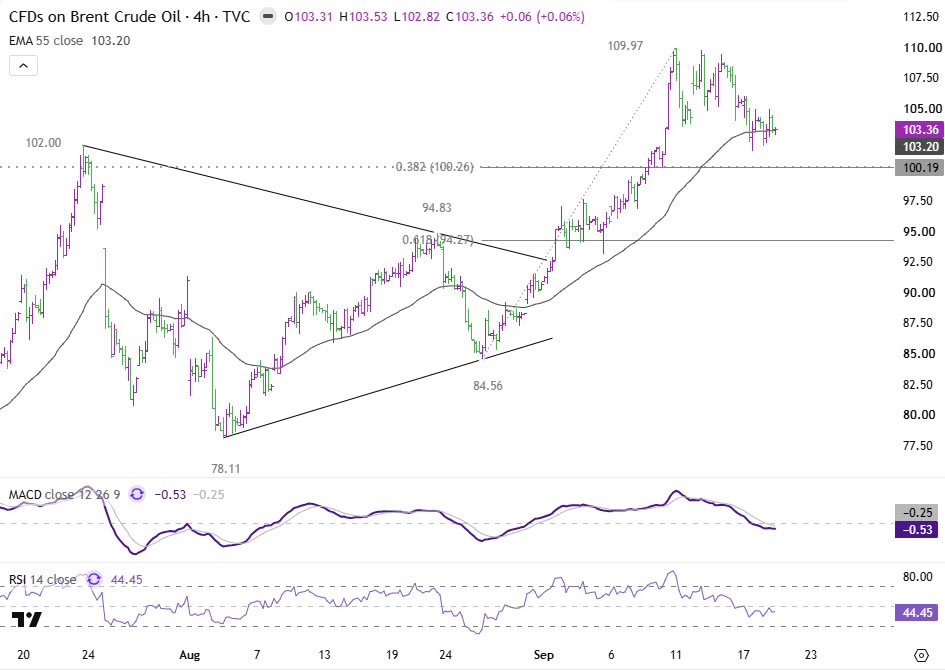
As long as $100–100.26 holds, the decline from 109.97 can still be treated as a correction within the rise from 84.56. A renewed advance through 109.97 would reopen the path toward the 119.50 cycle high.
A clean break below $100 would be the first warning that the correction is deepening. A subsequent break of the 61.8% retracement at 94.27 would provide much stronger evidence that the rise from 84.56 has reversed.
One System, One Sequence to Watch
The next market sequence is unusually clear. Brent must resolve its $100–100.26 support test first. A rebound would preserve the energy-inflation pressure capable of lifting the Fed’s expected policy destination, rather than merely bringing the next hike forward.
That response would determine whether the 2-year yield can clear 4.791–4.800% with genuine policy confirmation or whether it reverses toward the broader futures-implied path. DXY’s test of 100.58 is the final downstream expression.
Warsh’s “dose of accommodation” gave the market a hawkish direction. Oil, Fed futures, and the Treasury curve must now determine how far that direction can carry rates—and whether the Dollar has enough confirmation to resume its advance toward 101.80.
Key Takeaways
- Warsh’s “dose of accommodation” language pushed the 2-year yield up 12.6bp and the Dollar higher, but Fed funds futures barely shifted the December 2027 expected policy destination.
- October hike odds rose from 44.0% to 57.6%, showing markets repriced timing sharply while the longer-run average expected rate stayed near 4.50% both before and after.
- The 2-year yield’s concentrated move (vs. a falling 30-year) points to near-term policy repricing rather than a broader fiscal-credibility or duration-risk shock.
- DXY completed a double bottom and stalled almost exactly at 100.58 resistance, with a sustained breakout needing the 2-year yield to clear 4.800% for full confirmation.
- Brent’s $100-100.26 support zone is the upstream variable in the whole chain; holding it preserves the inflation pressure needed for the 2-year yield and Dollar moves to gain genuine confirmation rather than fading.





